micrometer自定义metrics
micrometer提供了基于Java的monitor facade,其与springboot应用和prometheus的集成方式如下图展示
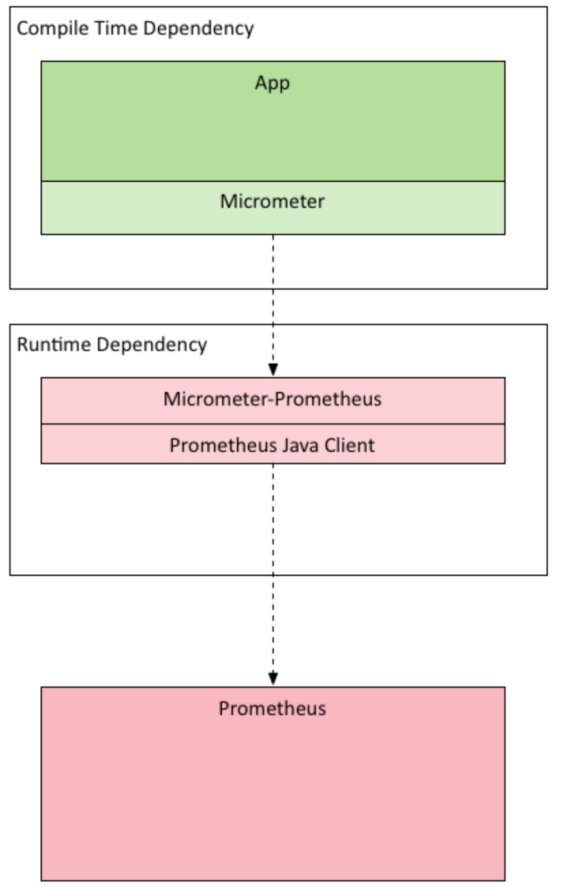
上图中展示的很清楚,应用通过micrometer采集和暴露监控端点给prometheus,prometheus通过pull模式来采集监控时序数据信息。之后作为数据源提供给grafana进行展示。
micrometer支持的度量方式及在springboot中的应用示例
Counter
Counter(计数器)简单理解就是一种只增不减的计数器。它通常用于记录服务的请求数量、完成的任务数量、错误的发生数量等等。
package com.dxz.producter.monitor;

import org.springframework.stereotype.Service;

import io.micrometer.core.instrument.Counter;

import io.micrometer.core.instrument.Metrics;

@Service("collectorService")

public class CollectorService {

    static final Counter userCounter = Metrics.counter("user.counter.total", "services", "demo");

    public void processCollectResult() throws InterruptedException {

        while (true) {

            userCounter.increment(1D);

        }

    }

}
Gauge
Gauge(仪表)是一个表示单个数值的度量,它可以表示任意地上下移动的数值测量。Gauge通常用于变动的测量值,如当前的内存使用情况,同时也可以测量上下移动的"计数",比如队列中的消息数量。
package com.dxz.producter.monitor;

import java.util.ArrayList;

import java.util.List;

import java.util.concurrent.atomic.AtomicInteger;

import org.springframework.stereotype.Component;

import io.micrometer.core.instrument.Gauge;

import io.micrometer.core.instrument.ImmutableTag;

import io.micrometer.core.instrument.Metrics;

import io.micrometer.core.instrument.Tag;

import io.micrometer.core.instrument.simple.SimpleMeterRegistry;

@Component("passCaseMetric")

public class PassCaseMetric {

    List<Tag> init() {

        ArrayList<Tag> list = new ArrayList() {

        };

        list.add(new ImmutableTag("service", "demo"));

        return list;

    }

    AtomicInteger atomicInteger = new AtomicInteger(0);

    Gauge passCaseGuage = Gauge.builder("pass.cases.guage", atomicInteger, AtomicInteger::get).tag("service", "demo")

            .description("pass cases guage of demo").register(new SimpleMeterRegistry());

    AtomicInteger passCases = Metrics.gauge("pass.cases.guage.value", init(), atomicInteger);

    public void handleMetrics() {

        while (true) {

            if (System.currentTimeMillis() % 2 == 0) {

                passCases.addAndGet(100);

                System.out.println("ADD + " + passCaseGuage.measure() + " : " + passCases);

            } else {

                int val = passCases.addAndGet(-100);

                if (val < 0) {

                    passCases.set(1);

                }

                System.out.println("DECR - " + passCaseGuage.measure() + " : " + passCases);

            }

        }

    }

}
增加一个controller,触发他们:
package com.dxz.producter.web;

import org.springframework.beans.factory.annotation.Autowired;

import org.springframework.web.bind.annotation.RequestMapping;

import org.springframework.web.bind.annotation.RequestMethod;

import org.springframework.web.bind.annotation.RestController;

import com.dxz.producter.monitor.CollectorService;

import com.dxz.producter.monitor.PassCaseMetric;

@RestController

@RequestMapping("/monitor")

public class MonitorController {

    @Autowired

    CollectorService collectorService;

    @Autowired

    PassCaseMetric passCaseMetric;

    @RequestMapping(value = "/counter", method = RequestMethod.GET)

    public String counter() throws InterruptedException {

        collectorService.processCollectResult();

        return "+1";

    }

    @RequestMapping(value = "/gauge", method = RequestMethod.GET)

    public String gauge() throws InterruptedException {

        passCaseMetric.handleMetrics();

        return "+gauge";

    }

}
启动springboot应用,可以在http://host:port/actuator/prometheus 看到端点收集到的数据。其他的也是类似的不再一一截图展示。

这里使用了一个true的循环用来展示不断更新的效果。
同样的可以在grafana中看到监控展示信息
Timer
Timer(计时器)同时测量一个特定的代码逻辑块的调用(执行)速度和它的时间分布。简单来说,就是在调用结束的时间点记录整个调用块执行的总时间,适用于测量短时间执行的事件的耗时分布,例如消息队列消息的消费速率。
@Test

    public void testTimerSample(){

        Timer timer = Timer.builder("timer")

                .tag("timer", "timersample")

                .description("timer sample test.")

                .register(new SimpleMeterRegistry());

        for(int i=0; i<2; i++) {

            timer.record(() -> {

                try {

                    TimeUnit.SECONDS.sleep(2);

                }catch (InterruptedException e){

                }

            });

        }

        System.out.println(timer.count());

        System.out.println(timer.measure());

        System.out.println(timer.totalTime(TimeUnit.SECONDS));

        System.out.println(timer.mean(TimeUnit.SECONDS));

        System.out.println(timer.max(TimeUnit.SECONDS));

    }
响应数据
2

[Measurement{statistic='COUNT', value=2.0}, Measurement{statistic='TOTAL_TIME', value=4.005095763}, Measurement{statistic='MAX', value=2.004500494}]

4.005095763

2.0025478815

2.004500494
Summary
Summary(摘要)用于跟踪事件的分布。它类似于一个计时器,但更一般的情况是,它的大小并不一定是一段时间的测量值。在micrometer中,对应的类是DistributionSummary,它的用法有点像Timer,但是记录的值是需要直接指定,而不是通过测量一个任务的执行时间。
@Test

    public void testSummary(){

        DistributionSummary summary = DistributionSummary.builder("summary")

                .tag("summary", "summarySample")

                .description("summary sample test")

                .register(new SimpleMeterRegistry());

        summary.record(2D);

        summary.record(3D);

        summary.record(4D);

        System.out.println(summary.count());

        System.out.println(summary.measure());

        System.out.println(summary.max());

        System.out.println(summary.mean());

        System.out.println(summary.totalAmount());

    }
响应数据:
3

[Measurement{statistic='COUNT', value=3.0}, Measurement{statistic='TOTAL', value=9.0}, Measurement{statistic='MAX', value=4.0}]

4.0

3.0

9.0
序
本文主要研究下如何使用自定义micrometer的metrics
实例
DemoMetrics
public class DemoMetrics implements MeterBinder {

    AtomicInteger count = new AtomicInteger(0);

    @Override

    public void bindTo(MeterRegistry meterRegistry) {

        Gauge.builder("demo.count", count, c -> c.incrementAndGet())

                .tags("host", "localhost")

                .description("demo of custom meter binder")

                .register(meterRegistry);

    }

}
这里实现了MeterBinder接口的bindTo方法,将要采集的指标注册到MeterRegistry
注册
- 原始方式
new DemoMetrics().bindTo(registry);- springboot autoconfigure
@Bean

public DemoMetrics demoMetrics(){

    return new DemoMetrics();

}
在springboot只要标注下bean,注入到spring容器后,springboot会自动注册到registry。springboot已经帮你初始化了包括UptimeMetrics等一系列metrics。详见源码解析部分。
验证
curl -i http://localhost:8080/actuator/metrics/demo.count返回实例
{

  "name": "demo.count",

  "measurements": [

    {

      "statistic": "VALUE",

      "value": 6

    }

  ],

  "availableTags": [

    {

      "tag": "host",

      "values": [

        "localhost"

      ]

    }

  ]

}
源码解析
MetricsAutoConfiguration
spring-boot-actuator-autoconfigure-2.0.0.RELEASE-sources.jar!/org/springframework/boot/actuate/autoconfigure/metrics/MetricsAutoConfiguration.java
@Configuration

@ConditionalOnClass(Timed.class)

@EnableConfigurationProperties(MetricsProperties.class)

@AutoConfigureBefore(CompositeMeterRegistryAutoConfiguration.class)

public class MetricsAutoConfiguration {

    @Bean

    @ConditionalOnMissingBean

    public Clock micrometerClock() {

        return Clock.SYSTEM;

    }

    @Bean

    public static MeterRegistryPostProcessor meterRegistryPostProcessor(

            ApplicationContext context) {

        return new MeterRegistryPostProcessor(context);

    }

    @Bean

    @Order(0)

    public PropertiesMeterFilter propertiesMeterFilter(MetricsProperties properties) {

        return new PropertiesMeterFilter(properties);

    }

    @Configuration

    @ConditionalOnProperty(value = "management.metrics.binders.jvm.enabled", matchIfMissing = true)

    static class JvmMeterBindersConfiguration {

        @Bean

        @ConditionalOnMissingBean

        public JvmGcMetrics jvmGcMetrics() {

            return new JvmGcMetrics();

        }

        @Bean

        @ConditionalOnMissingBean

        public JvmMemoryMetrics jvmMemoryMetrics() {

            return new JvmMemoryMetrics();

        }

        @Bean

        @ConditionalOnMissingBean

        public JvmThreadMetrics jvmThreadMetrics() {

            return new JvmThreadMetrics();

        }

        @Bean

        @ConditionalOnMissingBean

        public ClassLoaderMetrics classLoaderMetrics() {

            return new ClassLoaderMetrics();

        }

    }

    @Configuration

    static class MeterBindersConfiguration {

        @Bean

        @ConditionalOnClass(name = { "ch.qos.logback.classic.LoggerContext",

                "org.slf4j.LoggerFactory" })

        @Conditional(LogbackLoggingCondition.class)

        @ConditionalOnMissingBean(LogbackMetrics.class)

        @ConditionalOnProperty(value = "management.metrics.binders.logback.enabled", matchIfMissing = true)

        public LogbackMetrics logbackMetrics() {

            return new LogbackMetrics();

        }

        @Bean

        @ConditionalOnProperty(value = "management.metrics.binders.uptime.enabled", matchIfMissing = true)

        @ConditionalOnMissingBean

        public UptimeMetrics uptimeMetrics() {

            return new UptimeMetrics();

        }

        @Bean

        @ConditionalOnProperty(value = "management.metrics.binders.processor.enabled", matchIfMissing = true)

        @ConditionalOnMissingBean

        public ProcessorMetrics processorMetrics() {

            return new ProcessorMetrics();

        }

        @Bean

        @ConditionalOnProperty(name = "management.metrics.binders.files.enabled", matchIfMissing = true)

        @ConditionalOnMissingBean

        public FileDescriptorMetrics fileDescriptorMetrics() {

            return new FileDescriptorMetrics();

        }

    }

    static class LogbackLoggingCondition extends SpringBootCondition {

        @Override

        public ConditionOutcome getMatchOutcome(ConditionContext context,

                AnnotatedTypeMetadata metadata) {

            ILoggerFactory loggerFactory = LoggerFactory.getILoggerFactory();

            ConditionMessage.Builder message = ConditionMessage

                    .forCondition("LogbackLoggingCondition");

            if (loggerFactory instanceof LoggerContext) {

                return ConditionOutcome.match(

                        message.because("ILoggerFactory is a Logback LoggerContext"));

            }

            return ConditionOutcome

                    .noMatch(message.because("ILoggerFactory is an instance of "

                            + loggerFactory.getClass().getCanonicalName()));

        }

    }

}
可以看到这里注册了好多metrics,比如UptimeMetrics,JvmGcMetrics,ProcessorMetrics,FileDescriptorMetrics等
这里重点看使用@Bean标注了MeterRegistryPostProcessor
MeterRegistryPostProcessor
spring-boot-actuator-autoconfigure-2.0.0.RELEASE-sources.jar!/org/springframework/boot/actuate/autoconfigure/metrics/MeterRegistryPostProcessor.java
class MeterRegistryPostProcessor implements BeanPostProcessor {

    private final ApplicationContext context;

    private volatile MeterRegistryConfigurer configurer;

    MeterRegistryPostProcessor(ApplicationContext context) {

        this.context = context;

    }

    @Override

    public Object postProcessAfterInitialization(Object bean, String beanName)

            throws BeansException {

        if (bean instanceof MeterRegistry) {

            getConfigurer().configure((MeterRegistry) bean);

        }

        return bean;

    }

    @SuppressWarnings("unchecked")

    private MeterRegistryConfigurer getConfigurer() {

        if (this.configurer == null) {

            this.configurer = new MeterRegistryConfigurer(beansOfType(MeterBinder.class),

                    beansOfType(MeterFilter.class),

                    (Collection<MeterRegistryCustomizer<?>>) (Object) beansOfType(

                            MeterRegistryCustomizer.class),

                    this.context.getBean(MetricsProperties.class).isUseGlobalRegistry());

        }

        return this.configurer;

    }

    private <T> Collection<T> beansOfType(Class<T> type) {

        return this.context.getBeansOfType(type).values();

    }

}
可以看到这里new了一个MeterRegistryConfigurer,重点注意这里使用beansOfType(MeterBinder.class)方法的返回值给其构造器
MeterRegistryConfigurer
spring-boot-actuator-autoconfigure-2.0.0.RELEASE-sources.jar!/org/springframework/boot/actuate/autoconfigure/metrics/MeterRegistryConfigurer.java
class MeterRegistryConfigurer {

    private final Collection<MeterRegistryCustomizer<?>> customizers;

    private final Collection<MeterFilter> filters;

    private final Collection<MeterBinder> binders;

    private final boolean addToGlobalRegistry;

    MeterRegistryConfigurer(Collection<MeterBinder> binders,

            Collection<MeterFilter> filters,

            Collection<MeterRegistryCustomizer<?>> customizers,

            boolean addToGlobalRegistry) {

        this.binders = (binders != null ? binders : Collections.emptyList());

        this.filters = (filters != null ? filters : Collections.emptyList());

        this.customizers = (customizers != null ? customizers : Collections.emptyList());

        this.addToGlobalRegistry = addToGlobalRegistry;

    }

    void configure(MeterRegistry registry) {

        if (registry instanceof CompositeMeterRegistry) {

            return;

        }

        // Customizers must be applied before binders, as they may add custom

        // tags or alter timer or summary configuration.

        customize(registry);

        addFilters(registry);

        addBinders(registry);

        if (this.addToGlobalRegistry && registry != Metrics.globalRegistry) {

            Metrics.addRegistry(registry);

        }

    }

    @SuppressWarnings("unchecked")

    private void customize(MeterRegistry registry) {

        LambdaSafe.callbacks(MeterRegistryCustomizer.class, this.customizers, registry)

                .withLogger(MeterRegistryConfigurer.class)

                .invoke((customizer) -> customizer.customize(registry));

    }

    private void addFilters(MeterRegistry registry) {

        this.filters.forEach(registry.config()::meterFilter);

    }

    private void addBinders(MeterRegistry registry) {

        this.binders.forEach((binder) -> binder.bindTo(registry));

    }

}
可以看到configure方法里头调用了addBinders,也就是把托管给spring容器的MeterBinder实例bindTo到meterRegistry
小结
springboot2引入的micrometer,自定义metrics只需要实现MeterBinder接口,然后托管给spring即可,springboot的autoconfigure帮你自动注册到meterRegistry。
micrometer自定义metrics的更多相关文章
- 自定义Metrics:让Prometheus监控你的应用程序
前言 Prometheus社区提供了大量的官方以及第三方Exporters,可以满足Prometheus的采纳者快速实现对关键业务,以及基础设施的监控需求. 如上所示,一个简单的应用以及环境架构.一般 ...
- Spring Boot 2.x 自定义metrics 并导出到influxdb
Step 1.添加依赖 <dependency> <groupId>org.springframework.boot</groupId> <artifactI ...
- Spring cloud微服务安全实战-7-6自定义metrics监控指标(1)
自己写代码来定义一个metrics,然后让prmetheus收走,在grafana里面定义一个panel并展示出来. prometheus的四种metrics指标.虽然所有的metrics都是数字,但 ...
- Spring cloud微服务安全实战-7-7自定义metrics监控指标(2)
Gauge用来显示单词一个数的 勾选,这里编程仪表盘 设置仪表盘的最大值.最小值 保存 直接保存 保存成功的提示 返回 这就是我们做的一个简单的仪表盘 这个不适合我们的counter,因为没有最大值 ...
- Springboot2 Metrics之actuator集成influxdb, Grafana提供监控和报警
到目前为止,各种日志收集,统计监控开源组件数不胜数,即便如此还是会有很多人只是tail -f查看一下日志文件.随着容器化技术的成熟,日志和metrics度量统计已经不能仅仅靠tail -f来查看了,你 ...
- 如何用prometheus监控k8s集群中业务pod的metrics
一般,我们从网上看到的帖子和资料, 都是用prometheus监控k8s的各项资源, 如api server, namespace, pod, node等. 那如果是自己的业务pod上的自定义metr ...
- Apache Flink 进阶(八):详解 Metrics 原理与实战
本文由 Apache Flink Contributor 刘彪分享,本文对两大问题进行了详细的介绍,即什么是 Metrics.如何使用 Metrics,并对 Metrics 监控实战进行解释说明. 什 ...
- hystrix文档翻译之metrics
metrics和监控 动机 HystrixCommands和HystrixObservableCommands执行过程中会产生相关运行情况的metrics.这些metrics对于监控系统表现有很大的 ...
- 朱晔和你聊Spring系列S1E7:简单好用的Spring Boot Actuator
阅读PDF版本 本文会来看一下Spring Boot Actuator提供给我们的监控端点Endpoint.健康检查Health和打点指标Metrics等所谓的Production-ready(生产环 ...
随机推荐
- linux 基础命令,未完待续
1, cd 进入系统根目录 cd / 进入当前用户的主目录 cd ~ 进入当前目录的上一级目录 cd .. 跳转到指定目录,从根目录开始 cd /apps/ 2, pwd 查看当前工作目录的完整路径 ...
- python网络爬虫&&爬取网易云音乐
#爬取网易云音乐 url="https://music.163.com/discover/toplist" #歌单连接地址 url2 = 'http://music.163.com ...
- python之模块定义、导入、优化详解
一.模块 1.模块的定义 模块是一组包含了一组功能的python文件,比如test.py,模块名为test,可以通过import test进行调用.模块可以分为以下四个通用类别 1 使用python编 ...
- IIS SSL证书 指定的登录会话不存在,可能已被终止 HRESULT:0x80070520
指定的登录会话不存在,可能已被终止 HRESULT:0x80070520 IIS导入证书时,选择”允许导出此证书” 服务器证书名称,在mmc控制台中个人证书中命名
- [Leetcode 105]*前序后序遍历形成树
public TreeNode find(int[] preorder, int[] inorder,int j, int start, int end) { if (j > preorder. ...
- centos7源码安装Python3的前提条件
centos7源码安装Python3的前提条件: # yum -y install openssl-devel bzip2-devel expat-devel gdbm-devel readline- ...
- SpringMvc开发报找不到springmvc配置文件
param-name标签属性值必须为contextConfigLocation
- Redis常用命令与高级应用
附: 127.0.0.1:6379> set xiaofei 小飞 OK 127.0.0.1:6379> get xiaofei "\xe5\xb0\x8f\xe9\xa3\x9 ...
- 在HTML中用循环语句
<%for(){% > <tr> <td></td> <td></td> </tr> <%}%> 注意 ...
- 5.使用std的迭代器访问并修改图像
void Test_ColorReduceByIterator() { Mat g_srcImage=imread("D:\\OpenCV Projects\\OpenCV_Test_Ima ...