Prometheus 和 Alertmanager实战配置
Prometheus时序数据库
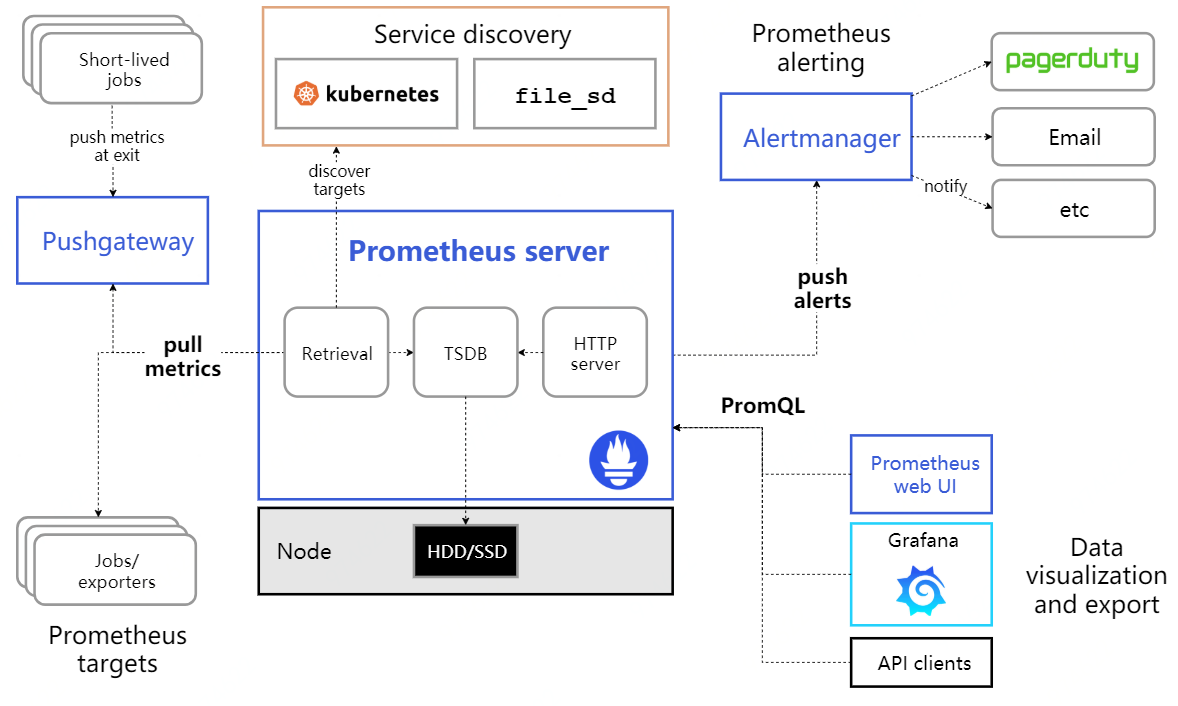
一、Prometheus
1、Prometheus安装
1)源码安装
prometheus安装包最新版本下载地址:https://prometheus.io/download/
wget https://github.com/prometheus/prometheus/releases/download/v2.3.2/prometheus-2.3.2.linux-amd64.tar.gz

tar txvf prometheus-2.3..linux-amd64.tar.gz

cd prometheus-2.3..linux-amd64.tar.gz

./prometheus --config.file=prometheus.yml
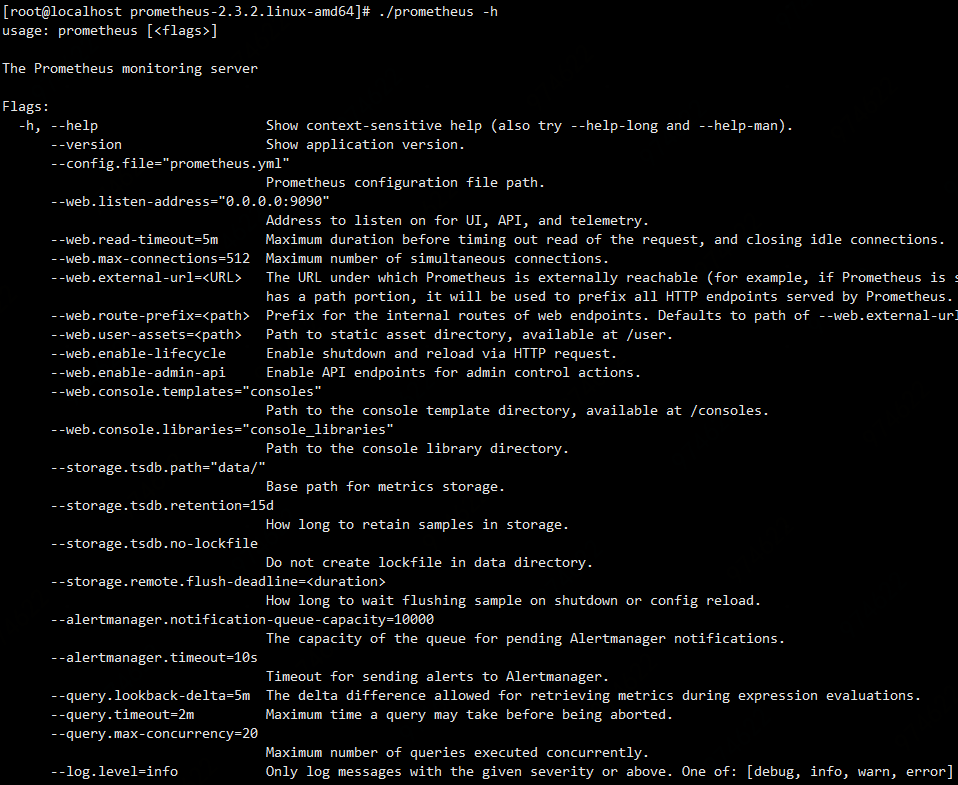
注:通过执行
./prometheus -h
可以查看具体得执行参数,参数后面可以查看默认得参数。如下图所示。
2)docker 方式安装(前提docker已经安装完毕)
创建目录和prometheus配置文件
mkdir /prometheus

vim /prometheus/prometheus.yml
注:对于prometheus.yml文件的配置,稍后详细介绍。
拉取prometheus镜像
docker pull prom/prometheus
启动prometheus
docker run -d -p : --name prometheus -v /home/prometheus.yml:/etc/prometheus/prometheus.yml prom/prometheus
注:参数的简要说明
a、-d选项启动独立模式下的prometheus容器,这意味着容器将在后台启动,这种情况下只有stop docker才可以关闭prometheus,而不能执行ctrl+c
b、-p选择指定端口号映射,通过访问本机的9090端口,即可访问prometheus容器的9090端口
c、--name指定容器的名称
d、-v选项建立本机文件和docker内文件的映射
e、--config.file指定运行docker内prometheus的配置文件
2、prometheus配置文件的设定
prometheus的配置文件采用的是yaml文件,yaml文件书写的要求如下:
大小写敏感

使用缩进表示层级关系

缩进时不允许使用Tab键,只允许使用空格。

缩进的空格数目不重要,只要相同层级的元素左侧对齐即可
prometheus.yml的样例
# Prometheus全局配置项

global:

  scrape_interval:     15s # 设定抓取数据的周期,默认为1min

  evaluation_interval: 15s # 设定更新rules文件的周期,默认为1min

  scrape_timeout: 15s # 设定抓取数据的超时时间,默认为10s
  external_labels: # 额外的属性,会添加到拉取得数据并存到数据库中
   monitor: 'codelab_monitor'

# Alertmanager配置

alerting:

 alertmanagers:

 - static_configs:

   - targets: ["localhost:9093"] # 设定alertmanager和prometheus交互的接口,即alertmanager监听的ip地址和端口

# rule配置,首次读取默认加载,之后根据evaluation_interval设定的周期加载

rule_files:

 - "alertmanager_rules.yml"

 - "prometheus_rules.yml"

# scape配置

scrape_configs:

- job_name: 'prometheus' # job_name默认写入timeseries的labels中,可以用于查询使用

  scrape_interval: 15s # 抓取周期,默认采用global配置

  static_configs: # 静态配置

  - targets: ['localdns:9090'] # prometheus所要抓取数据的地址,即instance实例项

- job_name: 'example-random'

  static_configs:

  - targets: ['localhost:8080']
3、动态更新prometheus的配置项
动态更新Prometheus的配置,即热更新加载,一共有两种方式:
1)向prometheus进程发送SIGHUP信号
2)curl -X POST http://localdns:9090/-/reload
参考链接:https://songjiayang.gitbooks.io/prometheus/content/qa/hotreload.html
4、prometheus数据展示
此处介绍两种Prometheus数据界面化显示的方式。
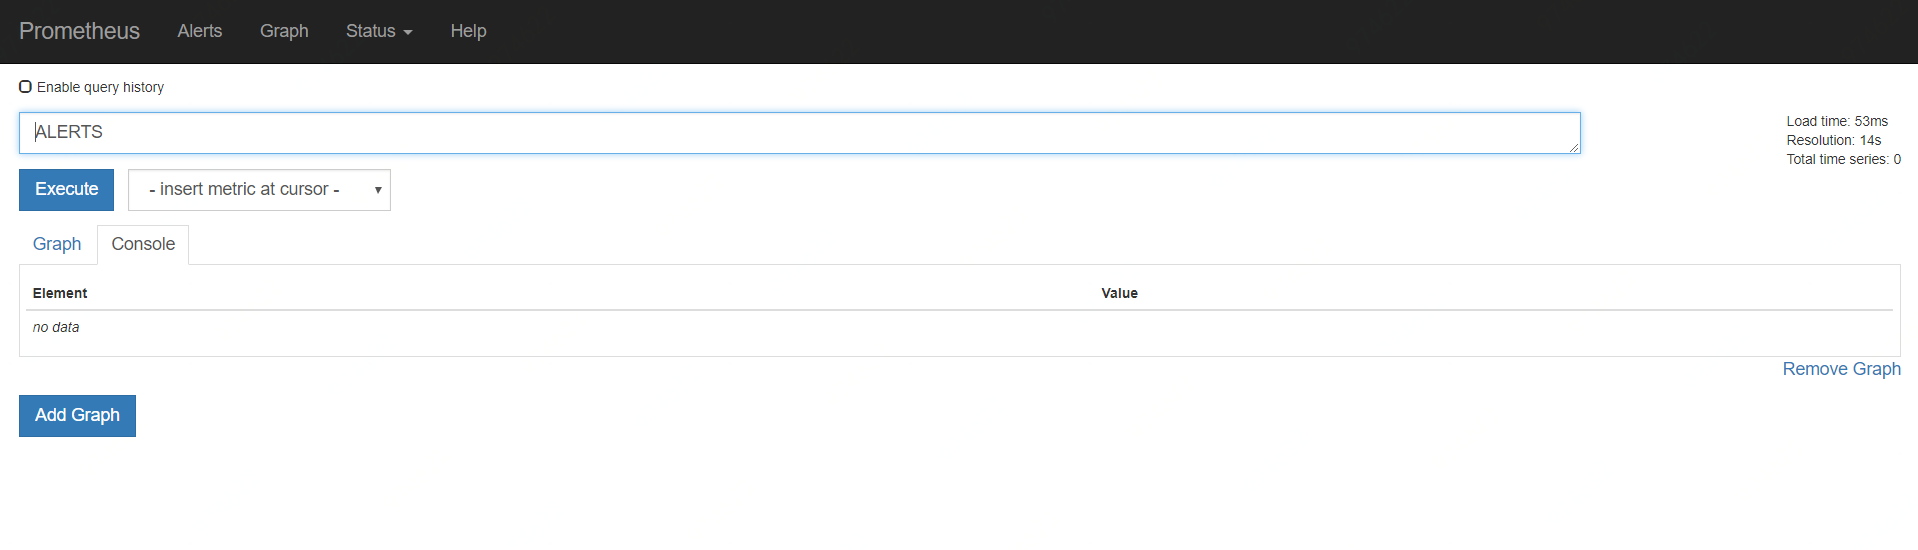
1)表达式浏览器
在浏览器中,输入部署prometheus数据库的机器ip地址以及端口号
http://localdns:9090/graph
界面展示如下,就可以通过浏览器查看Prometheus中的数据。
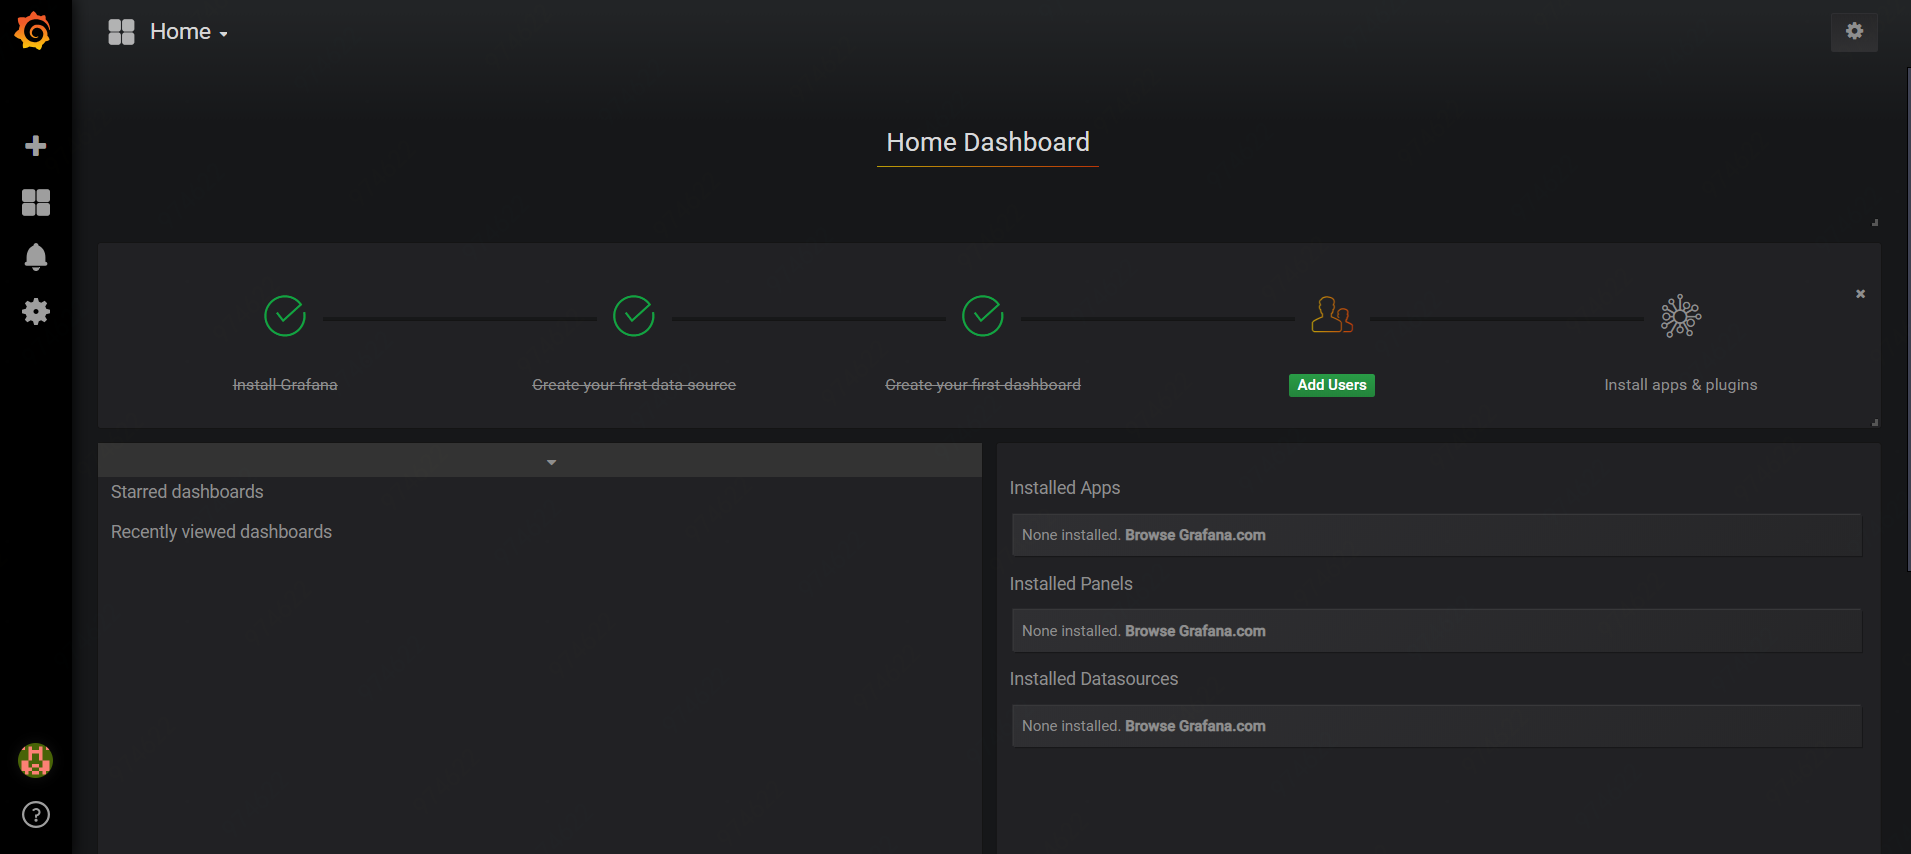
2)Grafana图形界面
安装启动
wget https://s3-us-west-2.amazonaws.com/grafana-releases/release/grafana-5.2.3.linux-amd64.tar.gz

tar zxvf grafana-5.2..linux-amd64.tar.gz

cd grafana-5.2..linux-amd64.tar.gz

bin/grafana-server web
Grafana默认服务端口号为3000,通过浏览器对Grafana进行访问。
http://localdns:3000
默认登录名密码为"admin/admin"。
创建一个Prometheus数据源Data source:
 在左侧工具栏中,点击"Configuration"菜单。

 点击"Data Sources"。

 点击"Add data source"。

 数据源Type选择“Prometheus”。

 设置Prometheus服务访问地址(例如:http://localhost:9090)。

 调整其他想要的设置(例如:关闭代理访问)。

 点击“Add”按钮,保存这个新数据源。
之后,通过添加仪表盘(dashboards)进行数据的展示。
二、Alertmanager(email报警)
1、Alertmanager安装
源码安装
mkdir -p $GOPATH/src/github.com/prometheus

cd $GOPATH/src/github.com/prometheus

git clone https://github.com/prometheus/alertmanager.git

cd alertmanager

make build
启动
./alertmanager-config.file= alertmanager.yml #默认配置项为alertmanager.yml
注:alertmanager.yml配置文件,默认是不存在的,需要新建。
2、alertmanager.yml的配置
# 全局配置项
global:
resolve_timeout: 5m #处理超时时间,默认为5min
smtp_smarthost: 'smtp.sina.com:25' # 邮箱smtp服务器代理
smtp_from: '******@sina.com' # 发送邮箱名称
smtp_auth_username: '******@sina.com' # 邮箱名称
smtp_auth_password: '******' # 邮箱密码或授权码
wechat_api_url: 'https://qyapi.weixin.qq.com/cgi-bin/' # 企业微信地址 # 定义模板信心
templates:
- 'template/*.tmpl'
# 定义路由树信息
route:
group_by: ['alertname'] # 报警分组依据
group_wait: 10s # 最初即第一次等待多久时间发送一组警报的通知
group_interval: 10s # 在发送新警报前的等待时间
repeat_interval: 1m # 发送重复警报的周期 对于email配置中,此项不可以设置过低,否则将会由于邮件发送太多频繁,被smtp服务器拒绝
receiver: 'email' # 发送警报的接收者的名称,以下receivers name的名称 # 定义警报接收者信息
receivers:
- name: 'email' # 警报
email_configs: # 邮箱配置
- to: '******@163.com' # 接收警报的email配置
html: '{{ template "test.html" . }}' # 设定邮箱的内容模板
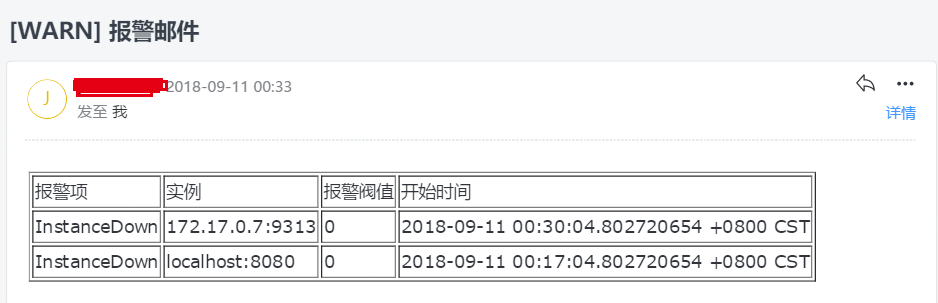
headers: { Subject: "[WARN] 报警邮件"} # 接收邮件的标题
webhook_configs: # webhook配置
- url: 'http://127.0.0.1:5001'
send_resolved: true
wechat_configs: # 企业微信报警配置
- send_resolved: true
to_party: '1' # 接收组的id
agent_id: '1000002' # (企业微信-->自定应用-->AgentId)
corp_id: '******' # 企业信息(我的企业-->CorpId[在底部])
api_secret: '******' # 企业微信(企业微信-->自定应用-->Secret)
message: '{{ template "test_wechat.html" . }}' # 发送消息模板的设定
# 一个inhibition规则是在与另一组匹配器匹配的警报存在的条件下,使匹配一组匹配器的警报失效的规则。两个警报必须具有一组相同的标签。
inhibit_rules:
  - source_match:
     severity: 'critical'
    target_match:
     severity: 'warning'
    equal: ['alertname', 'dev', 'instance']
注:
1)repeat_interval配置项,对于email来说,此项不可以设置过低,否则将会由于邮件发送太多频繁,被smtp服务器拒绝
2)企业微信注册地址:https://work.weixin.qq.com
上述配置的email、webhook和wechat三种报警方式。目前Alertmanager所有的报警方式有以下几个方面:
email_config

hipchat_config

pagerduty_config

pushover_config

slack_config

opsgenie_config

victorops_config
3、.tmpl模板的配置
1)test.tmpl
{{ define "test.html" }}

<table border="1">

        <tr>

                <td>报警项</td>

                <td>实例</td>

                <td>报警阀值</td>

                <td>开始时间</td>

        </tr>

        {{ range $i, $alert := .Alerts }}

                <tr>

                        <td>{{ index $alert.Labels "alertname" }}</td>

                        <td>{{ index $alert.Labels "instance" }}</td>

                        <td>{{ index $alert.Annotations "value" }}</td>

                        <td>{{ $alert.StartsAt }}</td>

                </tr>

        {{ end }}

</table>

{{ end }}
注:上述Labels项,表示prometheus里面的可选label项。annotation项表示报警规则中定义的annotation项的内容。
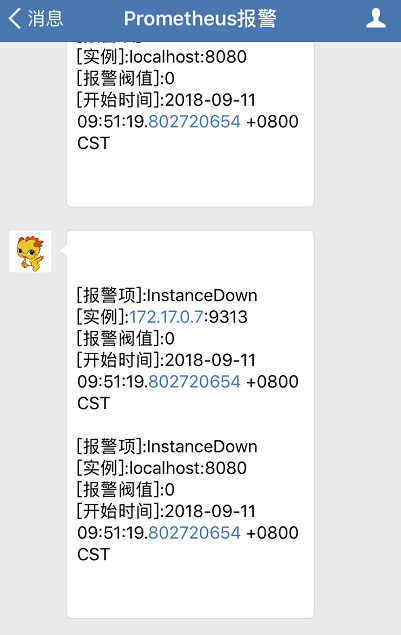
2)test_wechat.tmpl
{{ define "cdn_live_wechat.html" }}

  {{ range $i, $alert := .Alerts.Firing }}

    [报警项]:{{ index $alert.Labels "alertname" }}

    [实例]:{{ index $alert.Labels "instance" }}

    [报警阀值]:{{ index $alert.Annotations "value" }}

    [开始时间]:{{ $alert.StartsAt }}

  {{ end }}

{{ end }}
注:此处range遍历项与email模板中略有不同,只遍历当前没有处理的报警(Firing)。此项如果不设置,则在Alert中已经Resolved的报警项,也会被发送到企业微信。
4、在Prometheus模块定义告警规则
alertmanager_rules.yml样例配置文件(与prometheus同目录下)
groups:

 - name: test-rules

   rules:

   - alert: InstanceDown # 告警名称

     expr: up == 0 # 告警的判定条件,参考Prometheus高级查询来设定

     for: 2m # 满足告警条件持续时间多久后,才会发送告警

     labels: #标签项

      team: node

     annotations: # 解析项,详细解释告警信息

      summary: "{{$labels.instance}}: has been down"

      description: "{{$labels.instance}}: job {{$labels.job}} has been down "
      value: {{$value}}
5、告警信息生命周期的3中状态
1)inactive:表示当前报警信息即不是firing状态也不是pending状态
2)pending:表示在设置的阈值时间范围内被激活的
3)firing:表示超过设置的阈值时间被激活的
三、结果展示
启动prometheus和alertmanager,满足报警条件后,就可以收到报警邮件了。
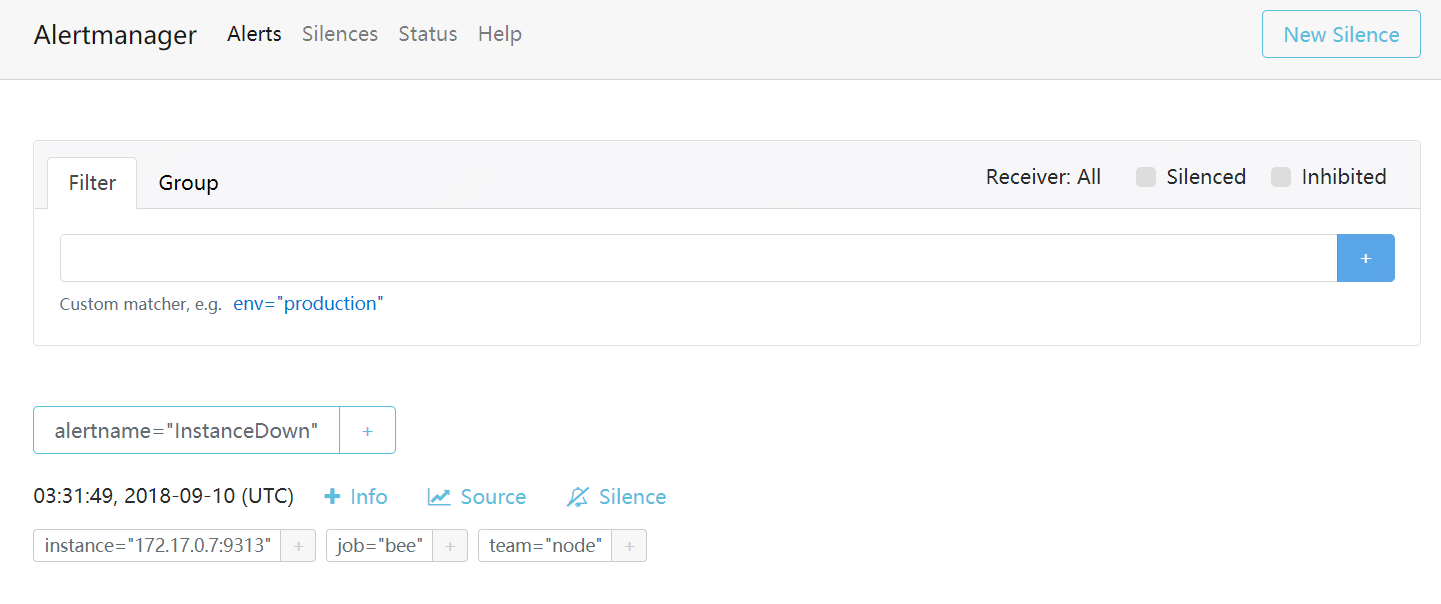
1、浏览器界面化告警展示
在浏览器输入alertmanager的配置地址,即可查看所监控到的报警信息
http://localdns:9093/#/alerts
如图所示:
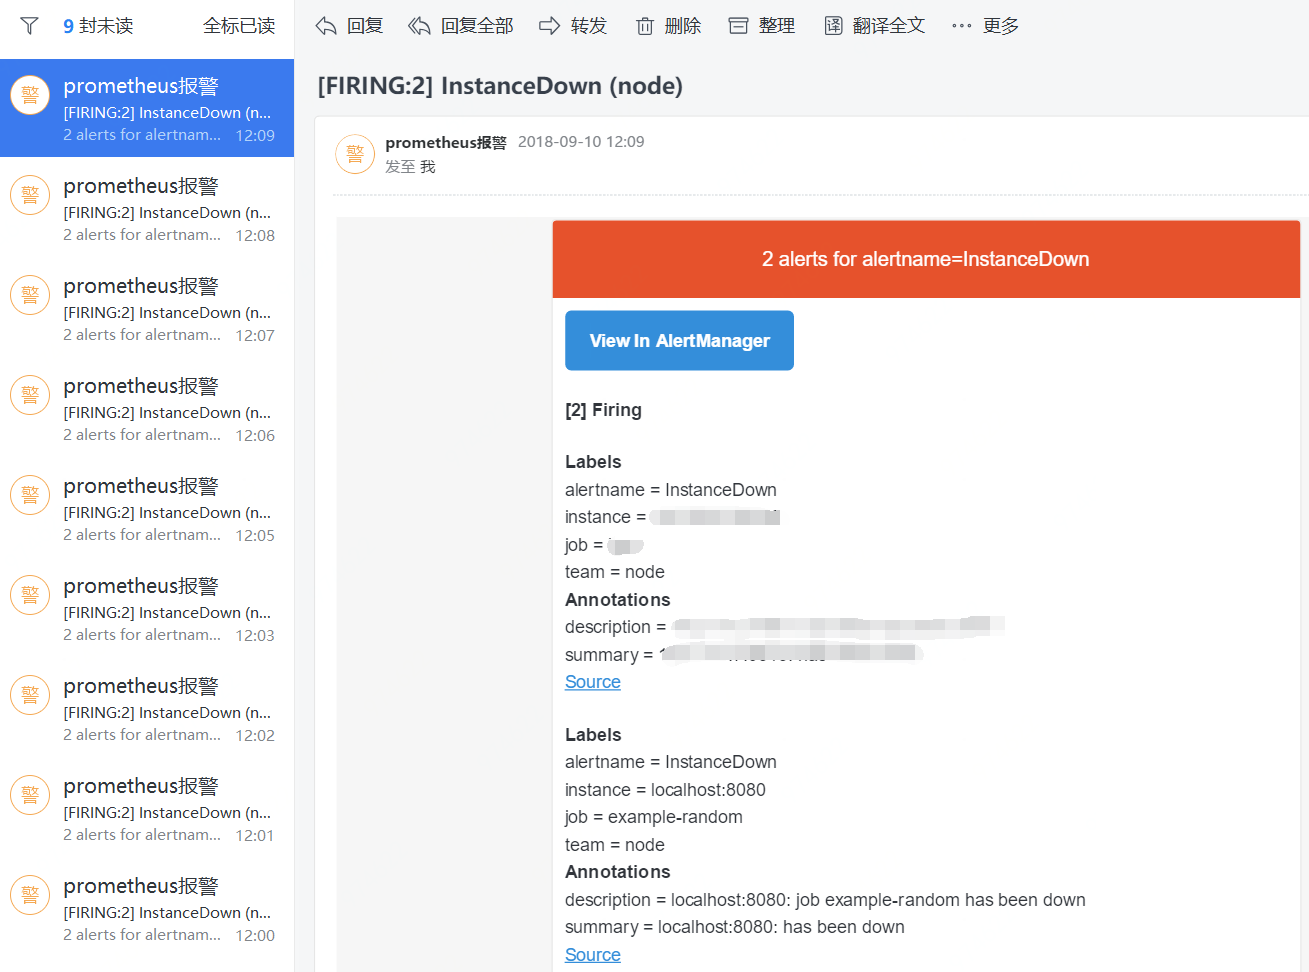
2、邮箱告警展示
1)原始邮箱告警展示
2)模板邮箱告警展示
3、企业微信告警展示
参考链接:
https://www.kancloud.cn/cdh0805010118/prometheus/719379
https://songjiayang.gitbooks.io/prometheus/content/alertmanager/what.html
https://www.kancloud.cn/cdh0805010118/prometheus/719380
https://blog.csdn.net/qq_21398167/article/details/76008594?locationNum=10&fps=1
https://blog.qikqiak.com/post/alertmanager-of-prometheus-in-practice/
Prometheus 和 Alertmanager实战配置的更多相关文章
- prometheus,alertmanager 报警配置详解
vim prometheus.yml global: scrape_interval: 15s external_labels: monitor: 'codelab-monitor' scrape_c ...
- Prometheus+alertmanager告警配置-2
prometheus 告警 prometheus 通过alertmanager进行告警 实现监控告警的步骤: 在prometheus中定义告警规则rule_files alertmanager配置告警 ...
- linux(centos8):prometheus使用alertmanager发送报警邮件(prometheus 2.18.1/alertmanager 0.20.0)
一,alertmanager的用途 1,Alertmanager的作用: Alertmanager是一个独立的报警模块, 它接收Prometheus等客户端发来的警报,并通过分组.删除重复等处理, 通 ...
- Alertmanager 部署配置
目录 前言 源码安装 配置 启动 配置prometheus监控Alertmanager 修改prometheus配置 重新加载配置文件 配置测试告警 修改prometheus配置 重新加载配置文件 测 ...
- Prometheus 与 Alertmanager 通信
Prometheus 与 Alertmanager 通信 1.编辑Prometheus配置文件配置连接地址:vim prometheus.yml # Alertmanager configuratio ...
- Prometheus 安装Alertmanager集成
Prometheus 安装Alertmanager集成 # 下载地址 地址1:https://prometheus.io/download/ 地址2:https://github.com/promet ...
- 基于Prometheus+Grafana+AlertManager的监控系统
一.Prometheus 1.1 简介 Prometheus是一套开源的监控&报警&时间序列数据库的组合,基于应用的metrics来进行监控的开源工具 . 1.2 下载&安装 ...
- 01 . Prometheus简介及安装配置Grafana
Promethus简介 Prometheus受启发于Google的Brogmon监控系统(相似的Kubernetes是从Google的Brog系统演变而来),从2012年开始由前Google工程师在S ...
- Prometheus+Grafana+Alertmanager实现告警推送教程 ----- 图文详解
前言 本文主要介绍的是Prometheus采集数据,通过Grafana加上PromQL语句实现数据可视化以及通过Alertmanage实现告警推送功能.温馨提示,本篇文章特长,2w多的文字加上几十张图 ...
随机推荐
- HDU 6043 - KazaQ's Socks | 2017 Multi-University Training Contest 1
/* HDU 6043 - KazaQ's Socks [ 找规律 ] | 2017 Multi-University Training Contest 1 题意: 一共 n 双袜子编号 1~n,每天 ...
- 【Python之路】特别篇--五句话搞定JavaScript作用域
JavaScript的作用域一直以来是前端开发中比较难以理解的知识点,对于JavaScript的作用域主要记住几句话,走遍天下都不怕... 一.“JavaScript中无块级作用域” 在Java或C# ...
- 小程序开发之后台mybatis逆向工程(二)
上一节搭建好了SSM后台框架,这一节将根据表结构创建实体及映射文件以及mapper接口.如果表过多,会很麻烦,所以mybatis提供了逆向工程来解决这个问题. 上一节 SSM搭建后台管理系统 逆向工程 ...
- interp2
%关于interp2的自我理解 %利用已知的信息,对数据进行拟合 %用一个例子进行理解 例:设有数据x=1,2,3,4,5,6,y=1,2,3,4,在由x,y构成的网格上,数据为:12,10,11,1 ...
- eclipse打开项目中文件时左侧project explorer同时展开该文件的路径
如图,点击Package Explorer面板上的双向箭头图标即可
- vue 2.x 的 v-bind 指令的 .prop 事件修饰符详解
vue 官方文档对 .prop 修饰符的解释是: 使用例子: 那么,具体的原理和用法是什么呢?这要从 html 的 DOM node 说起. 在 html 标签里,我们可以定义各种 attribute ...
- C++入门经典-例7.5-对象的指针,函数指针调用类成员
1:指向相应对象的指针就是对象的指针,它的生明方法与其他类型一样,如下: 类名 *p; 类的指针可以调用它所指向对象的成员.形式如下: p->类成员; 2:代码如下: (1)cat.h #inc ...
- kali安装与配置
闲来没事,把kali虚拟机重新装到了电脑上,记录下步骤 1.在kali官网(https://www.kali.org/downloads/)直接下载的.ova虚拟机,因为之前从官网下载的iso文件不知 ...
- 邻居子系统 之 邻居项创建__neigh_create
概述 IP层输出数据包会根据路由的下一跳查询邻居项,如果不存在则会调用__neigh_create创建邻居项,然后调用邻居项的output函数进行输出: __neigh_create完成邻居项的创建, ...
- react 的定义组件(了解)
react 中定义组件的方法 1. 定义组件 React.createClass() (被淘汰了) 定义组件中的函数 methods 的中的 this 统统指向 组件 2. 函数定义组件 定义的组件时 ...