python中matplotlib总结
该总结只是为了记录自己学习过程中容易遗忘的问题,权当一个记事本使用。
1:散点图
plt.scatter()函数的原型
scatter(x, y, s=s, c=c, marker=marker, cmap=cmap, norm=norm,vmin=vmin, vmax=vmax, alpha=alpha,
              linewidths=linewidths, verts=verts,edgecolors=edgecolors, data=data, **kwargs)
各个参数的含义:
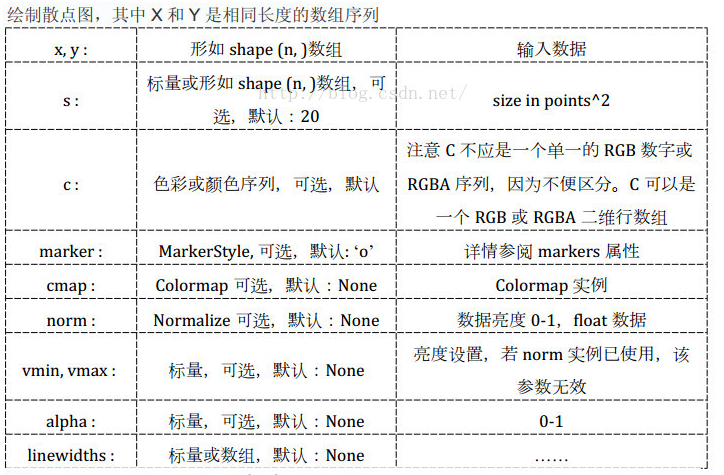
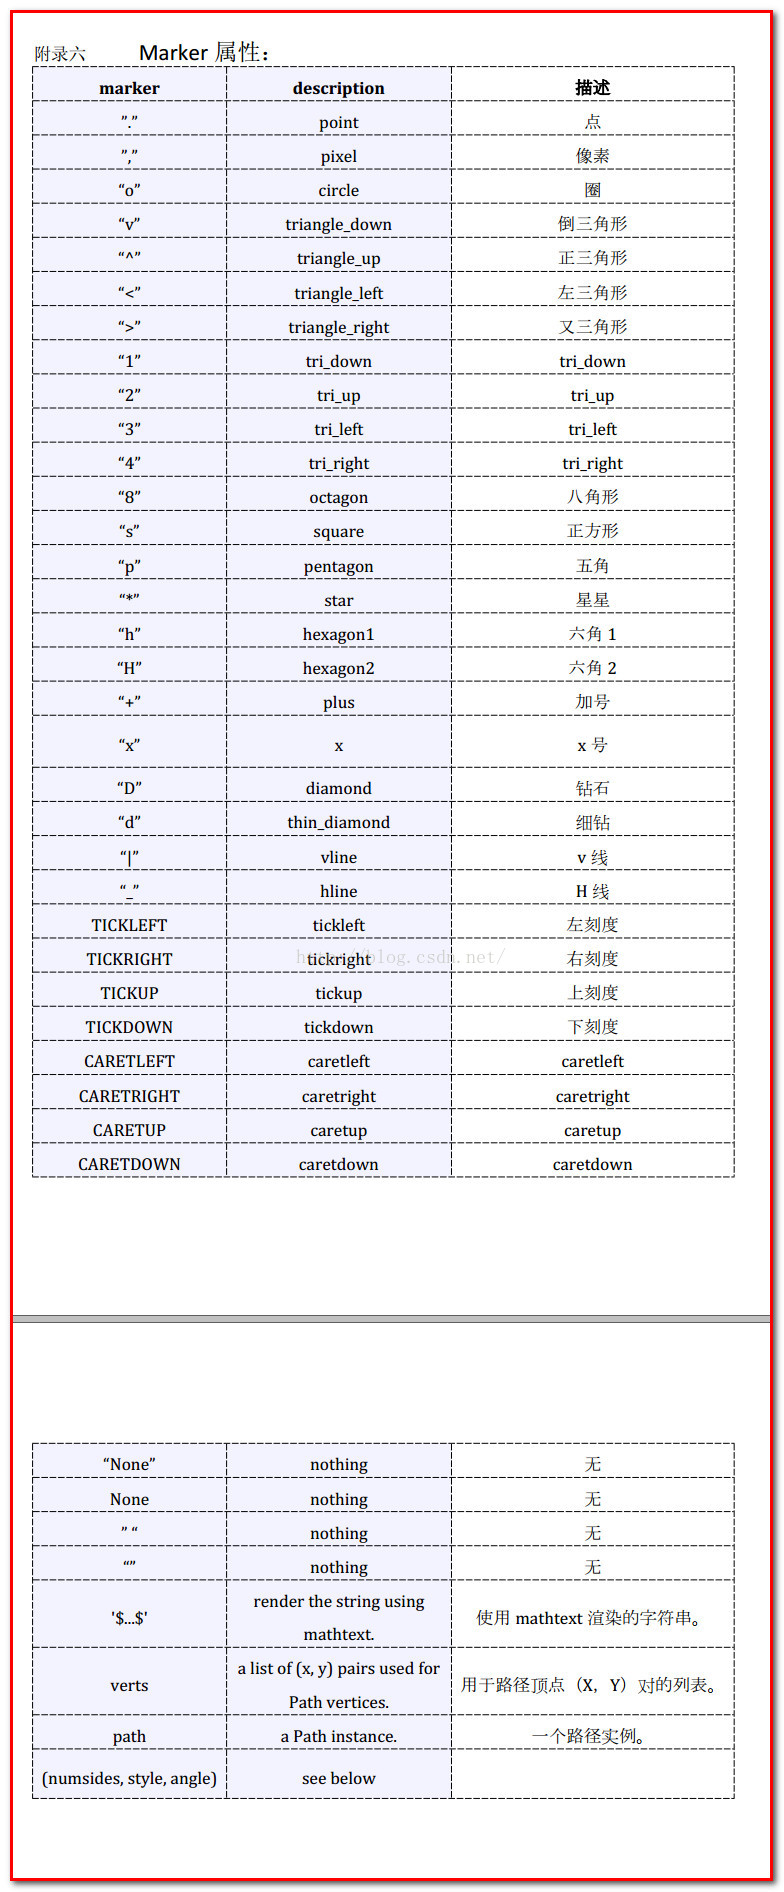
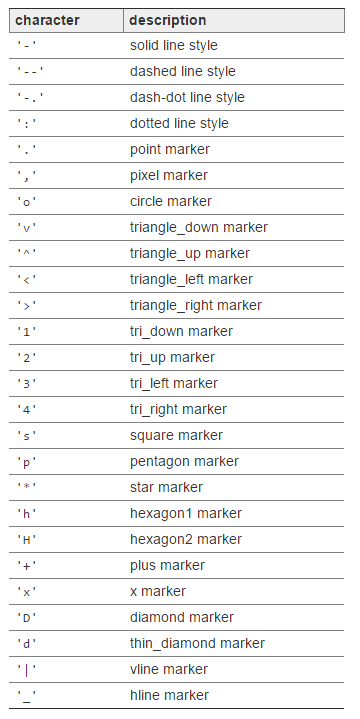
其中marker的含义
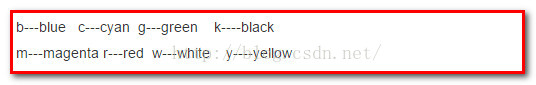
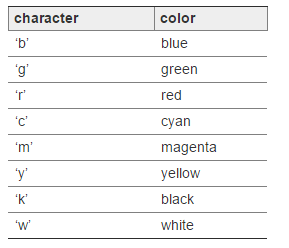
其中C的含义如下
下面进行简单的实例化演示:
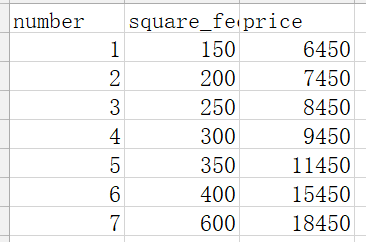
下面的例子是:房价的预测:
数据源:
 #利用模拟的模型进行画图

 def show_linear_line(X_parameters,Y_parameters):

     reg = linear_model.LinearRegression()

     reg.fit(X_parameters,Y_parameters)

     plt.scatter(X_parameters,Y_parameters,c = 'blue',,marker = 'o')

     plt.plot(X_parameters,reg.predict(X_parameters),color = 'red',linewidth = 2 ,label = 'feet_price')      #其中label表示线条的含义

 #    设置图像的标题

     plt.title('house_price')

     #为图像设置网格

     plt.grid()

     #设置横纵坐标的范围

     plt.xlim((150,700))

     plt.ylim(5000,20000)

     #设置坐标轴的刻度

     plt.xticks(np.linspace(150,700,5))

     plt.yticks(np.linspace(5000,20000,5))

     #设置横纵坐标轴标签

     plt.xlabel('square_feet')

     plt.ylabel('price')

     plt.legend()

     plt.show()
房价的预测结果:

plot()函数
用于绘制模拟的线
如上面代码中所示,plot()函数可以添加多个参数
其中形状的种类如下图:https://matplotlib.org/api/_as_gen/matplotlib.pyplot.plot.html
线条的颜色如下:
 plot([1,2,3], [1,2,3], 'go-', label='line 1', linewidth=2)

 plot([1,2,3], [1,4,9], 'rs',  label='line 2')

 axis([0, 4, 0, 10])

 legend()
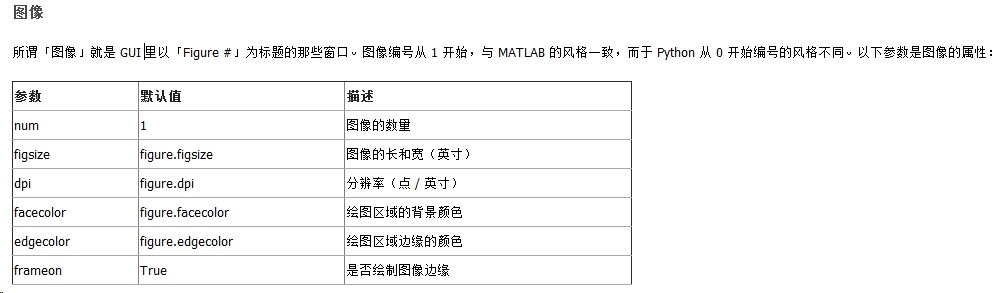
savefig()函数
保存图片 https://matplotlib.org/api/pyplot_api.html 从api中查找各个参数的含义
savefig(fname, dpi=None, facecolor='w', edgecolor='w',

        orientation='portrait', papertype=None, format=None,

        transparent=False, bbox_inches=None, pad_inches=0.1,

        frameon=None)
如下图:如果加上标红线的代码,则会将图片输出到该路径中
 #利用模拟的模型进行画图

 def show_linear_line(X_parameters,Y_parameters):

     reg = linear_model.LinearRegression()

     reg.fit(X_parameters,Y_parameters)

     plt.scatter(X_parameters,Y_parameters,c = 'blue',marker = '^')

     plt.plot(X_parameters,reg.predict(X_parameters),color = 'red',linewidth = 2 ,label = 'feet_price')

 #    设置图像的标题

     plt.title('house_price')

     #为图像设置网格

     plt.grid()

     #设置横纵坐标的范围

     plt.xlim((150,700))

     plt.ylim(5000,20000)

     #设置坐标轴的刻度

     plt.xticks(np.linspace(150,700,5))

     plt.yticks(np.linspace(5000,20000,5))

     #设置横纵坐标轴标签

     plt.xlabel('square_feet')

     plt.ylabel('price')

     #输出图片到改路径下面

     plt.savefig('G:\\python\\20180108demo\\01Lineargression\\resultPic\\housePredicted.png')

     plt.legend()

     plt.show()
python中matplotlib总结的更多相关文章
- python 中matplotlib 绘图
python 中matplotlib 绘图 数学建模需要,对于绘图进行简单学习 matpoltlib之类的包安装建议之间用anaconda 绘制一条y=x^2的曲线 #比如我们要绘制一条y=x^2的曲 ...
- python中matplotlib画折线图实例(坐标轴数字、字符串混搭及标题中文显示)
最近在用python中的matplotlib画折线图,遇到了坐标轴 "数字+刻度" 混合显示.标题中文显示.批量处理等诸多问题.通过学习解决了,来记录下.如有错误或不足之处,望请指 ...
- Python中matplotlib模块解析
用Matplotlib绘制二维图像的最简单方法是: 1. 导入模块 导入matplotlib的子模块 import matplotlib.pyplot as plt import numpy as ...
- python中matplotlib的颜色及线条控制
参考网址: http://www.cnblogs.com/darkknightzh/p/6117528.html http://stackoverflow.com/questions/22408237 ...
- (原)python中matplotlib的颜色及线条控制
转载请注明出处: http://www.cnblogs.com/darkknightzh/p/6117528.html 参考网址: http://stackoverflow.com/questions ...
- python中matplotlib 的简单使用
1.简单折线图的画图,轴标签.图的颜色,风格,等等参数,本文只介绍最常用的几个参数: import matplotlib.pyplot as plt import numpy as np x = np ...
- python中matplotlib绘图封装类之折线图、条状图、圆饼图
DrawHelper.py封装类源码: import matplotlib import matplotlib.pyplot as plt import numpy as np class DrawH ...
- Python中matplotlib.pyplot.imshow画灰度图的多种方法
转载:https://www.jianshu.com/p/8f96318a153f matplotlib库的教程和使用方法此处就不累赘了,网上有十分多优秀的教程资源.此处直接上代码: def demo ...
- python中matplotlib所绘制的图包含了很多的对象
上图中的top=‘off’意思是说顶部的grid lines 看不见. 去除frame,意思就是将这个矩形给去除掉,spine意思是脊柱 bars = plt.bar(pos, popularity, ...
随机推荐
- MyEclipse去除网上复制下来的代码带有的行号(使用正则表达式)
一.正则表达式去除代码行号 作为开发人员,我们经常从网上复制一些代码,有些时候复制的代码前面是带有行号,如: MyEclipse本身自带有查找替换功能,并且支持正则表达式替换,使用正则替换就可以很容易 ...
- gulp & webpack整合
为什么需要前端工程化? 前端工程化的意义在于让前端这个行业由野蛮时代进化为正规军时代,近年来很多相关的工具和概念诞生.好奇心日报在进行前端工程化的过程中,主要的挑战在于解决如下问题:✦ 如何管理多个项 ...
- 最简单,有效的学习mysql教程(一)
数据库 1 定义 数据库,可以简单的解释为:高效的存储和处理数据的介质(主要分为磁盘和内存两种). 2 分类 根据数据库存储介质的不同,可以将其分为两类,即:关系型数据库(SQL)和非关系型数据库(N ...
- css中元素的auto属性值是什么意思,比如margin:0 auto表示什么?
auto 你可以理解为一种 自动/自适应 的概念 比如 现在项目需要一个宽度为960px的整体布局居中 根据用户浏览器大小不同你将需要使用margin:0 auto;来实现. 无论用户浏览器宽度为多少 ...
- ArcGIS最权威、最专业的技术分享网站:积思园(www.iarcgis.com)
你对iArcGIS.com说点什么 为什么会有该网站的产生 在这个所谓的“大数据”的时代,每个人都深陷于海量信息无法自拔,因为过多碎片化的数据只会让自己的思维更加迷离,快餐式的阅读只会让自己变得虚胖. ...
- 平均负载(Load average)
load average 的含义平均负载(load average)是指系统的运行队列的平均利用率,也可以认为是可运行进程的平均数. top命令中load average显示的是最近1分钟.5分钟和1 ...
- 关于VSTS自动Build报错问题之Microsoft.Net.Compilers
报错内容如下: --06T11::.6035712Z ##[error]Dotnet command failed with non-zero exit code on the following p ...
- Linux入门-4 Linux下获取帮助
help MAN INFO doc help <command> -h或<command> --help whatis <cmd> MAN man <comm ...
- Linux中脚本的使用方法
Linux中脚本的使用方法 一.前言 关于Linux中的脚本的用法,一直没有时间去好好地总结,正好今天下雨,就好好的整理一下思路吧,其实精通了一门语言,比如C语言,学习其他语言需要的成本是非常少的,同 ...
- python3.6+GDAL-2.1.3环境配置
1.下载地址:http://www.lfd.uci.edu/~gohlke/pythonlibs/#gdal 2.配置:见上图命令(跟以前相似) 3.测试: