Linux BPF/bcc for Oracle Tracing
Luca Canali on 26 May 2016
Topic: In this post you will find a short discussion and pointers to the code of a few sample scripts that I have written using Linux BPF/bcc and uprobes for Oracle tracing.
Previous work and motivations
Tools for dynamic tracing are very useful for troubleshooting and internals investigations of Oracle workloads. Dynamic tracing probes on the OS/kernel, can be used to measure the details for I/O latency for example. Moreover probes on the Oracle userspace functions can be be used to complement Oracle instrumentation and probe deeper into the internals of the Oracle engine, when needed. For example in a work done in collaboration with Frits Hoogland(link is external) we have investigated how to link Oracle wait event interface with tools able to probe the userspace, such as gdb and dynamic tracing tools as DTrace, SystemTap and Perf. More details and examples on this topic can be found in previous work: Modern Linux Tools for Oracle Troubleshooting (presentation at UKOUG Tech14), Life of an Oracle I/O: Tracing Logical and Physical I/O with SystemTap(link is external), Linux Perf Probes for Oracle Tracing(link is external), Flame Graphs for Oracle(link is external).
What's new with BPF/bcc
BPF together with his frontend bcc(link is external) are new and exciting technologies in the Linux dynamic tracing ecosystem. If you are not familiar with them, you can get up to speed using the excellent material in Brendan Gregg's blog(link is external). While the tools are still in development as I write this, a large amount of important features are already available starting from kernel 4.5, notably the support for uprobes that I have used in the scripts discussed later in this post.
I have started experimenting with porting a few probes for the Oracle userspace that I had written using SystemTap and discussed in this blog. While the language/syntax is completely different between SystemTap and BPF/bcc, porting the probes has turned out to be relatively straightforward. The work has been made substantially easier by the availability of a large selection of well-written and documented scripts in the tools directory of bcc(link is external). At present writing BPF/bcc scripts is a mixture of coding in Python and C, which feels to me both familiar and at the same time strangely low-level compared to the more mature environments for example of DTrace and SystemTap.
The example scripts that I have written using BPF/bcc are on Github(link is external). Here is a list with comments:
|
Script name |
Short description |
|---|---|
|
Tracing of Oracle SQL parsing. This script traces SQL hard parsing on Oracle binaries hooking on the Oracle function "opiprs" and reads from function arguments (CPU registers) and from process memory. |
|
|
Tracing of Oracle wait events. This script traces Oracle sessions by hooking on the functions "kskthewt" and "kews_update_wait_time" and reads from function arguments (CPU registers). |
|
|
Logical IO latency histograms. This script measures the latency between call and return time for the Oracle function "kcbgtcr", which is an important part of the logical IO processing for consistent reads. |
|
|
Wait event latency histograms. This script traces Oracle sessions by hooking on the functions "kskthewt" and "kews_update_wait_time" and reads from function arguments (CPU registers). BPF computes the latency histogram for the wait events and the script prints the values on stdout. |
An example of the usage of ora_wait_histogram.py to measure and display wait event latency:
# stdbuf -oL ./ora_wait_histogram.py 10 10|sed -e 's/event# = /event#=/g' -f eventsname.sed
Start tracing oracle wait events... Hit Ctrl-C to end.
event=db file sequential read
wait time, microsec : count distribution
0 -> 1 : 0 | |
2 -> 3 : 0 | |
4 -> 7 : 0 | |
8 -> 15 : 0 | |
16 -> 31 : 0 | |
32 -> 63 : 0 | |
64 -> 127 : 25 | |
128 -> 255 : 24521 |******************** |
256 -> 511 : 46788 |****************************************|
512 -> 1023 : 12169 |********** |
1024 -> 2047 : 1132 | |
2048 -> 4095 : 660 | |
4096 -> 8191 : 248 | |
8192 -> 16383 : 29 | |
Latency heat maps to display histograms collected with BPF/bcc
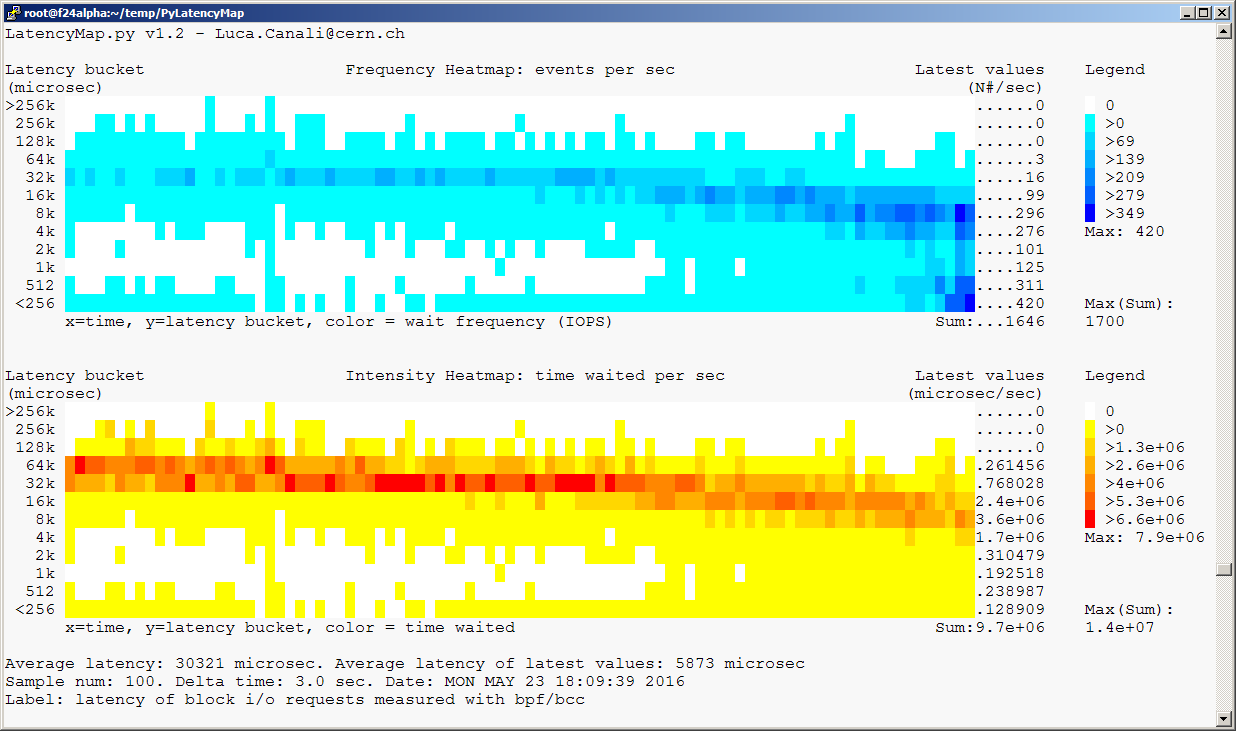
PyLatencyMap (link is external)is a command-line tool for visualizing latency histograms using heat maps on terminal graphics, using ANSI escape codes. PyLatencyMap can be used to investigate I/O performance for random I/O, especially suited for the cases of multiple modes of response time from the storage (SSD cache, HDD, latency outliers). The original idea for PyLatencyMap comes from the work of Brendan Gregg(link is external) on latency heat maps. I have added to the PyLatencyMap repository(link is external) a modified version of the biolatency.py(link is external) script to measure I/O latency histograms: this is the link to the script pylatencymap_biolatency.py(link is external) and an example of heat maps generated with PyLatencyMap with the script Example11_BPF-bcc_blockIO_latency.sh(link is external):
The test workload has been generated using Kevin Closson's SLOB(link is external). Additional references with a more detailed discussion of the topic of testing Oracle I/O with SLOB and measuring latency heat maps are:
Heat Map Visualization of I/O Latency with SystemTap and PyLatencyMap(link is external) and OraLatencyMap v1.1 and Testing I/O with SLOB 2(link is external).
Notes on the test environment
The scripts discussed in this post have been developed on Fedora 24 (alpha) running Linux kernel version 4.6 (using the rawhide kernel) and have been tested on workloads generated using Oracle version 11.2.0.4. This is not an Oracle-supported configuration and the scripts are intended mainly as a demonstration of the technology and for learning purposes.
Here are some pointers on the steps I used to setup a lab environment for testing:
- Download Fedora server from https://getfedora.org/en/server/(link is external) (version 24 beta, as I write this).
- Installed Fedora, for example on a VM with VirtualBox(link is external)
- Run "sudo dnf update" to get the latest kernel and packages
- Get kernel-devel with "sudo dnf install kernel-devel"
- Follow the installation instructions for bcc on Fedora from https://github.com/iovisor/bcc/blob/master/INSTALL.md(link is external)
Conclusions
BPF with its bcc frontend are new and powerful tools for dynamic tracing for Linux. A discussion of the merits and shortfalls of BPF/bcc vs other existing solutions in the Linux dynamic tracing ecosystem is beyond the scope of this post. What you can find in this post are a few example scripts that I have written for tracing Oracle using BPF/bcc anduprobes and an additional script for integrating BPF/bcc with PyLatencyMap, which provides visualization as heat maps of the histograms generated using BPF/bcc.
Although the BPF/bcc environment is currently under evolution, it appears already a very useful addition to the toolbox for troubleshooting and performance investigations of Linux workloads. A set of example scripts/tools that come with the bcc repository are of great help for getting started both with using BPF/bcc and with writing new scripts. BPF/bcc can only run on relatively new kernels (as I write this, I have tested the scripts discussed in this post on kernel version 4.6) and this is an obstacle for its adoption in many environments, at least in the short term.
Credits and acknowledgements
Many of the original ideas and tools discussed here are inspired or directly derived from the awesome published work of Brendan Gregg(link is external).
Many thanks also to the development teams of BPF and bcc(link is external) for providing and supporting this new powerful tools. In particular thanks to Brenden Blanco(link is external) for his work on uprobes for bcc and for his support on issue #478(link is external).
The work of investigating Oracle userspace with dynamic tracing tools has been done in collaboration with Frits Hoogland(link is external).
Linux BPF/bcc for Oracle Tracing的更多相关文章
- Linux Perf Probes for Oracle Tracing
Luca Canali on 21 Jan 2016 Topic: this post is about Linux perf and uprobes for tracing and profilin ...
- 在Ubuntu和Linux Mint上安装Oracle JDK
在Ubuntu和Linux Mint上安装Oracle JDK 使用下面的命令安装,只需一些时间,它就会下载许多的文件,所及你要确保你的网络环境良好: sudo add-apt-repository ...
- Linux 6.5(oracle 11.2.0.4)单实例ASM安装
Linux 6.5(oracle 11.2.0.4) 1.解析主机.配置网络等 /etc/hosts /etc/sysconfig/network /etc/init.d/NetworkManager ...
- Linux/Unix shell 监控Oracle监听器(monitor listener)
使用shell脚本实现对Oracle数据库的监控与管理将大大简化DBA的工作负担,如常见的对实例的监控,监听的监控,告警日志的监控,以及数据库的备份,AWR report的自动邮件等.本文给出Linu ...
- Linux/Unix shell 监控Oracle告警日志(monitor alter log file)
使用shell脚本实现对Oracle数据库的监控与管理将大大简化DBA的工作负担,如常见的对实例的监控,监听的监控,告警日志的监控,以及数据库的备份,AWR report的自动邮件等.本文给出Linu ...
- Linux服务器下对Oracle作Rman备份
由于工作需要,最近要对几台Linux系统下的Oracle数据库进行Rman备份,就在操作的同时,整理了一下,方便今后作为资料进行查阅. ------------------------Linux服务器 ...
- 转://Linux大内存页Oracle数据库优化
PC Server发展到今天,在性能方面有着长足的进步.64位的CPU在数年前都已经进入到寻常的家用PC之中,更别说是更高端的PC Server:在Intel和AMD两大处理器巨头的努力下,x86 C ...
- Linux下的启动oracle的EM的命令
Linux下的启动oracle的EM的命令 1.启动数据库 su - oracle $sqlplus / as sysdba sql>startup 2.启动监听 $lsnrctl LSNRCT ...
- Linux服务器中创建Oracle数据库实例
紧接上篇,在Linux服务器已经完成对Oracle数据库软件的安装后,接下来要创建Oracle实例,看图说话: [su – oracle echo $DISPLAY export DISPLAY=10 ...
随机推荐
- POJ:1904-King's Quest
King's Quest Time limit15000 ms Case time limit2000 ms Memory limit65536 kB Description Once upon a ...
- python基础学习笔记——字符串方法
索引和切片: 索引:取出数组s中第3个元素:x=s[2] 切片:用极少的代码将数组元素按需处理的一种方法.切片最少有1个参数,最多有3个参数,演示如下: 我们假设下面所用的数组声明为array=[2, ...
- Windows清理打印池的方法
另存为bat运行 @echo off title 快速清除打印队列 echo. echo 停止打印机服务 net stop spooler>nul echo. del /q /f %wind ...
- 《Scrum实战》第0次课【如何学习敏捷】全团课后任务汇总
<Scrum实战>第0次课作业 完成情况: 课程名称:如何学习敏捷 1组 孟帅 孟帅: http://www.cnblogs.com/mengshuai1982/p/7096338.htm ...
- jquery源码区块
- Leetcode 483.最小好进制
最小好进制 对于给定的整数 n, 如果n的k(k>=2)进制数的所有数位全为1,则称 k(k>=2)是 n 的一个好进制. 以字符串的形式给出 n, 以字符串的形式返回 n 的最小好进制. ...
- Java判断浏览器是微信还是支付宝
private static final String WX_AGENT = "micromessenger"; private static final String ALI_A ...
- C#技术点
程序员的基本内功.操作系统,数据结构,网络协议,架构 mysql存储引擎,索引? 分布式技术一致性? 缓存系统/中间件技术/NoSql? 锁与线程切换? 排序,链表,hash_map?
- Unity3D - UGUI的初级应用
添加字体: 把下载好的字体拖拽到Project面板中 - 点击Text组件中Text属性后面的圆点 - 选择刚刚拖拽的字体即可. 创建ToggleGroup(开关组): 1.在Canvas下创建两个T ...
- 【bzoj3307】雨天的尾巴 权值线段树合并
题目描述 N个点,形成一个树状结构.有M次发放,每次选择两个点x,y,对于x到y的路径上(含x,y)每个点发一袋Z类型的物品.完成所有发放后,每个点存放最多的是哪种物品. 输入 第一行数字N,M接下来 ...