NetworkX系列教程(8)-Drawing Graph
如果只是简单使用nx.draw,是无法定制出自己需要的graph,并且这样的graph内的点坐标的不定的,运行一次变一次,实际中一般是要求固定的位置,这就需要到布局的概念了.详细的画图信息可以看这里,代码中的关键部分使用了英文进行注释,不在另外注释.
目录:
注意:如果代码出现找不库,请返回第一个教程,把库文件导入.
9.Drawing Graph
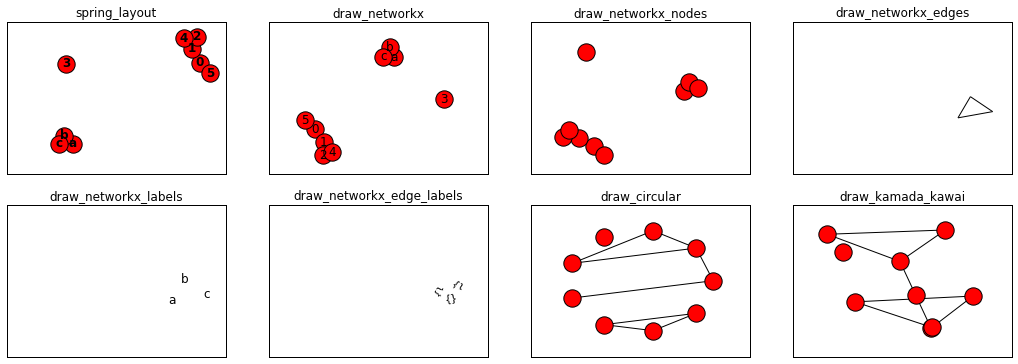
9.1使用Matplotlib
- #定义graph
- nodes=[0,1,2,3,4,5,'a','b','c']
- edges=[(0,1),(0,5),(1,2),(1,4),(2,1),(2,4),('a','b'),('b','c'),('c','a')]
- G=nx.Graph()
- G.add_nodes_from(nodes)
- G.add_edges_from(edges)
- #使用spring_layout布局
- pos=nx.spring_layout(G)
- plt.subplots(2,4,figsize=(18,6))
- plt.subplot(241)
- plt.title('spring_layout')
- nx.draw(G, with_labels=True, font_weight='bold') #Draw the graph G with Matplotlib.
- plt.axis('on')
- plt.xticks([])
- plt.yticks([])
- plt.subplot(242)
- plt.title('draw_networkx')
- nx.draw_networkx(G) #Draw the graph G using Matplotlib.
- plt.axis('on')
- plt.xticks([])
- plt.yticks([])
- plt.subplot(243)
- plt.title('draw_networkx_nodes')
- nx.draw_networkx_nodes(G,pos) #Draw the nodes of the graph G.
- plt.axis('on')
- plt.xticks([])
- plt.yticks([])
- plt.subplot(244)
- plt.title('draw_networkx_edges')
- nx.draw_networkx_edges(G,pos) #Draw the edges of the graph G.
- plt.axis('on')
- plt.xticks([])
- plt.yticks([])
- plt.subplot(245)
- plt.title('draw_networkx_labels')
- nx.draw_networkx_labels(G,pos) #Draw node labels on the graph G.
- plt.axis('on')
- plt.xticks([])
- plt.yticks([])
- plt.subplot(246)
- plt.title('draw_networkx_edge_labels')
- nx.draw_networkx_edge_labels(G,pos) #Draw edge labels.
- plt.axis('on')
- plt.xticks([])
- plt.yticks([])
- plt.subplot(247)
- plt.title('draw_circular')
- nx.draw_circular(G,) #Draw the graph G with a circular layout.
- plt.axis('on')
- plt.xticks([])
- plt.yticks([])
- plt.subplot(248)
- plt.title('draw_kamada_kawai')
- nx.draw_kamada_kawai(G) #Draw the graph G with a Kamada-Kawai force-directed layout.
- plt.axis('on')
- plt.xticks([])
- plt.yticks([])
- plt.show()
- plt.close()
- plt.subplots(1,4,figsize=(18,3))
- plt.subplot(141)
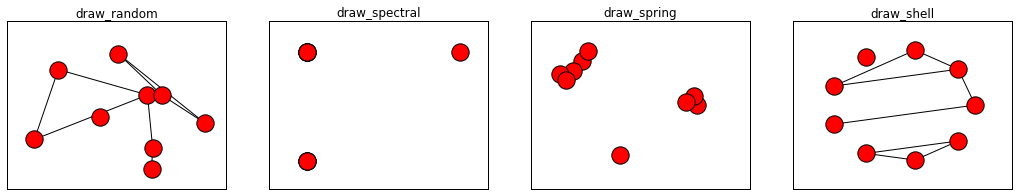
- plt.title('draw_random')
- nx.draw_random(G) #Draw the graph G with a random layout.
- plt.axis('on')
- plt.xticks([])
- plt.yticks([])
- plt.subplot(142)
- plt.title('draw_spectral')
- nx.draw_spectral(G,) #Draw the graph G with a spectral layout.
- plt.axis('on')
- plt.xticks([])
- plt.yticks([])
- plt.subplot(143)
- plt.title('draw_spring')
- nx.draw_spring(G) #Draw the graph G with a spring layout.
- plt.axis('on')
- plt.xticks([])
- plt.yticks([])
- plt.subplot(144)
- plt.title('draw_shell')
- nx.draw_shell(G) #Draw networkx graph with shell layout.
- plt.axis('on')
- plt.xticks([])
- plt.yticks([])
- plt.show()
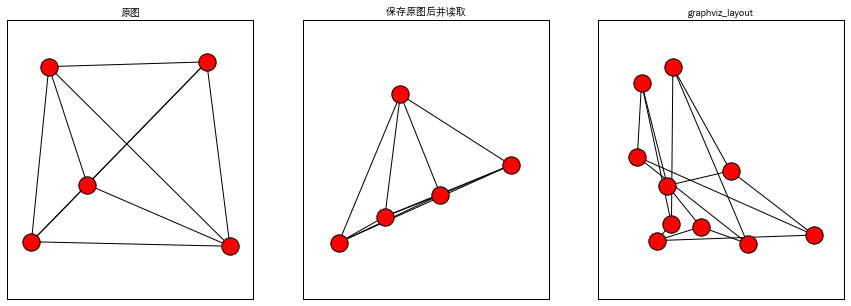
9.2使用Graphviz AGraph (dot)
有些同学不知道如何安装Graphviz,我在这里作一个说明:
1.linux是安装graphviz即可,我使用的命令是:
- sudo apt install graphviz
2.Windows我没用实践过,不过我查到Graphviz有官网,里面有windows安装包,地址看下:
http://www.graphviz.org/download/
- G.clear()
- from networkx.drawing.nx_pydot import write_dot,read_dot
- plt.subplots(1,3,figsize=(15,5))
- K5 = nx.complete_graph(5)
- A = nx.nx_agraph.to_agraph(K5) #Return a pygraphviz graph from a NetworkX graph N.
- G1 = nx.nx_agraph.from_agraph(A) #Return a NetworkX Graph or DiGraph from a PyGraphviz graph.
- plt.subplot(131)
- plt.title('原图',fontproperties=myfont)
- nx.draw_random(G1) #Draw the graph G with a random layout.
- plt.axis('on')
- plt.xticks([])
- plt.yticks([])
- write_dot(G1, 'graph.test') #Write NetworkX graph G to Graphviz dot format on path.
- G2=read_dot('graph.test') #Return a NetworkX graph from a dot file on path.
- plt.subplot(132)
- plt.title('保存原图后并读取',fontproperties=myfont)
- nx.draw_random(G2) #Draw the graph G with a random layout.
- plt.axis('on')
- plt.xticks([])
- plt.yticks([])
- G3 = nx.petersen_graph()
- pos = nx.nx_agraph.graphviz_layout(G3) #Create node positions for G using Graphviz.
- plt.subplot(133)
- plt.title('graphviz_layout',fontproperties=myfont)
- nx.draw_random(G3) #Draw the graph G with a random layout.
- plt.axis('on')
- plt.xticks([])
- plt.yticks([])
- plt.show()
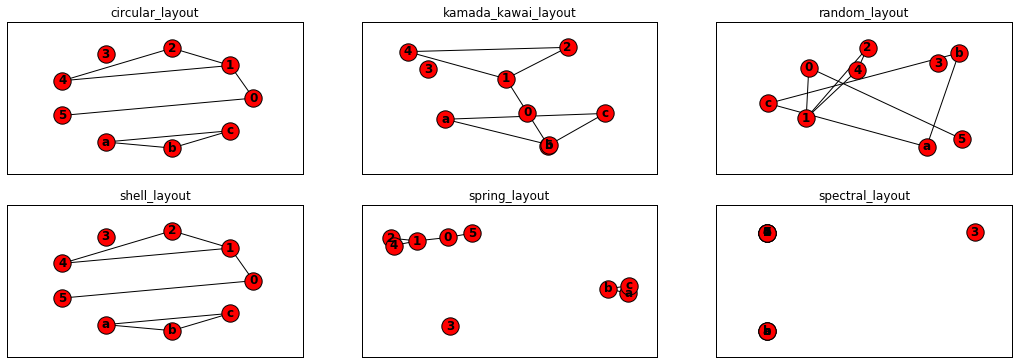
9.3图布局
- #定义graph
- nodes=[0,1,2,3,4,5,'a','b','c']
- edges=[(0,1),(0,5),(1,2),(1,4),(2,1),(2,4),('a','b'),('b','c'),('c','a')]
- G=nx.Graph()
- G.add_nodes_from(nodes)
- G.add_edges_from(edges)
- plt.subplots(2,3,figsize=(18,6))
- plt.subplot(231)
- plt.title('circular_layout')
- pos=nx.circular_layout(G) #Position nodes on a circle.
- nx.draw(G,pos, with_labels=True, font_weight='bold')
- plt.axis('on')
- plt.xticks([])
- plt.yticks([])
- plt.subplot(232)
- plt.title('kamada_kawai_layout')
- pos=nx.kamada_kawai_layout(G) #Position nodes using Kamada-Kawai path-length cost-function.
- nx.draw(G, pos,with_labels=True, font_weight='bold')
- plt.axis('on')
- plt.xticks([])
- plt.yticks([])
- plt.subplot(233)
- plt.title('random_layout')
- pos=nx.random_layout(G) #Position nodes uniformly at random in the unit square.
- nx.draw(G, pos,with_labels=True, font_weight='bold')
- plt.axis('on')
- plt.xticks([])
- plt.yticks([])
- plt.subplot(234)
- plt.title('shell_layout')
- pos=nx.shell_layout(G) #Position nodes in concentric circles.
- nx.draw(G, pos,with_labels=True, font_weight='bold')
- plt.axis('on')
- plt.xticks([])
- plt.yticks([])
- plt.subplot(235)
- plt.title('spring_layout')
- pos=nx.spring_layout(G)#Position nodes using Fruchterman-Reingold force-directed algorithm.
- nx.draw(G, pos, with_labels=True, font_weight='bold')
- plt.axis('on')
- plt.xticks([])
- plt.yticks([])
- plt.subplot(236)
- plt.title('spectral_layout')
- pos=nx.spectral_layout(G) #Position nodes using the eigenvectors of the graph Laplacian.
- nx.draw(G, pos, with_labels=True, font_weight='bold')
- plt.axis('on')
- plt.xticks([])
- plt.yticks([])
- plt.show()
NetworkX系列教程(8)-Drawing Graph的更多相关文章
- NetworkX系列教程(1)-创建graph
小书匠Graph图论 研究中经常涉及到图论的相关知识,而且常常面对某些术语时,根本不知道在说什么.前不久接触了NetworkX这个graph处理工具,发现这个工具已经解决绝大部分的图论问题(也许只是我 ...
- NetworkX系列教程(7)-对graph进行分析
小书匠Graph图论 graph构建完成后,对graph的连通等属性进行分析. 目录: 8.对图进行分析 8.1连通子图 8.2弱联通 8.3强连通 8.4子图 8.5条件过滤 注意:如果代码出现找不 ...
- NetworkX系列教程(6)-对graph进行操作
小书匠Graph图论 graph生成后,除了有查看操作,还有移除等操作,还有其他更多操作,具体可以看这里.下面将比较graph操作前后的不同. 目录: 7.对图进行操作 7.1移除某些节点和边 7.2 ...
- NetworkX系列教程(5)-查看graph的信息
小书匠Graph图论 有时候graph建好后,我们并不清除该graph内节点的,边的信息,这就需要调用函数去查看了. 目录: 6.查看Graph的信息 6.1查看graph内节点,边的 6.2查看gr ...
- NetworkX系列教程(4)-设置graph的信息
小书匠Graph图论 要画出美观的graph,需要对graph里面的节点,边,节点的布局都要进行设置,具体可以看官方文档:Adding attributes to graphs, nodes, and ...
- NetworkX系列教程(2)-graph生成器
小书匠Graph图论 本节主要讲解如何快速使用内置的方法生成graph,官方的文档在这里,里面包含了networkX的所有graph生成器,下面的内容只是我节选的内容,并将graph画出来而已. 声明 ...
- NetworkX系列教程(11)-graph和其他数据格式转换
小书匠 Graph 图论 学过线性代数的都了解矩阵,在矩阵上的文章可做的很多,什么特征矩阵,单位矩阵等.grpah存储可以使用矩阵,比如graph的邻接矩阵,权重矩阵等,这节主要是在等到graph后 ...
- NetworkX系列教程(3)-手动创建graph
小书匠Graph图论 不可否认,日常中我们使用最多的还是,使用自己的数据去手动创建自己的图形,而不是使用生成器,现从给graph添加点和边入手,讲解手动创建graph. 目录: 3.给graph添加节 ...
- NetworkX系列教程(10)-算法之五:广度优先与深度优先
小书匠Graph图论 重头戏部分来了,写到这里我感觉得仔细认真点了,可能在NetworkX中,实现某些算法就一句话的事,但是这个算法是做什么的,用在什么地方,原理是怎么样的,不清除,所以,我决定先把图 ...
随机推荐
- string类型的解释与方法
基本概念 string(严格来说应该是System.String) 类型是我们日常coding中用的最多的类型之一.那什么是String呢?^ ~ ^ String是一个不可变的连续16位的Unico ...
- entity-framework-core – 实体框架核心RC2表名称复数
参考地址:https://docs.microsoft.com/zh-cn/ef/core/modeling/relational/tables http://www.voidcn.com/artic ...
- CentOS 6.x 配置iptables
CentOS 6.x 配置iptables 来源 https://www.cnblogs.com/chillax1314/p/7976067.html iptables -P INPUT DROP-- ...
- springboot笔记04——读取配置文件+使用slf4j日志
前言 springboot常用的配置文件有yml和properties两种,当然有必要的时候也可以用xml.我个人更加喜欢用yml,所以我在这里使用yml作为例子.yml或properties配置文件 ...
- 【转载】Sqlserver使用Group By进行分组并计算每个组的数量
在SQL语句查询中,Group By语句时常用来进行分组操作,有时候在分组的同时还需要计算出每个组的数量多少.在Sqlserver数据库中可以使用Group By加Count聚合函数来实现此功能,即通 ...
- js垃圾回收及内存泄漏
js垃圾回收 js能够自动回收申请却未使用的内存,由于每次清除需要的性能较大,不是时时在刷新,而是每隔一段时间才进行一次. 回收的两种方式 标记清除(常用) 在内存中先标记变量,然后清除那些那些进入环 ...
- ftl 列表弄成js数组
例子:ftl 列表:bannerViewUrls var arrayBanner=[<#list bannerViewUrls as list>"${list}"< ...
- css常用代码大全
css常用代码大全,html+css代码 html+css可以很方便的进行网页的排版布局,还能减少很多不必要的代码. 一.文本设置1.font-size: 字号参数 2.font-style: 字体格 ...
- H5之拖拽
步骤: 1.为将要拖拽的元素设置允许拖拽,并赋予dragstart事件将其id转换成数据保存: 2.为容器添加dragover属性添加事件阻止浏览器默认事件,允许元素放置,并赋予drop事件进行元素的 ...
- Eclipse-错误集
1.The origin server did not find a current representation for the target resource or is not willing ...