使用mysqlslap对mysql进行压测,观察Azure虚拟机cpu使用率
一直想做这个测试,原因很简单,很多人一直比较怀疑Azure的虚拟机性能,说相同的配置凭啥比阿里的虚拟机贵那么多,其实,我自己以前也怀疑过,但是接触Azure的几个月,确实发现Azure的虚拟机性能真的很强悍,在这里笔者举个例子说明,有个客户(这里就不透露名字了)在本地数据中心cpu使用率一直在60%以上,因为我们上云都是先平移,如果不够用我们再auto sacle,但是客户却很不放心,非要高配的机器,在我们的百般劝说之下好不容易才答应先平移(客户表示很委屈,为什么我要高配的机器你不给,哈哈,开个玩笑),最后测试下来的结果发现cpu平时使用率在百分之二十多,周末最繁忙的时刻也没超过百分之五十,客户当场就说没想到Azure虚拟机性能这么优越,同时也很感谢我们没有坑他,在本次场景中,其实性能的瓶颈并不在vm,而是在于数据库,因为mysql是轻量级数据库不同于Oracle!!!
在本次测试环境中,我们在中国东部建立一台vm,考虑到数据库对虚拟机性能要求较高,这里我们以A6为例(要记得先建立高配的机型,然后再降为A6虚拟机!!!),并挂载1T的硬盘。
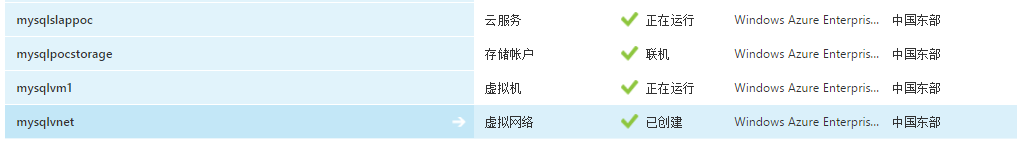
第一步建立虚拟机,过程略,结果如下
在这里,笔者想说一句,由于本次poc环境中,我们需要直观地看到cpu使用率,考虑到linux的ps命令的局限性,而且ARM里面很难看到cpu使用率,所以笔者选用ASM环境来建立虚拟机。
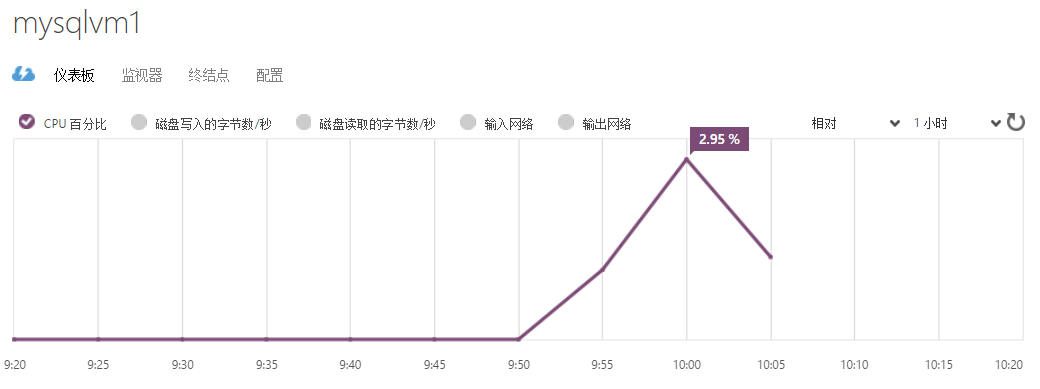
接下来我们先记录一下cpu与内存的使用情况
接下来第一步,添加附加磁盘
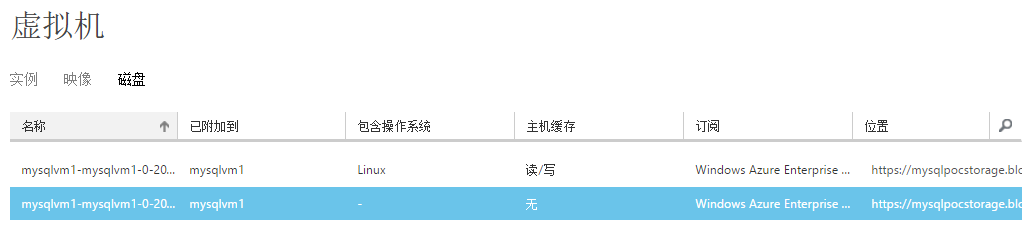
第二步,挂载附加磁盘
ssh远程登陆到该虚拟机
1.切换到root用户
[yangyang@mysqlvm1 ~]$ sudo su - root

[root@mysqlvm1 ~]#
切换成功
2.查看
[root@mysqlvm1 ~]# fdisk -cul /dev/sdc

Disk /dev/sdc: 1098.4 GB,  bytes

 heads,  sectors/track,  cylinders, total  sectors

Units = sectors of  *  =  bytes

Sector size (logical/physical):  bytes /  bytes

I/O size (minimum/optimal):  bytes /  bytes

Disk identifier: 0x00000000
3.分区
[root@mysqlvm1 ~]# fdisk -cu /dev/sdc

Device contains neither a valid DOS partition table, nor Sun, SGI or OSF disklabel

Building a new DOS disklabel with disk identifier 0x9694814d.

Changes will remain in memory only, until you decide to write them.

After that, of course, the previous content won't be recoverable.

Warning: invalid flag 0x0000 of partition table  will be corrected by w(rite)

Command (m for help): p

Disk /dev/sdc: 1098.4 GB,  bytes

 heads,  sectors/track,  cylinders, total  sectors

Units = sectors of  *  =  bytes

Sector size (logical/physical):  bytes /  bytes

I/O size (minimum/optimal):  bytes /  bytes

Disk identifier: 0x9694814d

   Device Boot      Start         End      Blocks   Id  System

Command (m for help): n

Command action

   e   extended

   p   primary partition (-)

p

Partition number (-):

First sector (-, default ):

Using default value

Last sector, +sectors or +size{K,M,G} (-, default ):

Using default value

Command (m for help): p

Disk /dev/sdc: 1098.4 GB,  bytes

 heads,  sectors/track,  cylinders, total  sectors

Units = sectors of  *  =  bytes

Sector size (logical/physical):  bytes /  bytes

I/O size (minimum/optimal):  bytes /  bytes

Disk identifier: 0x9694814d

   Device Boot      Start         End      Blocks   Id  System

/dev/sdc1                     Linux

Command (m for help): w
4.格式化
查看帮助文件
[root@mysqlvm1 ~]# man mkfs.ext4
找到lazy
  lazy_itable_init[= <0 to disable, 1 to enable>]

                          If enabled and the uninit_bg feature is enabled, the

                          inode table will not be fully initialized by mke2fs.

                          This speeds up filesystem initialization noticeably,

                          but it requires the kernel  to  finish  initializing

                          the filesystem in the background when the filesystem

                          is first mounted.  If the option value  is  omitted,

                          it defaults to 1 to enable lazy inode table initial-

                          ization.
快速格式化
[root@mysqlvm1 ~]# mkfs.ext4 -E lazy_itable_init /dev/sdc1

mke2fs 1.41. (-May-)

Filesystem label=

OS type: Linux

Block size= (log=)

Fragment size= (log=)

Stride= blocks, Stripe width= blocks

 inodes,  blocks

 blocks (5.00%) reserved for the super user

First data block=

Maximum filesystem blocks=

 block groups

 blocks per group,  fragments per group

 inodes per group

Superblock backups stored on blocks:

        , , , , , , , , ,

        , , , , , , ,

        ,

Writing inode tables: done

Creating journal ( blocks): done

Writing superblocks and filesystem accounting information: done

This filesystem will be automatically checked every  mounts or

 days, whichever comes first.  Use tune2fs -c or -i to override.
5.创建挂载点并挂载
[root@mysqlvm1 ~]#mkdir /1T

[root@mysqlvm1 ~]#mount /dev/sdc1 /1T
第三步,安装mysql,这里选择yum安装
[root@mysqlvm1 dev]# cd /1T/

[root@mysqlvm1 1T]# yum -y install mysql-server
看到如下结果
Installed:

  mysql-server.x86_64 :5.1.-.el6

Dependency Installed:

  mysql.x86_64 :5.1.-.el6        perl-DBD-MySQL.x86_64 :4.013-.el6

Dependency Updated:

  mysql-libs.x86_64 :5.1.-.el6

Complete!
设置开机启动
[root@mysqlvm1 ~]# chkconfig mysqld on
启动mysql服务
[root@mysqlvm1 ~]# service mysqld start
设置mysql root用户以及密码
[root@mysqlvm1 ~]# mysql -u root

Welcome to the MySQL monitor.  Commands end with ; or \g.

Your MySQL connection id is

Server version: 5.1. Source distribution

Copyright (c) , , Oracle and/or its affiliates. All rights reserved.

Oracle is a registered trademark of Oracle Corporation and/or its

affiliates. Other names may be trademarks of their respective

owners.

Type 'help;' or '\h' for help. Type '\c' to clear the current input statement.

mysql> select user,host,password from mysql.user;

+------+-----------+----------+

| user | host      | password |

+------+-----------+----------+

| root | localhost |          |

| root | mysqlvm1  |          |

| root | 127.0.0.1 |          |

|      | localhost |          |

|      | mysqlvm1  |          |

+------+-----------+----------+

 rows in set (0.00 sec)

mysql> set password for root@localhost=password('root');

Query OK,  rows affected (0.00 sec)

mysql> exit
用户root,密码root
用root来登陆
[root@mysqlvm1 ~]# mysql -u root -p
以下是mysql的一些常见命令
show databases; //查看系统已存在的数据库

use databasesname;   //选择需要使用的数据库

drop database databasename; //删除选定的数据库

exit    //退出数据库的连接

create database test01;    //建立名为test的数据库

show tables;        // 列出当前数据库下的表

其他基本的增删改查使用标准SQL即可
第四步,进行压测
mysqlslap是mysql自带的基准测试工具,可以模拟多个并发连接数来向服务器发起多次查询请求,这样可以观察CPU的情况
单线程测试
[root@mysqlvm1 ~]# mysqlslap -a -uroot -proot

Benchmark

        Average number of seconds to run all queries: 0.001 seconds

        Minimum number of seconds to run all queries: 0.001 seconds

        Maximum number of seconds to run all queries: 0.001 seconds

        Number of clients running queries:

        Average number of queries per client:
多线程测试(100)
[root@mysqlvm1 ~]# mysqlslap -a -c  -uroot -proot

Benchmark

        Average number of seconds to run all queries: 0.193 seconds

        Minimum number of seconds to run all queries: 0.193 seconds

        Maximum number of seconds to run all queries: 0.193 seconds

        Number of clients running queries:

        Average number of queries per client:
迭代测试
[root@mysqlvm1 ~]# mysqlslap -a -i  -uroot -proot

Benchmark

        Average number of seconds to run all queries: 0.001 seconds

        Minimum number of seconds to run all queries: 0.001 seconds

        Maximum number of seconds to run all queries: 0.001 seconds

        Number of clients running queries:

        Average number of queries per client:
每个客户端的并发连接数*每个客户端查询的次数=总的查询次数
一下是mysqlslap的常见语法
# mysqlslap [options]

常用参数 [options] 详细说明:

--auto-generate-sql, -a 自动生成测试表和数据,表示用mysqlslap工具自己生成的SQL脚本来测试并发压力。

--auto-generate-sql-load-type=type 测试语句的类型。代表要测试的环境是读操作还是写操作还是两者混合的。取值包括:read,key,write,update和mixed(默认)。

--auto-generate-sql-add-auto-increment 代表对生成的表自动添加auto_increment列,从5.1.18版本开始支持。

--number-char-cols=N, -x N 自动生成的测试表中包含多少个字符类型的列,默认1

--number-int-cols=N, -y N 自动生成的测试表中包含多少个数字类型的列,默认1

--number-of-queries=N 总的测试查询次数(并发客户数×每客户查询次数)

--query=name,-q 使用自定义脚本执行测试,例如可以调用自定义的一个存储过程或者sql语句来执行测试。

--create-schema 代表自定义的测试库名称,测试的schema,MySQL中schema也就是database。

--commint=N 多少条DML后提交一次。

--compress, -C 如果服务器和客户端支持都压缩,则压缩信息传递。

--concurrency=N, -c N 表示并发量,也就是模拟多少个客户端同时执行select。可指定多个值,以逗号或者--delimiter参数指定的值做为分隔符。例如:--concurrency=100,200,500。

--engine=engine_name, -e engine_name 代表要测试的引擎,可以有多个,用分隔符隔开。例如:--engines=myisam,innodb。

--iterations=N, -i N 测试执行的迭代次数,代表要在不同并发环境下,各自运行测试多少次。

--only-print 只打印测试语句而不实际执行。

--detach=N 执行N条语句后断开重连。

--debug-info, -T 打印内存和CPU的相关信息。
接下来我们来执行一条更复杂的测试语句
并发分别为50,100并发,1000次查询,并进行迭代测试
[yangyang@mysqlvm1 ~]$ mysqlslap -a --concurrency=, --number-of-queries

 --iterations= --debug-info -uroot -proot

Benchmark

        Average number of seconds to run all queries: 0.147 seconds

        Minimum number of seconds to run all queries: 0.132 seconds

        Maximum number of seconds to run all queries: 0.163 seconds

        Number of clients running queries:

        Average number of queries per client:

Benchmark

        Average number of seconds to run all queries: 0.196 seconds

        Minimum number of seconds to run all queries: 0.154 seconds

        Maximum number of seconds to run all queries: 0.244 seconds

        Number of clients running queries:

        Average number of queries per client:

User time 0.62, System time 1.02

Maximum resident set size , Integral resident set size

Non-physical pagefaults , Physical pagefaults , Swaps

Blocks in  out , Messages in  out , Signals

Voluntary context switches , Involuntary context switches
接下来我们来测试一个更大的查询次数,极端情况下,30000次查询,并减小并发量为20,50
[yangyang@mysqlvm1 ~]$ mysqlslap -a --concurrency=, --number-of-queries  --iterations= --debug-info -uroot -proot

Benchmark

        Average number of seconds to run all queries: 60.339 seconds

        Minimum number of seconds to run all queries: 55.709 seconds

        Maximum number of seconds to run all queries: 63.855 seconds

        Number of clients running queries:

        Average number of queries per client:

Benchmark

        Average number of seconds to run all queries: 47.620 seconds

        Minimum number of seconds to run all queries: 46.899 seconds

        Maximum number of seconds to run all queries: 48.904 seconds

        Number of clients running queries:

        Average number of queries per client:

User time 406.27, System time 781.33

Maximum resident set size , Integral resident set size

Non-physical pagefaults , Physical pagefaults , Swaps

Blocks in  out , Messages in  out , Signals

Voluntary context switches , Involuntary context switches
我们到portal中去观察结果

我们看到cpu的峰值使用情况达到了95.97%,这个时候我们再升到D12V2,执行相同的操作,看看结果如何
[yangyang@mysqlvm1 ~]$  mysqlslap -a --concurrency=, --number-of-queries  --iterations= --debug-info -uroot -proot

Benchmark

        Average number of seconds to run all queries: 18.069 seconds

        Minimum number of seconds to run all queries: 17.928 seconds

        Maximum number of seconds to run all queries: 18.223 seconds

        Number of clients running queries:

        Average number of queries per client:

Benchmark

        Average number of seconds to run all queries: 16.130 seconds

        Minimum number of seconds to run all queries: 15.414 seconds

        Maximum number of seconds to run all queries: 18.134 seconds

        Number of clients running queries:

        Average number of queries per client:

User time 174.35, System time 100.30

Maximum resident set size , Integral resident set size

Non-physical pagefaults , Physical pagefaults , Swaps

Blocks in  out , Messages in  out , Signals

Voluntary context switches , Involuntary context switches
我们回到portal里面来观察结果,我们去新portal去看,这里为了结果更准确,我执行了两次,所以第二幅图有两个峰值,这样结果更直观。
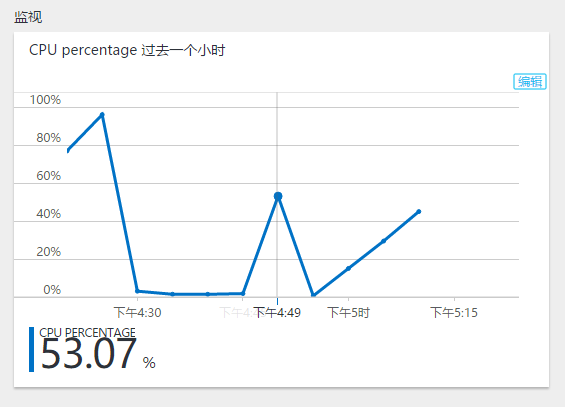
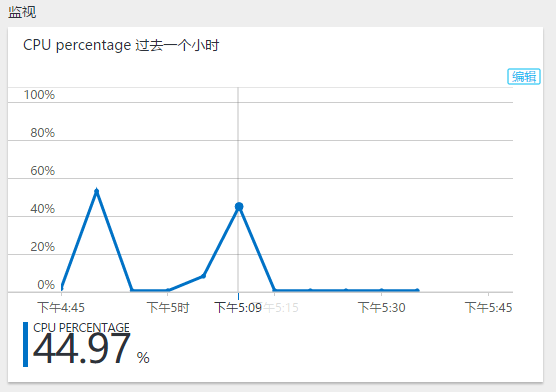
从上图可以看出,cpu最高也就在百分之五十左右,对于一般系统而言,前端不可能对后端有如此大的压力,即使在这种极端情况下,我们的虚拟机依然能承受,即使A6虚拟机也能承受,但是在这种极端情况我们不建议使用A系列虚拟机,D系列虚拟机性能比A系列高了百分之三十以上,再次证明,Azure的虚拟机性能是不容置疑的,本来笔者打算在linux系统中使用ps和top命令来查看cpu进程的,但是发现效果不是很良好,所以还是portal观察,但是portal的数据是有滞后性的,所以大家在观察的时候需要等待一会儿,一般十五分钟左右,本来我是想再测试一下DS系列虚拟机,但是由于普通存储盘的虚拟机无法升级到ssd的,所以就没有再去测试,如果有读者有兴趣可以去测试一下!!!
使用mysqlslap对mysql进行压测,观察Azure虚拟机cpu使用率的更多相关文章
- mysql常用压测工具
关键字:mysql压测工具 mysqlslap.sysbench 基准测试sysbench 压力测试 tpcc 具体怎么使用百度
- sysbench对MySQL的压测,使用sysbench压测磁盘io
QPS - query per secondTPS - transaction per second 不是特别关注,每个业务场景中事务标准是不一样的 Ⅰ.sysbench测试框架 Ⅱ.常用测试脚本 [ ...
- 关于mysql性能压测之tpcc
软件下载: wget http://imysql.com/wp-content/uploads/2014/09/tpcc-mysql-src.tgz安装依赖:yum install -y mysql- ...
- 压力测试(四)-Mysql数据库压测实操
1.Jmeter压测实战之JDBC request压测Mysql讲解 简介:讲解jdbc压测mysql相关准备工作,jar包添加,配置讲解 1.Thread Group -> add -> ...
- 压测过程中,CPU和内存占用率很高,案例简单分析
Q: 最近公司测试一个接口,数据库采用Mongo 并发策略:并发400个用户,每3秒加载5个用户,持续运行30分钟 数据量:8000条左右 压测结果发现: TPS始终在5左右 ...
- 关于mysql的压测sysbench
测试表格:CREATE TABLE `sbtest` ( `id` int(10) unsigned NOT NULL auto_increment, `k` int(10) unsigned NOT ...
- sysbench对MySQL的压测
QPS - query per second TPS - transaction per second 不是特别关注,每个业务场景中事务标准是不一样的 Ⅰ.sysbench测试框架 Ⅱ.常用测试脚本 ...
- MySQL Hardware--FIO压测
FIO参数 .txt 支持文件系统或者裸设备,-filename=/dev/sda2或-filename=/dev/sdb direct= 测试过程绕过机器自带的buffer,使测试结果更真实 rw= ...
- cpu压测测试--------自己设定cpu需要跑到的压力
下载压力测试包 https://pan.baidu.com/s/1DJYAzBHHDxMViy5dMel2Lw 提取码:a5j3 使用方法: 方法一:前端启动,按Ctrl+c结束 java -Dbus ...
随机推荐
- java.lang.String.getBytes(String charsetName)方法实例
java.lang.String.getBytes(String charsetName) 方法编码将此String使用指定的字符集的字节序列,并将结果存储到一个新的字节数组. 声明 以下是java. ...
- [LeetCode] Single Number 单独的数字
Given an array of integers, every element appears twice except for one. Find that single one. Note:Y ...
- [LeetCode] Subsets 子集合
Given a set of distinct integers, S, return all possible subsets. Note: Elements in a subset must be ...
- Spring + SpringMVC + Druid + JPA(Hibernate impl) 给你一个稳妥的后端解决方案
最近手头的工作不太繁重,自己试着倒腾了一套用开源框架组建的 JavaWeb 后端解决方案. 感觉还不错的样子,但实践和项目实战还是有很大的落差,这里只做抛砖引玉之用. 项目 git 地址:https: ...
- 设计模式之单例模式——Singleton
设计模式之单例模式--Singleton 设计意图: 保证类仅有一个实例,并且可以供应用程序全局使用.为了保证这一点,就需要这个类自己创建自己的对象,并且对外有 ...
- Activity的生命周期
Activity的生命周期 以往我们实现页面间的跳转都是实例化Intent类的对象,但是页面在我们眼前的出现与消失没有我们所看到的那么简单,它有一个复杂的生命周期,一个页面的出现,被覆盖,再次出现,被 ...
- Android中基于CGroup的memory子系统HAL层分析-lmkd
Android在内存管理上于Linux有些小的区别,其中一个就是引入了lowmemorykiller.从lowmemorykiller.c位于drivers/staging/android也可知道,属 ...
- UltralEdit 替换tips
UltralEdit的字符串替换,简直是编辑器的神来之笔! 可以通过 搜索--〉替换 菜单调出,也可以使用 Ctrl+R 快捷键 下面来看字符的表示吧: tab可以直接Tab键(可能不成功,因为被用作 ...
- Redis集群研究和实践(基于redis 3.0.5)
前言 redis 是我们目前大规模使用的缓存中间件,由于它强大高效而又便捷的功能,得到了广泛的使用.现在的2.x的稳定版本是2.8.19,也是我们项目中普遍用到的版本. redis在年初发布了3.0. ...
- css定位
文档流 所谓的文档流,指的是元素排版布局过程中,元素会自动从左往右,从上往下的流式排列.并最终窗体自上而下分成一行行, 并在每行中按从左至右的顺序排放元素.脱离文档流即是元素打乱了这个排列,或是从排版 ...