机器学习——支持向量机(SVM)
支持向量机原理
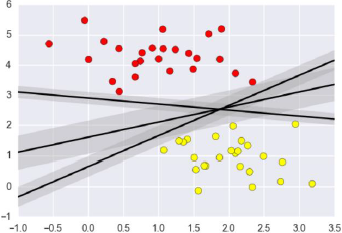
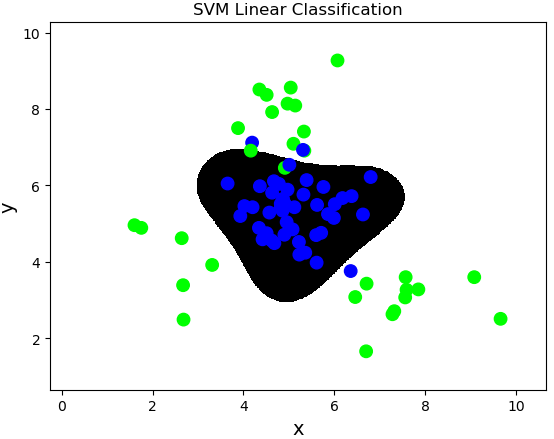
支持向量机要解决的问题其实就是寻求最优分类边界。且最大化支持向量间距,用直线或者平面,分隔分隔超平面。
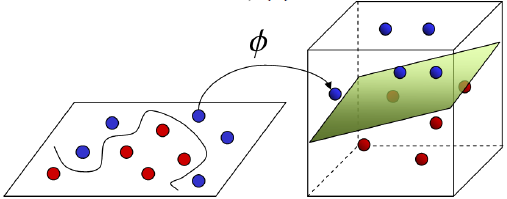
基于核函数的升维变换
通过名为核函数的特征变换,增加新的特征,使得低维度空间中的线性不可分问题变为高维度空间中的线性可分问题。
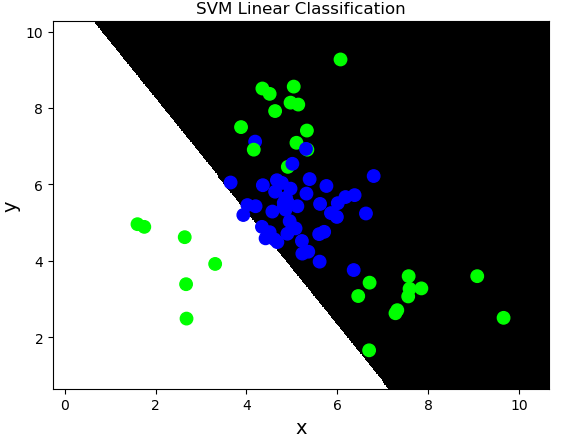
线性核函数:linear,不通过核函数进行维度提升,仅在原始维度空间中寻求线性分类边界。
基于线性核函数的SVM分类相关API:
import sklearn.svm as svm

model = svm.SVC(kernel='linear')

model.fit(train_x, train_y)
案例:对multiple2.txt中的数据进行分类。
import numpy as np

import sklearn.model_selection as ms

import sklearn.svm as svm

import sklearn.metrics as sm

import matplotlib.pyplot as mp

x, y = [], []

data = np.loadtxt('../data/multiple2.txt', delimiter=',', dtype='f8')

x = data[:, :-1]

y = data[:, -1]

train_x, test_x, train_y, test_y = \

    ms.train_test_split(x, y, test_size=0.25, random_state=5)

# 基于线性核函数的支持向量机分类器

model = svm.SVC(kernel='linear')

model.fit(train_x, train_y)

n = 500

l, r = x[:, 0].min() - 1, x[:, 0].max() + 1

b, t = x[:, 1].min() - 1, x[:, 1].max() + 1

grid_x = np.meshgrid(np.linspace(l, r, n),

                     np.linspace(b, t, n))

flat_x = np.column_stack((grid_x[0].ravel(), grid_x[1].ravel()))

flat_y = model.predict(flat_x)

grid_y = flat_y.reshape(grid_x[0].shape)

pred_test_y = model.predict(test_x)

cr = sm.classification_report(test_y, pred_test_y)

print(cr)

mp.figure('SVM Linear Classification', facecolor='lightgray')

mp.title('SVM Linear Classification', fontsize=20)

mp.xlabel('x', fontsize=14)

mp.ylabel('y', fontsize=14)

mp.tick_params(labelsize=10)

mp.pcolormesh(grid_x[0], grid_x[1], grid_y, cmap='gray')

mp.scatter(test_x[:, 0], test_x[:, 1], c=test_y, cmap='brg', s=80)

mp.show()
多项式核函数:poly,通过多项式函数增加原始样本特征的高次方幂
$$y = x_1+x_2 \\
y = x_1^2 + 2x_1x_2 + x_2^2 \\
y = x_1^3 + 3x_1^2x_2 + 3x_1x_2^2 + x_2^3$$
案例,基于多项式核函数训练sample2.txt中的样本数据。
# 基于线性核函数的支持向量机分类器

model = svm.SVC(kernel='poly', degree=3)

model.fit(train_x, train_y)
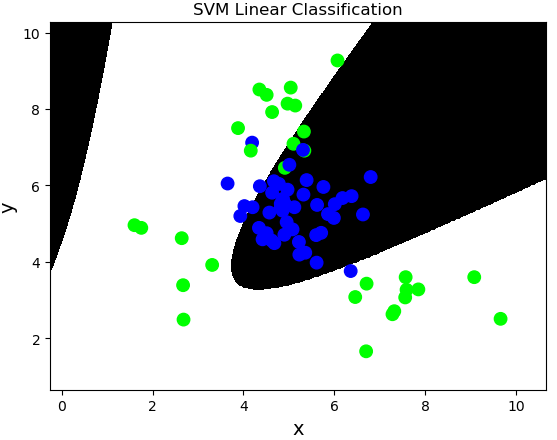
径向基核函数:rbf,通过高斯分布函数增加原始样本特征的分布概率
案例,基于径向基核函数训练sample2.txt中的样本数据。
# 基于径向基核函数的支持向量机分类器

# C:正则强度

# gamma:正态分布曲线的标准差

model = svm.SVC(kernel='rbf', C=600, gamma=0.01)

model.fit(train_x, train_y)
样本类别均衡化
样本类别均衡化:通过类别权重的均衡化,使所占比例较小的样本权重较高,而所占比例较大的样本权重较低,以此平均化不同类别样本对分类模型的贡献,提高模型性能。
样本类别均衡化相关API:
model = svm.SVC(kernel='linear', class_weight='balanced')

model.fit(train_x, train_y)
案例:修改线性核函数的支持向量机案例,基于样本类别均衡化读取imbalance.txt训练模型。
import numpy as np

import sklearn.model_selection as ms

import sklearn.svm as svm

import sklearn.metrics as sm

import matplotlib.pyplot as mp

data = np.loadtxt('../machine_learning_date/imbalance.txt', delimiter=',', dtype='f8')

x = data[:, :-1]

y = data[:, -1]

# 选择svm做分类

train_x, test_x, train_y, test_y = ms.train_test_split(x, y, test_size=0.25, random_state=5)

model = svm.SVC(kernel='linear', class_weight='balanced')

# model = svm.SVC(kernel='linear', class_weight={0:10,1:1})     # 0类别权重为10,1类别权重为1.

model.fit(train_x, train_y)

pred_test_y = model.predict(test_x)

print(sm.classification_report(test_y, pred_test_y))

# 绘制分类边界线

n = 500

l, r = x[:, 0].min() - 1, x[:, 0].max() + 1

b, t = x[:, 1].min() - 1, x[:, 1].max() + 1

grid_x = np.meshgrid(np.linspace(l, r, n), np.linspace(b, t, n))

flat_x = np.column_stack((grid_x[0].ravel(), grid_x[1].ravel()))

flat_y = model.predict(flat_x)

grid_y = flat_y.reshape(grid_x[0].shape)

mp.figure('Class Balanced', facecolor='lightgray')

mp.title('Class Balanced', fontsize=20)

mp.xlabel('x', fontsize=14)

mp.ylabel('y', fontsize=14)

mp.tick_params(labelsize=10)

mp.pcolormesh(grid_x[0], grid_x[1], grid_y, cmap='gray')

mp.scatter(x[:, 0], x[:, 1], c=y, cmap='brg', s=80)

mp.show()

#              precision    recall  f1-score   support

#

#         0.0       0.29      0.76      0.42        42

#         1.0       0.95      0.70      0.80       258

#

# avg / total       0.86      0.71      0.75       300

置信概率
置信概率:根据样本与分类边界的距离远近,对其预测类别的可信程度进行量化,离边界越近的样本,置信概率越低,反之,离边界越远的样本,置信概率高。
获取每个样本的置信概率相关API:
# 在获取模型时,给出超参数probability=True

model = svm.SVC(kernel='rbf', C=600, gamma=0.01, probability=True)

预测结果 = model.predict(输入样本矩阵)

# 调用model.predict_proba(样本矩阵)可以获取每个样本的置信概率矩阵

置信概率矩阵 = model.predict_proba(输入样本矩阵)
置信概率矩阵格式如下:
| 类别1 | 类别2 | |
|---|---|---|
| 样本1 | 0.8 | 0.2 |
| 样本2 | 0.9 | 0.1 |
| 样本3 | 0.5 | 0.5 |
案例:修改基于径向基核函数的SVM案例,新增测试样本,输出每个测试样本的执行概率,并给出标注。
# 新增样本

prob_x = np.array([[2, 1.5], [8, 9], [4.8, 5.2], [4, 4], [2.5, 7], [7.6, 2], [5.4, 5.9]])

pred_prob_y = model.predict(prob_x)

probs = model.predict_proba(prob_x)

print(probs)

# [[3.00000090e-14 1.00000000e+00]

#  [3.00000090e-14 1.00000000e+00]

#  [9.73038186e-01 2.69618143e-02]

#  [5.65786038e-01 4.34213962e-01]

#  [2.77725531e-03 9.97222745e-01]

#  [2.91704904e-11 1.00000000e+00]

#  [9.43796673e-01 5.62033274e-02]]

# 绘制分类边界线

n = 500

l, r = x[:, 0].min() - 1, x[:, 0].max() + 1

b, t = x[:, 1].min() - 1, x[:, 1].max() + 1

grid_x = np.meshgrid(np.linspace(l, r, n), np.linspace(b, t, n))

flat_x = np.column_stack((grid_x[0].ravel(), grid_x[1].ravel()))

flat_y = model.predict(flat_x)

grid_y = flat_y.reshape(grid_x[0].shape)

mp.figure('Probability', facecolor='lightgray')

mp.title('Probability', fontsize=20)

mp.xlabel('x', fontsize=14)

mp.ylabel('y', fontsize=14)

mp.tick_params(labelsize=10)

mp.pcolormesh(grid_x[0], grid_x[1], grid_y, cmap='gray')

mp.scatter(test_x[:, 0], test_x[:, 1], c=test_y, cmap='brg', s=80)

mp.scatter(prob_x[:, 0], prob_x[:, 1], c=pred_prob_y, cmap='jet_r', s=80, marker='D')

# 绘制每个测试样本,并给出标注

for i in range(len(probs)):

    mp.annotate(

        '{}% {}%'.format(

            round(probs[i, 0] * 100, 2),

            round(probs[i, 1] * 100, 2)),

        xy=(prob_x[i, 0], prob_x[i, 1]),

        xytext=(12, -12),

        textcoords='offset points',

        horizontalalignment='left',

        verticalalignment='top',

        fontsize=9,

        bbox={'boxstyle': 'round,pad=0.6', 'fc': 'orange', 'alpha': 0.8})

mp.show()
网格搜索
获取一个最优超参数的方式可以绘制验证曲线,但是验证曲线只能每次获取一个最优超参数。如果多个超参数有很多排列组合的话,就可以使用网格搜索寻求最优超参数组合。
针对超参数组合列表中的每一个超参数组合,实例化给定的模型,做cv次交叉验证,将其中平均f1得分最高的超参数组合作为最佳选择,实例化模型对象。
网格搜索相关API:
import sklearn.model_selection as ms

model = ms.GridSearchCV(模型, 超参数组合列表, cv=折叠数)

model.fit(输入集,输出集)

# 获取网格搜索每个参数组合

model.cv_results_['params']

# 获取网格搜索每个参数组合所对应的平均测试分值

model.cv_results_['mean_test_score']

# 获取最好的参数

model.best_params_   # 最优超参数组合

model.best_score_    # 最优得分

model.best_estimator_  # 最优模型对象
案例:修改置信概率案例,基于网格搜索得到最优超参数。
import numpy as np

import sklearn.model_selection as ms

import sklearn.svm as svm

import sklearn.metrics as sm

import matplotlib.pyplot as plt

data = np.loadtxt('../machine_learning_date/multiple2.txt', delimiter=',', dtype='f8')

x = data[:, :-1]

y = data[:, -1]

# 选择svm做分类

train_x, test_x, train_y, test_y = ms.train_test_split(x, y, test_size=0.25, random_state=5)

model = svm.SVC(probability=True)

# 根据网格搜索选择最优模型

# 整理网格搜索所需要的超参数列表

params = [{'kernel': ['linear'], 'C': [1, 10, 100, 1000]},

          {'kernel': ['poly'], 'C': [1], 'degree': [2, 3]},

          {'kernel': ['rbf'], 'C': [1, 10, 100, 1000], 'gamma': [1, 0.1, 0.01, 0.001]}]

model = ms.GridSearchCV(model, params, cv=5)

model.fit(train_x, train_y)

# 获取得分最优的的超参数信息

print(model.best_params_)  # {'C': 1, 'gamma': 1, 'kernel': 'rbf'}

# 获取最优得分

print(model.best_score_)  # 0.96

# 获取最优模型的信息

print(model.best_estimator_)

# SVC(C=1, cache_size=200, class_weight=None, coef0=0.0,

#   decision_function_shape='ovr', degree=3, gamma=1, kernel='rbf',

#   max_iter=-1, probability=True, random_state=None, shrinking=True,

#   tol=0.001, verbose=False)

# 输出每个超参数组合信息及其得分

for param, score in zip(model.cv_results_['params'], model.cv_results_['mean_test_score']):

    print(param, '->', score)

    # {'C': 1, 'kernel': 'linear'} -> 0.5911111111111111

    # {'C': 10, 'kernel': 'linear'} -> 0.5911111111111111

    # ...

    # ...

    # {'C': 1000, 'gamma': 0.01, 'kernel': 'rbf'} -> 0.9555555555555556

    # {'C': 1000, 'gamma': 0.001, 'kernel': 'rbf'} -> 0.92

pred_test_y = model.predict(test_x)

print(sm.classification_report(test_y, pred_test_y))

#              precision    recall  f1-score   support

#         0.0       0.95      0.93      0.94        45

#         1.0       0.90      0.93      0.92        30

# avg / total       0.93      0.93      0.93        75

# 新增样本

prob_x = np.array([[2, 1.5], [8, 9], [4.8, 5.2], [4, 4], [2.5, 7], [7.6, 2], [5.4, 5.9]])

pred_prob_y = model.predict(prob_x)

probs = model.predict_proba(prob_x)     # 获取每个样本的置信概率矩阵

print(probs)

# 绘制分类边界线

n = 500

l, r = x[:, 0].min() - 1, x[:, 0].max() + 1

b, t = x[:, 1].min() - 1, x[:, 1].max() + 1

grid_x = np.meshgrid(np.linspace(l, r, n), np.linspace(b, t, n))

flat_x = np.column_stack((grid_x[0].ravel(), grid_x[1].ravel()))

flat_y = model.predict(flat_x)

grid_y = flat_y.reshape(grid_x[0].shape)

plt.figure('Probability')

plt.title('Probability')

plt.xlabel('x', fontsize=14)

plt.ylabel('y', fontsize=14)

plt.tick_params(labelsize=10)

plt.pcolormesh(grid_x[0], grid_x[1], grid_y, cmap='gray')

plt.scatter(test_x[:, 0], test_x[:, 1], c=test_y, cmap='brg', s=80)

plt.scatter(prob_x[:, 0], prob_x[:, 1], c=pred_prob_y, cmap='jet_r', s=80, marker='D')

for i in range(len(probs)):

    plt.annotate('{}% {}%'.format(

        round(probs[i, 0] * 100, 2),

        round(probs[i, 1] * 100, 2)),

        xy=(prob_x[i, 0], prob_x[i, 1]),

        xytext=(12, -12),

        textcoords='offset points',

        horizontalalignment='left',

        verticalalignment='top',

        fontsize=9,

        bbox={'boxstyle': 'round,pad=0.6', 'fc': 'orange', 'alpha': 0.8})

plt.show()

事件预测
加载event.txt,预测某个时间段是否会出现特殊事件。
import numpy as np

import sklearn.preprocessing as sp

import sklearn.model_selection as ms

import sklearn.svm as svm

import sklearn.metrics as sm

class DigitEncoder:

    # 模拟LabelEncoder编写的数字编码器

    # 非数字字符串的特征需要做标签编码,

    # 数字字符串的特征需要做转换编码

    def fit_transform(self, y):

        return y.astype('i4')

    def transform(self, y):

        return y.astype('i4')

    def inverse_transform(self, y):

        return y.astype('str')

# 加载并整理数据集

# data = np.load('../machine_learning_date/events.txt', delimiter=",", dtype='U15')

data = []

with open('../machine_learning_date/events.txt', 'r') as f:

    for line in f.readlines():

        data.append(line.split(','))

data = np.array(data)

data = np.delete(data, 1, axis=1)

cols = data.shape[1]  # 获取一共有多少列

x, y = [], []

encoders = []

for i in range(cols):

    col = data[:, i]

    # 判断当前列是否是数字字符串

    if col[0].isdigit():

        encoder = DigitEncoder()

    else:

        encoder = sp.LabelEncoder()

    # 使用编码器对数据进行编码

    if i < cols - 1:

        x.append(encoder.fit_transform(col))

    else:

        y = encoder.fit_transform(col)

    encoders.append(encoder)

x = np.array(x).T   # (5040,4)

y = np.array(y)     # (5040,)

# 拆分测试集与训练集

train_x, test_x, train_y, test_y = ms.train_test_split(x, y, test_size=0.25, random_state=7)

# 构建模型

model = svm.SVC(kernel='rbf', class_weight='balanced')

model.fit(train_x, train_y)

# 测试

pred_test_y = model.predict(test_x)

print(sm.classification_report(test_y, pred_test_y))

# 业务应用

data = [['Tuesday', '13:30:00', '', '']]

data = np.array(data).T

x = []

for row in range(len(data)):

    encoder = encoders[row]

    x.append(encoder.transform(data[row]))

x = np.array(x).T

pred_y = model.predict(x)

print(encoders[-1].inverse_transform(pred_y))   # ['eventA\n']
交通流量预测(回归)
加载traffic.txt,预测在某个时间段某个交通路口的车流量。
"""车流量预测"""

import numpy as np

import sklearn.preprocessing as sp

import sklearn.model_selection as ms

import sklearn.svm as svm

import sklearn.metrics as sm

class DigitEncoder:

    def fit_transform(self, y):

        return y.astype(int)

    def transform(self, y):

        return y.astype(int)

    def inverse_transform(self, y):

        return y.astype(str)

data = []

# 回归

data = np.loadtxt('../machine_learning_date/traffic.txt', delimiter=',', dtype='U20')

data = data.T

encoders, x = [], []

for row in range(len(data)):

    if data[row][0].isdigit():

        encoder = DigitEncoder()

    else:

        encoder = sp.LabelEncoder()

    if row < len(data) - 1:

        x.append(encoder.fit_transform(data[row]))

    else:

        y = encoder.fit_transform(data[row])

    encoders.append(encoder)

x = np.array(x).T

train_x, test_x, train_y, test_y = \

    ms.train_test_split(x, y, test_size=0.25, random_state=5)

# 支持向量机回归器

model = svm.SVR(kernel='rbf', C=10, epsilon=0.2)

model.fit(train_x, train_y)

pred_test_y = model.predict(test_x)

print(sm.r2_score(test_y, pred_test_y))     # 0.6379517119380995

# 业务应用

data = [['Tuesday', '13:35', 'San Francisco', 'yes']]

data = np.array(data).T

x = []

for row in range(len(data)):

    encoder = encoders[row]

    x.append(encoder.transform(data[row]))

x = np.array(x).T

pred_y = model.predict(x)

print(int(pred_y))      #
回归:线性回归、岭回归、多项式回归、决策树、正向激励、随机森林、SVR。
分类:逻辑分类、朴素贝叶斯、决策树、随机森林、SVC。
机器学习——支持向量机(SVM)的更多相关文章
- 机器学习——支持向量机SVM
前言 学习本章节前需要先学习: <机器学习--最优化问题:拉格朗日乘子法.KKT条件以及对偶问题> <机器学习--感知机> 1 摘要: 支持向量机(SVM)是一种二类分类模型, ...
- 吴裕雄 python 机器学习——支持向量机SVM非线性分类SVC模型
import numpy as np import matplotlib.pyplot as plt from sklearn import datasets, linear_model,svm fr ...
- 机器学习——支持向量机(SVM)之拉格朗日乘子法,KKT条件以及简化版SMO算法分析
SVM有很多实现,现在只关注其中最流行的一种实现,即序列最小优化(Sequential Minimal Optimization,SMO)算法,然后介绍如何使用一种核函数(kernel)的方式将SVM ...
- coursera机器学习-支持向量机SVM
#对coursera上Andrew Ng老师开的机器学习课程的笔记和心得: #注:此笔记是我自己认为本节课里比较重要.难理解或容易忘记的内容并做了些补充,并非是课堂详细笔记和要点: #标记为<补 ...
- 机器学习-支持向量机SVM
简介: 支持向量机(SVM)是一种二分类的监督学习模型,他的基本模型是定义在特征空间上的间隔最大的线性模型.他与感知机的区别是,感知机只要找到可以将数据正确划分的超平面即可,而SVM需要找到间隔最大的 ...
- 机器学习支持向量机SVM笔记
SVM简述: SVM是一个线性二类分类器,当然通过选取特定的核函数也可也建立一个非线性支持向量机.SVM也可以做一些回归任务,但是它预测的时效性不是太长,他通过训练只能预测比较近的数据变化,至于再往后 ...
- 机器学习——支持向量机(SVM)之核函数(kernel)
对于线性不可分的数据集,可以利用核函数(kernel)将数据转换成易于分类器理解的形式. 如下图,如果在x轴和y轴构成的坐标系中插入直线进行分类的话, 不能得到理想的结果,或许我们可以对圆中的数据进行 ...
- 机器学习——支持向量机(SVM)之Platt SMO算法
Platt SMO算法是通过一个外循环来选择第一个alpha值的,并且其选择过程会在两种方式之间进行交替: 一种方式是在所有数据集上进行单遍扫描,另一种方式则是在非边界alpha中实现单遍扫描. 所谓 ...
- 机器学习:Python中如何使用支持向量机(SVM)算法
(简单介绍一下支持向量机,详细介绍尤其是算法过程可以查阅其他资) 在机器学习领域,支持向量机SVM(Support Vector Machine)是一个有监督的学习模型,通常用来进行模式识别.分类(异 ...
随机推荐
- Apache ActiveMQ任意文件写入漏洞(CVE-2016-3088)复现
Apache ActiveMQ任意文件写入漏洞(CVE-2016-3088)复现 一.漏洞描述 该漏洞出现在fileserver应用中,漏洞原理:ActiveMQ中的fileserver服务允许用户通 ...
- PythonDay05
第五章 今日内容 字典 字典 语法:{'key1':1,'key2':2} 注意:dict保存的数据不是按照我们添加进去的顺序保存的. 是按照hash表的顺序保存的. ⽽hash表 不是连续的. 所以 ...
- 万万没想到,JVM内存结构的面试题可以问的这么难?
在我的博客中,之前有很多文章介绍过JVM内存结构,相信很多看多我文章的朋友对这部分知识都有一定的了解了. 那么,请大家尝试着回答一下以下问题: 1.JVM管理的内存结构是怎样的? 2.不同的虚拟机在实 ...
- Zookeeper开源客户端Curator的使用
开源zk客户端-Curator 创建会话: RetryPolicy retryPolicy = new ExponentialBackoffRetry(1000,3); CuratorFramewor ...
- resolv.conf文件配置相关的案例
引言 操作系统中/etc/resolv.conf配置文件中的内容一般为空,如果该文件配置不正确,将导致ssh.route.netstat命令响应慢的问题. 在/etc/resolv.conf添加错误地 ...
- python对常见数据类型的遍历
本文将通过for ... in ...的语法结构,遍历字符串.列表.元组.字典等数据结构. 字符串遍历 >>> a_str = "hello itcast" &g ...
- vue中的虚拟DOM树
什么是虚拟DOM树?(Virtual DOM) 虚拟DOM树其实就是一个普通的js对象,它是用来描述一段HTML片段的 01 当页面渲染的时候Vue会创建一颗虚拟DOM树 02 ...
- 调用百度翻译 API 来翻译网站信息
之前说过jquery.i18n.js 来做网站的中英翻译,前提就得做一套中文内容,一套英文内容来解决,好处是中英翻译可以准确无误,本篇文章我们来看一下调用百度翻译的 API 来进行网站的翻译,但是翻译 ...
- BFS-迷宫问题
问题描述 定义一个二维数组: int maze[5][5] = { 0, 1, 0, 0, 0, 0, 1, 0, 1, 0, 0, 0, 0, 0, 0, 0, 1, 1, 1, 0, 0, 0, ...
- 【JS档案揭秘】第四集 关于this的讨论到此为止
网上关于this的指向问题的博客文章很多,但大多数都是复制粘贴,也不能用简洁的语言讲清楚,而是不停地写一些示例,看得人云里雾里. 这一集,我只给出结论,以及判定的通用方法,至于是否确实如我所讲,大家可 ...