svg拉伸,原来凹凸可以这么玩
原文:http://www.smartjava.org/content/render-geographic-information-3d-threejs-and-d3js
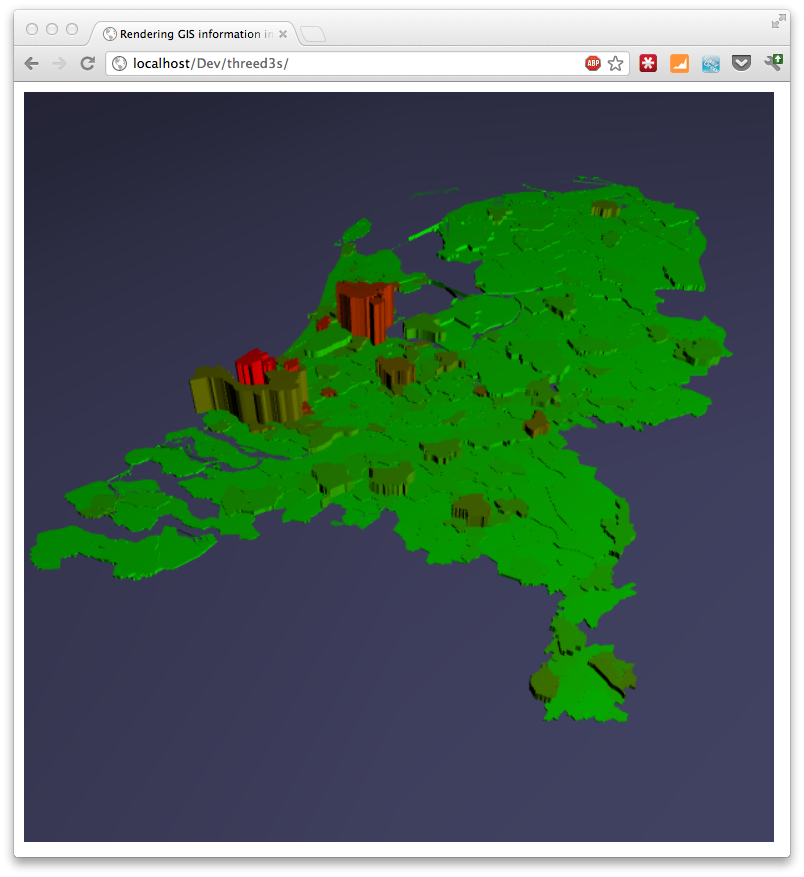
The last couple of days I've been playing around with three.js and geo information. I wanted to be able to render map/geo data (e.g. in geojson format) inside the three.js scene. That way I have another dimension I could use to show a specific metric instead of just using the color in a 2D map. In this article I'll show you how you can do this. The example we'll create shows a 3D map of the Netherlands, rendered in Three.js, that uses a color to indicate the population density per municipality and the height of each municipality represents the actual number of residents.
Or if you can look at aworking example.
This information is based on open data available from the Dutch government. If you look at the source from the example, you can see the json we use for this. For more information on geojson and how to parse it see the other articles I did on this subject:
To get this working we'll take the following steps:
- Load the input geo data
- Setup a three.js scene
- Convert the input data to a Three.js path using d3.js
- Set the color and height of the Three.js object
- Render everything
Just a reminder to see everything working, just look at theexample.
Load the input geo data
D3.js has support to load json and directly transform it to an SVG path. Though this is a convenient way, I only needed the path data, not the complete SVG elements. So to load json I just used jquery's json support.
// get the data

    jQuery.getJSON('data/cities.json', function(data, textStatus, jqXHR) {

    ..

   });
This will load the data and pass it in the data object to the supplied function.
Setup a three.js scene
Before we do anything with the data lets first setup a basic Three.js scene.
// Set up the three.js scene. This is the most basic setup without

        // any special stuff

        function initScene() {

            // set the scene size

            var WIDTH = 600, HEIGHT = 600;

            // set some camera attributes

            var VIEW_ANGLE = 45, ASPECT = WIDTH / HEIGHT, NEAR = 0.1, FAR = 10000;

            // create a WebGL renderer, camera, and a scene

            renderer = new THREE.WebGLRenderer({antialias:true});

            camera = new THREE.PerspectiveCamera(VIEW_ANGLE, ASPECT,

                                                  NEAR, FAR);

            scene = new THREE.Scene();

            // add and position the camera at a fixed position

            scene.add(camera);

            camera.position.z = 550;

            camera.position.x = 0;

            camera.position.y = 550;

            camera.lookAt( scene.position );

            // start the renderer, and black background

            renderer.setSize(WIDTH, HEIGHT);

            renderer.setClearColor(0x000);

            // add the render target to the page

            $("#chart").append(renderer.domElement);

            // add a light at a specific position

            var pointLight = new THREE.PointLight(0xFFFFFF);

            scene.add(pointLight);

            pointLight.position.x = 800;

            pointLight.position.y = 800;

            pointLight.position.z = 800;

            // add a base plane on which we'll render our map

            var planeGeo = new THREE.PlaneGeometry(10000, 10000, 10, 10);

            var planeMat = new THREE.MeshLambertMaterial({color: 0x666699});

            var plane = new THREE.Mesh(planeGeo, planeMat);

            // rotate it to correct position

            plane.rotation.x = -Math.PI/2;

            scene.add(plane);

        }
Nothing to special, the comments inline should nicely explain what we're doing here. Next it gets more interesting.
Convert the input data to a Three.js path using d3.js
What we need to do next is convert our geojson input format to a THREE.Path that we can use in our scene. Three.js itself doesn't support geojson or SVG for that matter. Luckily though someone already started work on integrating d3.js with three.js. This project is called "d3-threeD" (sources can be found on github here ). With this extension you can automagically render SVG elements in 3D directly from D3.js. Cool stuff, but it didn't allow me any control over how the elements were rendered. It does however contain a function we can use for our scenario. If you look through the source code of this project you'll find a method called "transformSVGPath". This method converts an SVG path string to a Three.Shape element. Unfortunately this method isn't exposed, but that's quickly solved by adding this to the d3-threeD.js file:
// at the top

var transformSVGPathExposed;

...

// within the d3threeD(exports) function

transformSVGPathExposed = transformSVGPath;

</javscript>

This way we can call this method separately. Now that we have a way to transform an SVG path to a Three.js shape, we only need to convert the geojson to an SVG string and pass it to this function. We can use the geo functionaly from D3.js for this:

<javascript>

geons.geoConfig = function() {

    this.TRANSLATE_0 = appConstants.TRANSLATE_0;

    this.TRANSLATE_1 = appConstants.TRANSLATE_1;

    this.SCALE = appConstants.SCALE;

    this.mercator = d3.geo.mercator();

    this.path = d3.geo.path().projection(this.mercator);

    this.setupGeo = function() {

        var translate = this.mercator.translate();

        translate[0] = this.TRANSLATE_0;

        translate[1] = this.TRANSLATE_1;

        this.mercator.translate(translate);

        this.mercator.scale(this.SCALE);

    }

}
The path variable from the previous piece of code can now be used like this:
var feature = geo.path(geoFeature);
To convert a geojson element to an SVG path. So how does this look combined?
// add the loaded gis object (in geojson format) to the map

      function addGeoObject() {

          // keep track of rendered objects

          var meshes = [];

          ...

         // convert to mesh and calculate values

          for (var i = 0 ; i < data.features.length ; i++) {

              var geoFeature = data.features[i]

              var feature = geo.path(geoFeature);

              // we only need to convert it to a three.js path

              var mesh = transformSVGPathExposed(feature);

              // add to array

              meshes.push(mesh);

             ...

      }
As you can see we iterate over the data.features list (this contains all the geojson representations of the municipalities). Each municipality is converted to an svg string, and each svg string is converted to a mesh. This mesh is a Three.js object that we can render on the scene.
Set the color and height of the Three.js object
Now we just need to set the height and the color of the Three.js shape and add it to the scene. The extended addGeoObject method now looks like this:
// add the loaded gis object (in geojson format) to the map

      function addGeoObject() {

          // keep track of rendered objects

          var meshes = [];

          var averageValues = [];

          var totalValues = [];

          // keep track of min and max, used to color the objects

          var maxValueAverage = 0;

          var minValueAverage = -1;

          // keep track of max and min of total value

          var maxValueTotal = 0;

          var minValueTotal = -1;

          // convert to mesh and calculate values

          for (var i = 0 ; i < data.features.length ; i++) {

              var geoFeature = data.features[i]

              var feature = geo.path(geoFeature);

              // we only need to convert it to a three.js path

              var mesh = transformSVGPathExposed(feature);

              // add to array

              meshes.push(mesh);

              // we get a property from the json object and use it

              // to determine the color later on

              var value = parseInt(geoFeature.properties.bev_dichth);

              if (value > maxValueAverage) maxValueAverage = value;

              if (value < minValueAverage || minValueAverage == -1) minValueAverage = value;

              averageValues.push(value);

              // and we get the max values to determine height later on.

              value = parseInt(geoFeature.properties.aant_inw);

              if (value > maxValueTotal) maxValueTotal = value;

              if (value < minValueTotal || minValueTotal == -1) minValueTotal = value;

              totalValues.push(value);

          }

          // we've got our paths now extrude them to a height and add a color

          for (var i = 0 ; i < averageValues.length ; i++) {

              // create material color based on average

              var scale = ((averageValues[i] - minValueAverage) / (maxValueAverage - minValueAverage)) * 255;

              var mathColor = gradient(Math.round(scale),255);

              var material = new THREE.MeshLambertMaterial({

                  color: mathColor

              });

              // create extrude based on total

              var extrude = ((totalValues[i] - minValueTotal) / (maxValueTotal - minValueTotal)) * 100;

              var shape3d = meshes[i].extrude({amount: Math.round(extrude), bevelEnabled: false});

              // create a mesh based on material and extruded shape

              var toAdd = new THREE.Mesh(shape3d, material);

              // rotate and position the elements nicely in the center

              toAdd.rotation.x = Math.PI/2;

              toAdd.translateX(-490);

              toAdd.translateZ(50);

              toAdd.translateY(extrude/2);

              // add to scene

              scene.add(toAdd);

          }

      }

        // simple gradient function

        function gradient(length, maxLength) {

            var i = (length * 255 / maxLength);

            var r = i;

            var g = 255-(i);

            var b = 0;

            var rgb = b | (g << 8) | (r << 16);

            return rgb;

        }
A big piece of code, but not that complex. What we do here is we keep track of two values for each municipality: the population density and the total population. These values are used to respectively calculate the color (using the gradient function) and the height. The height is used in the Three.js extrude function which converts our 2D Three.Js path to a 3D shape. The color is used to define a material. This shape and material is used to create the Mesh that we add to the scene.
Render everything
All that is left is to render everything. For this example we're not interested in animations or anything so we can make a single call to the renderer:
renderer.render( scene, camera );
And the result is as you saw in the beginning. The following image shows a different example. This time we once again show the population density, but now the height represents the land area of the municipality.

I'm currently creating a new set of geojson data, but this time for the whole of Europe. So in the next couple of weeks expect some articles using maps of Europe.
svg拉伸,原来凹凸可以这么玩的更多相关文章
- 【带着canvas去流浪(11)】Three.js入门学习笔记
目录 一. 资料推荐及建议 二. Three.js中的基本概念 三.重点笔记 四.补充示例 示例代码托管在:http://www.github.com/dashnowords/blogs 博客园地址: ...
- 多种css3时尚侧栏菜单展开显示效果Off-Canvas Menu Effects
今天我们想分享多种css3时尚侧栏菜单展开显示效果.侧边栏应用广泛,我们之前已经产生了一些效果灵感.风格演变,今天我们要展示一套新的灵感的现代效果.不同的布局和菜单的同步转换和页面可以让一切看起来更有 ...
- 线条之美,玩转SVG线条动画
线条之美,玩转SVG线条动画 作者:AlloyTeam www.alloyteam.com/2017/02/the-beauty-of-the-lines-break-lines-svg-animat ...
- selenium玩转svg操作
今天写脚本发现页面有svg结构,里面的元素无法定位,查找很多资料,然后就记录下来 初步尝试直接在页面中获取svg中包含元素的xpath,直接利用selenium方法访问,无法捕获到相关元素信息. SV ...
- 玩转SVG线条动画
在上一节的<SVG线条动画实现原理>一文中,了解了SVG中线动画是怎么做的.在这篇文章中,了解了怎么借助Sketch这样的制作软件绘制SVG的路径,然后借助于SVG的stroke-dash ...
- o'Reill的SVG精髓(第二版)学习笔记——第十一章
第十一章:滤镜 11.1滤镜的工作原理 当SVG阅读器程序处理一个图形对象时,它会将对象呈现在位图输出设备上:在某一时刻,阅读器程序会把对象的描述信息转换为一组对应的像素,然后呈现在输出设备上.例如我 ...
- 深度掌握SVG路径path的贝塞尔曲线指令
一.数字.公式.函数.变量,哦,NO! 又又一次说起贝塞尔曲线(英语:Bézier curve,维基百科详尽中文释义戳这里),我最近在尝试实现复杂的矢量图形动画,发现对贝塞尔曲线的理解馒头那么厚,是完 ...
- 理解SVG的viewport,viewBox,preserveAspectRatio
万丈高楼平地起,基础很重要. viewport 表示SVG可见区域的大小,或者可以想象成舞台大小,画布大小. <svg width="500" height="30 ...
- svg gradient
SVG和canvas中是一样的,都是使用标准的HTML/CSS中的颜色表示方法,这些颜色都可以用于fill和stroke属性. 基本有下面这些定义颜色的方式: 1. 颜色名字: 直接使用颜色名字red ...
随机推荐
- laravel 使用artisan命令新增数据库字段
php artisan make:migration create_comments_table <?php use Illuminate\Database\Schema\Blueprint; ...
- Server Tomcat v7.0 Server at localhost was unable to&nbs 报错问题解决
在eclipse启动tomcat时遇到超时45秒的问题: Server Tomcat v7.0 Server at localhost was unable to start within 45 se ...
- Python学习基础知识概要
1.输入输出 输出实例 1 2 print 'hello','world' hello world 输入实例 1 2 3 4 5 name = raw_input(); print " ...
- Nodejs与ES6系列3:generator对象
3.generator对象 Generator函数是ES6提供的一种异步编程解决方案,语法行为与传统函数完全不同.Generator的中文翻译是生成器,它是ECMAScript6(代号harmory) ...
- HTML5 随机弹跳的小球
查看效果:http://keleyi.com/a/bjad/tc1y11dy.htm Chrome效果图: 火狐效果图:推荐:http://hovertree.com/texiao/css3/18/ ...
- [python]初试页面抓取——抓取沪深股市交易龙虎榜数据
[python]抓取沪深股市交易龙虎榜数据 python 3.5.0下运行 没做自动建立files文件夹,需要手动在py文件目录下建立files文件夹后运行 #coding=utf-8 import ...
- ios 开发之单例模式
在iOS开发中,有很多地方都选择使用单例模式.有很多时候必须要创建一个对象,并且不能创建多个,用单例就为了防止创建多个对象.单例模式的意思就是某一个类有且只有一个实例.单例模式确保某一个类只有一个实例 ...
- iPhone被盗后续更新二:被换机!已取机!没扣住新机!怎么找新机呢?事发半年后跟进...
先说下情况 MEID/IMEI:3544 2706 9380 456 我的序列号:F17NL088G5MY 新的IMEI:3569 7606 5956 097 新的序列号:DNPNV69ZG5MY 我 ...
- PL/SQL重新编译包无反应
前几天碰到一个有趣的事情:早上同事执行一个包很久没有反应,就中断了执行,发邮件让我帮忙查看具体情况,我用PL/SQL Developer登录后,找到这个包的过程中发现这个包的图标有红色叉叉,也就是说这 ...
- JDK1.3安装出现/lib/ld-linux.so.2: bad ELF interpreter: No such file or directory Done.
今天是出道以来第一次安装JDK1.3,大学的时候接触的也已是JDK1.4,而且是在Red Hat Enterprise Linux Server release 6.6上,安装JDK1.3是由于软件组 ...