sklearn_随机森林random forest原理_乳腺癌分类器建模(推荐AAA)
python机器学习-乳腺癌细胞挖掘(博主亲自录制视频)
https://study.163.com/course/introduction.htm?courseId=1005269003&utm_campaign=commission&utm_source=cp-400000000398149&utm_medium=share
Toby,项目合作QQ:231469242
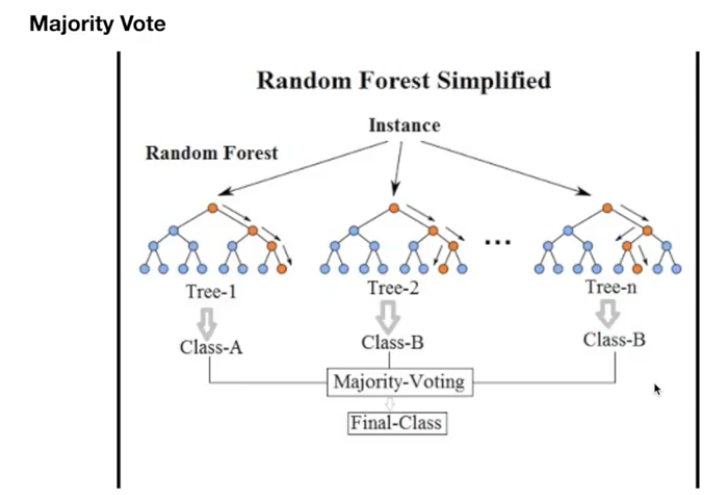
随机森林就是由多个决策树组合而成的投票机制。
理解随机森林,要先了解决策树
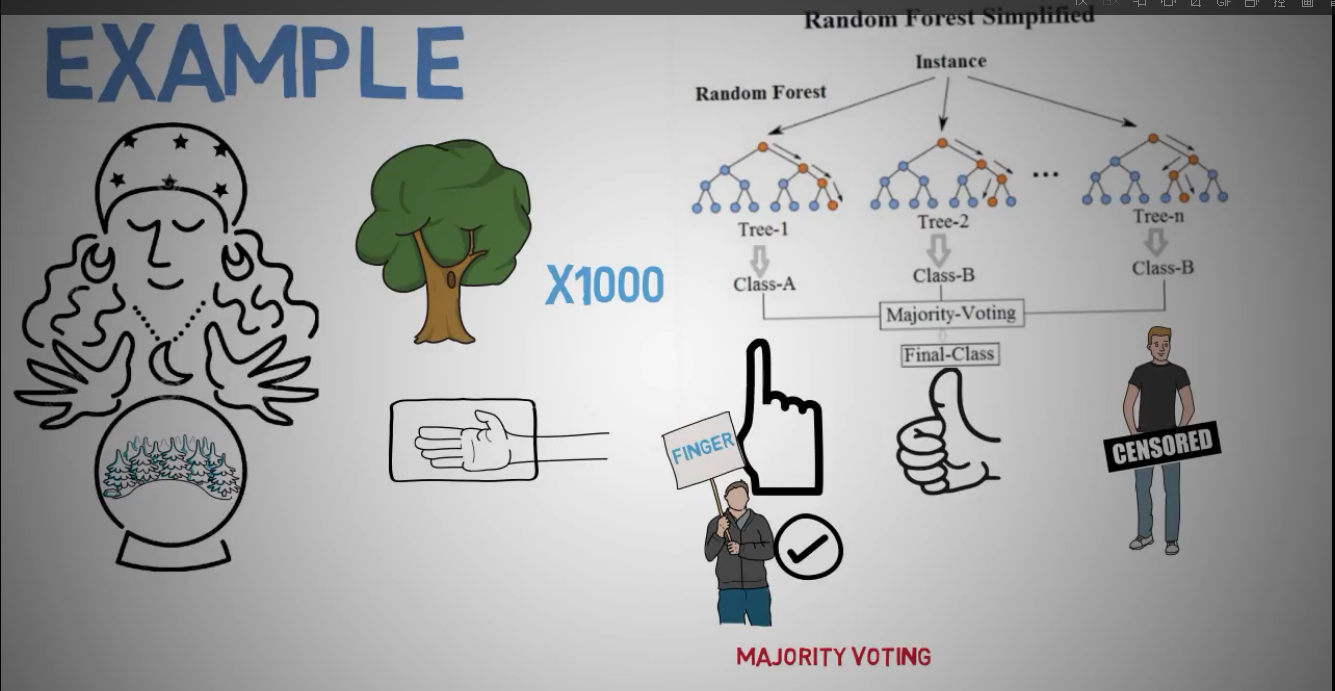
随机森林是一个集成机器学习算法

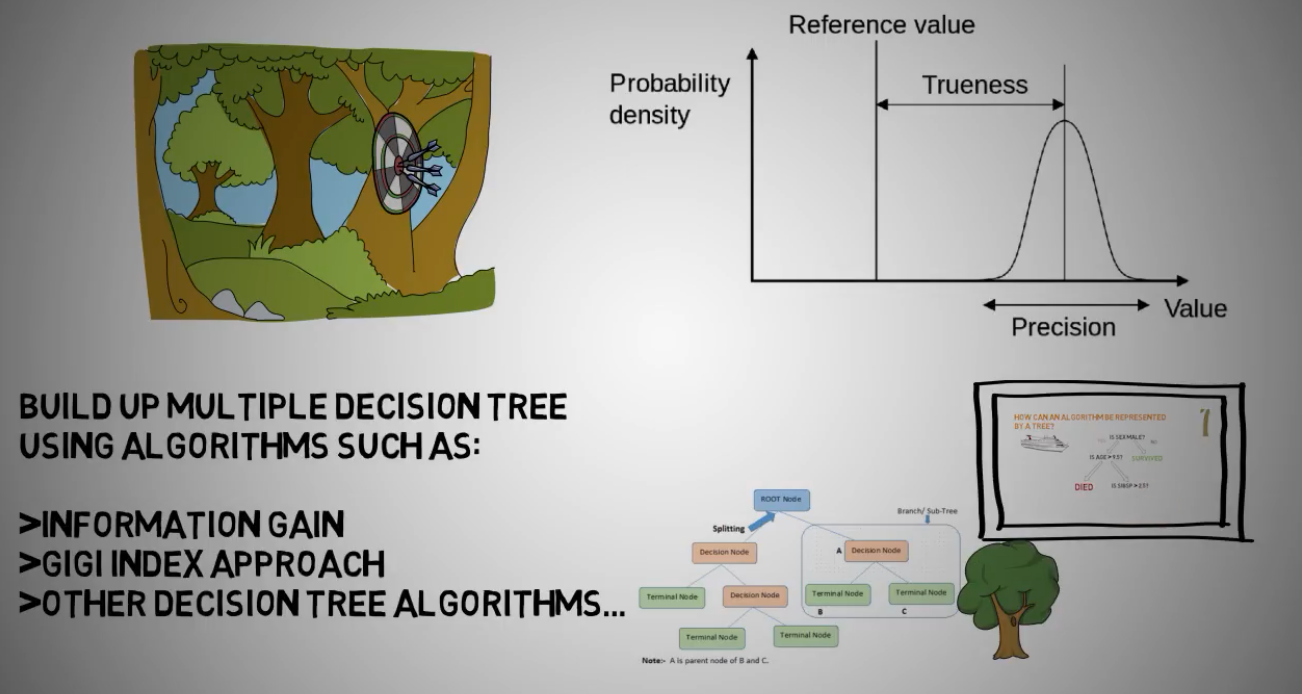
构建多个树的算法:
信息增益
GINI系数
其它决策树算法
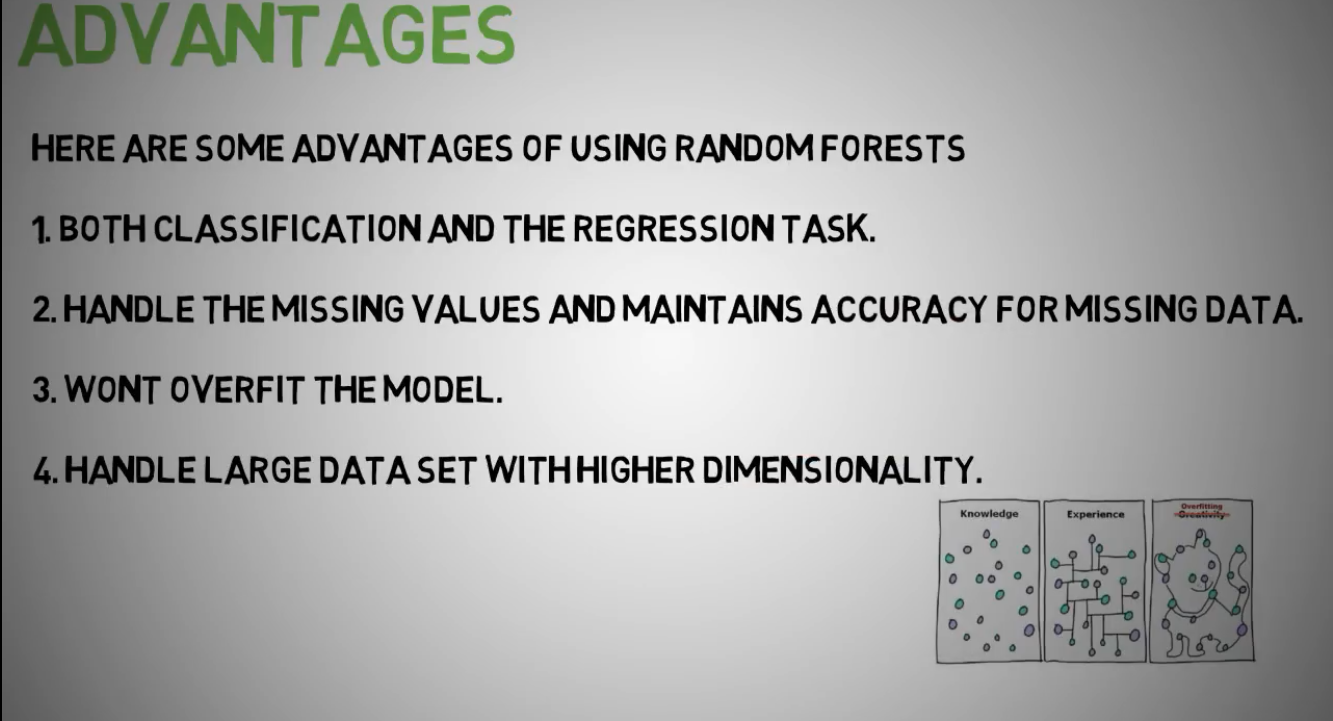
随机森林优点:
1.可用于分类和回归
2.处理缺失值,并不影响准确性
3.模型不会过渡拟合
4.可用于高维度,大数据
5.同盾用的就是随机森林
随机森林缺点
1.分类效果很好,但回归效果更好
2.此算法是个黑箱,很难改动参数
3.高维度,少数据表现较差
4.不能像树一样可视化
5.耗时间长,CPU资源占用多

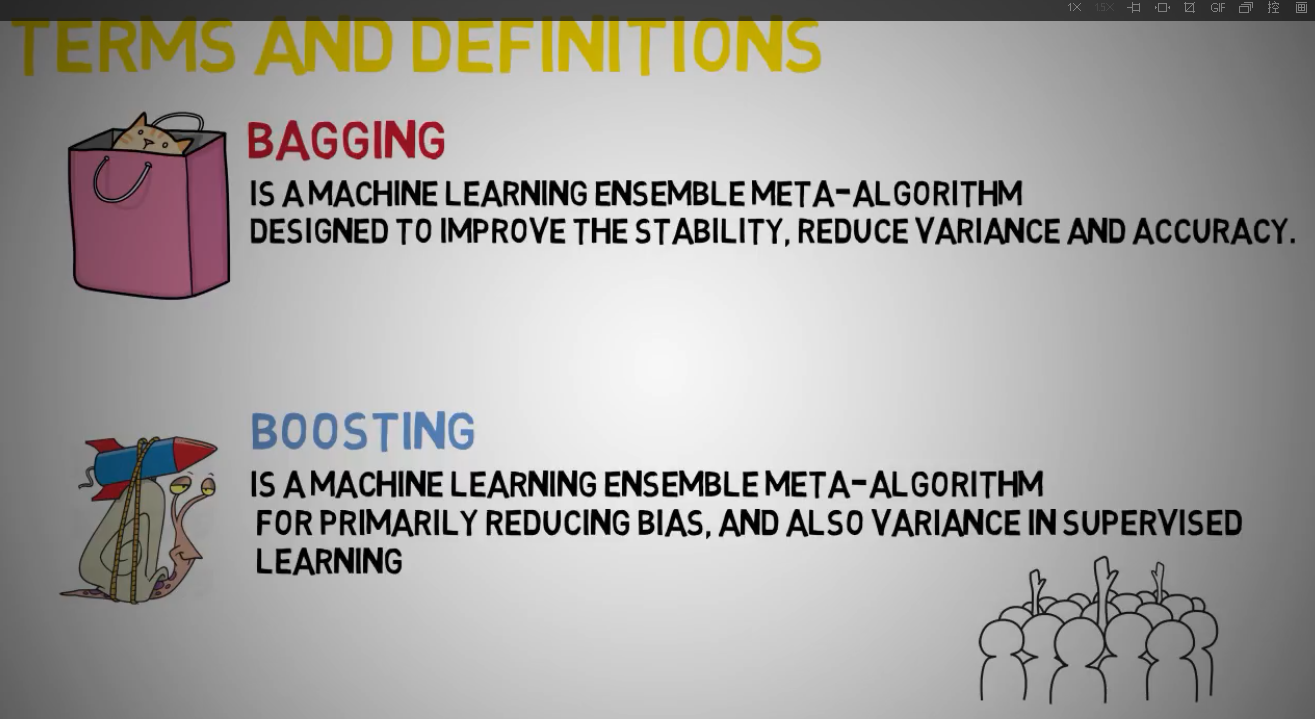
bagging是机器学习集成元算法,用于提高稳定性,减少方差和准确性
boosting是机器学习集成元算法,用于减少歧义,减少监督学习里方差
bagging是一种用来提高学习算法准确度的方法,这种方法通过构造一个预测函数系列,然后以一定的方式将它们组合成一个预测函数。Bagging要求“不稳定”(不稳定是指数据集的小的变动能够使得分类结果的显著的变动)的分类方法。比如:决策树,神经网络算法。
基本思想
算法
随机森林的应用
1.信贷公司对客户评分
2.医药疗效判断
3.购物车
4.股价分析

随机森林算法原理


树的分离函数
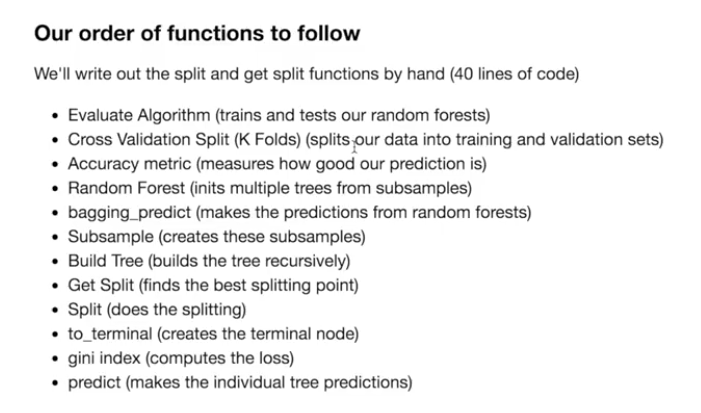
随机森林的一些参数:
最大深度
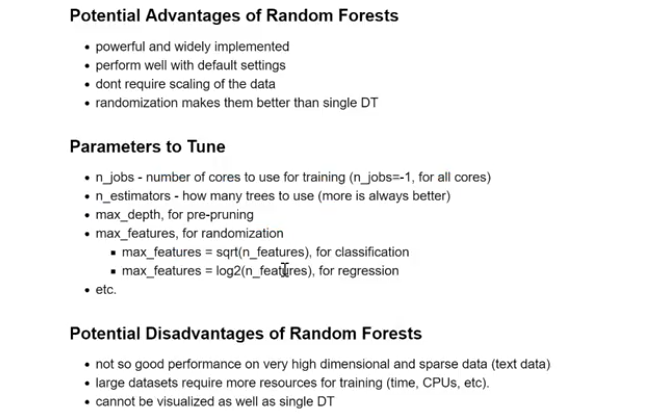
随机森林优点:
有效并被广泛使用,默认参数表现良好,不需正则化处理数据,蒙特卡洛随机处理效果比单个树更好
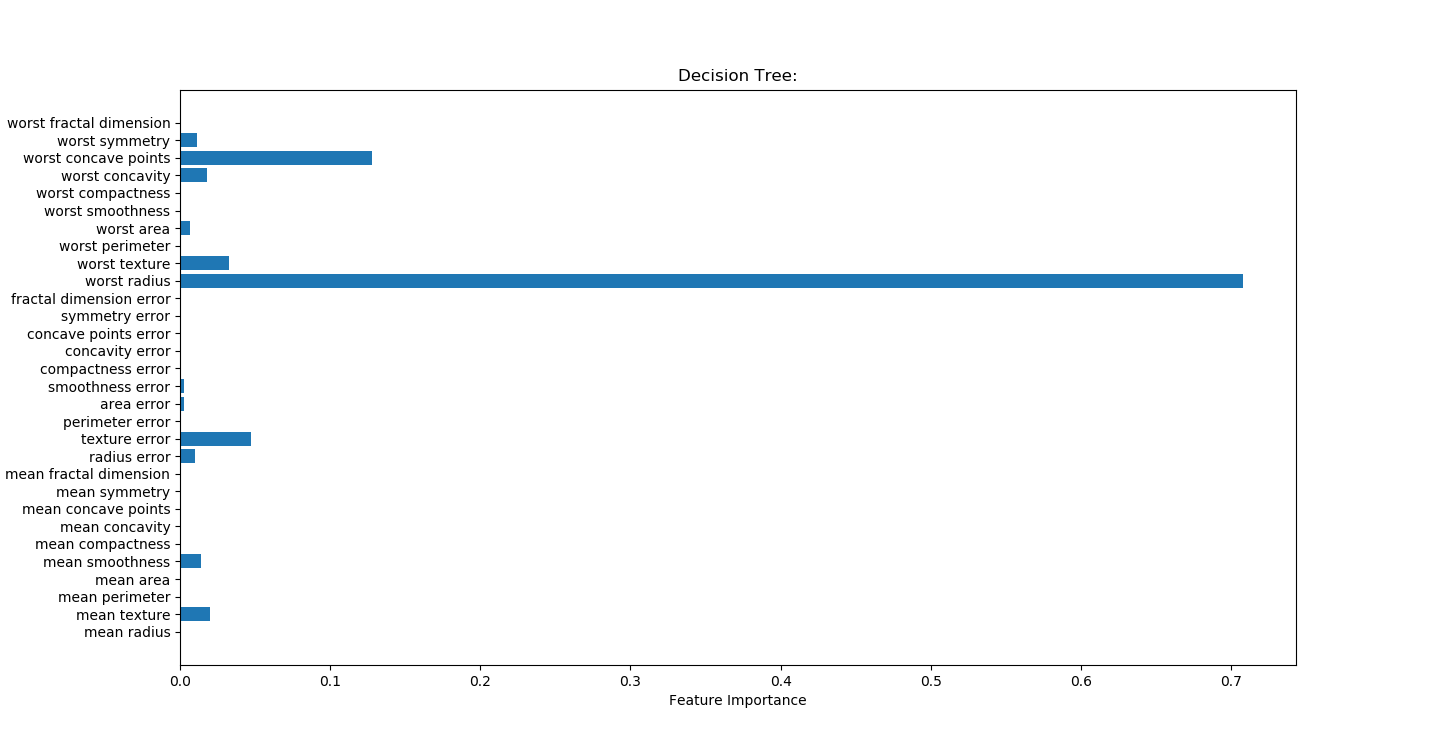
python代码测试中随机森林不仅准确性更高,而且强因子更准确
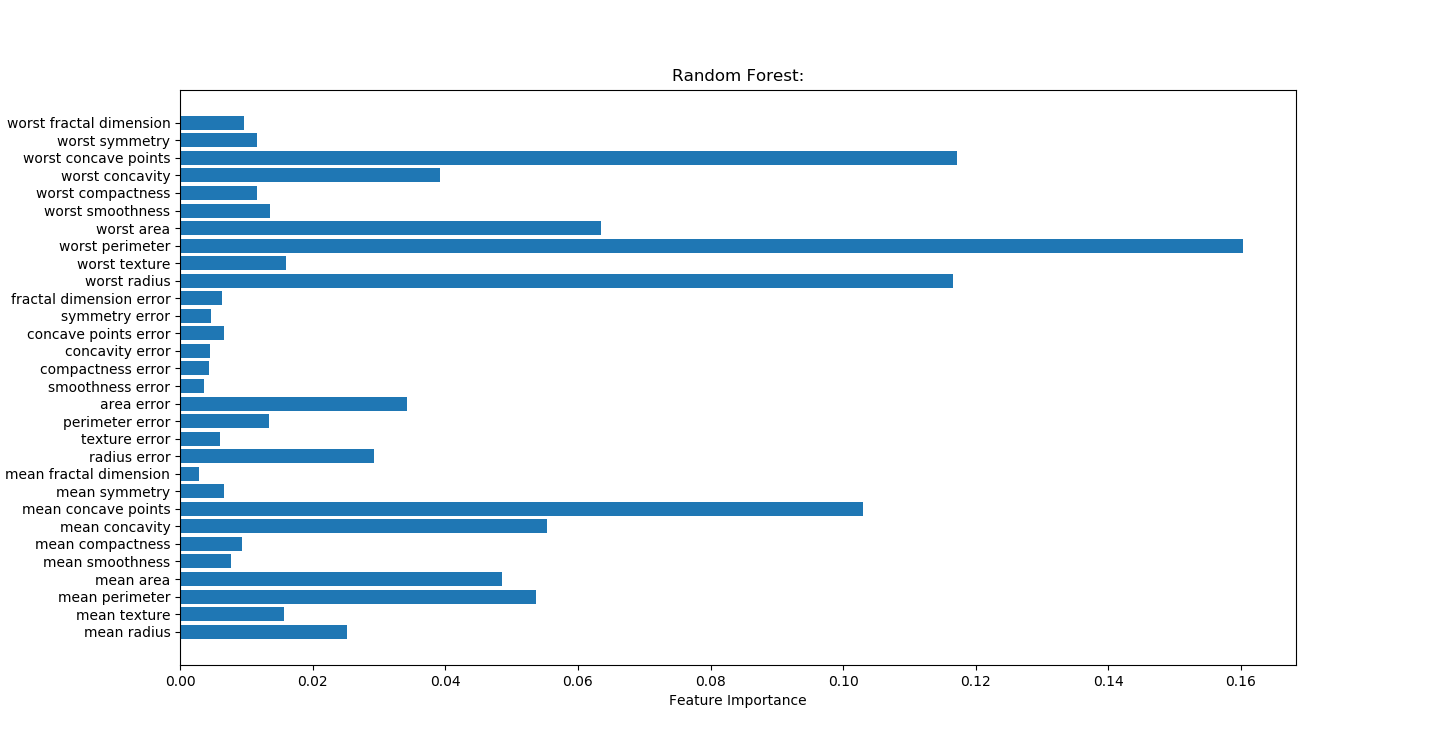
Random Forest
- # -*- coding: utf-8 -*-
- """
- Created on Sat Mar 31 09:30:24 2018
- @author: Toby,项目合作QQ:231469242
- """
- import numpy as np
- import matplotlib.pyplot as plt
- from sklearn.ensemble import RandomForestClassifier
- from sklearn.model_selection import train_test_split
- from sklearn.datasets import load_breast_cancer
- cancer=load_breast_cancer()
- x_train,x_test,y_train,y_test=train_test_split(cancer.data,cancer.target,random_state=0)
#n_estimators=100表示有树的个数
- forest=RandomForestClassifier(n_estimators=100,random_state=0) forest.fit(x_train,y_train) print("random forest:") print("accuracy on the training subset:{:.3f}".format(forest.score(x_train,y_train))) print("accuracy on the test subset:{:.3f}".format(forest.score(x_test,y_test))) print('Feature importances:{}'.format(forest.feature_importances_)) n_features=cancer.data.shape[1] plt.barh(range(n_features),forest.feature_importances_,align='center') plt.yticks(np.arange(n_features),cancer.feature_names) plt.title("Random Forest:") plt.xlabel('Feature Importance') plt.ylabel('Feature') plt.show()
决策树
- # -*- coding: utf-8 -*-
- """
- Created on Tue Mar 27 22:59:44 2018
- @author: Toby,项目合作QQ:231469242
- radius半径
- texture结构,灰度值标准差
- symmetry对称
- 决策树找出强因子
- worst radius
- worst symmetry
- worst texture
- texture error
- """
- import csv,pandas as pd
- import matplotlib.pyplot as plt
- import numpy as np
- import pydotplus
- from IPython.display import Image
- import graphviz
- from sklearn.tree import export_graphviz
- from sklearn.datasets import load_breast_cancer
- from sklearn.tree import DecisionTreeClassifier
- from sklearn.model_selection import train_test_split
- cancer=load_breast_cancer()
- featureNames=cancer.feature_names
- #random_state 相当于随机数种子
- X_train,x_test,y_train,y_test=train_test_split(cancer.data,cancer.target,stratify=cancer.target,random_state=42)
- list_average_accuracy=[]
- depth=range(1,30)
- for i in depth:
- #max_depth=4限制决策树深度可以降低算法复杂度,获取更精确值
- tree= DecisionTreeClassifier(max_depth=i,random_state=0)
- tree.fit(X_train,y_train)
- accuracy_training=tree.score(X_train,y_train)
- accuracy_test=tree.score(x_test,y_test)
- average_accuracy=(accuracy_training+accuracy_test)/2.0
- #print("average_accuracy:",average_accuracy)
- list_average_accuracy.append(average_accuracy)
- max_value=max(list_average_accuracy)
- #索引是0开头,结果要加1
- best_depth=list_average_accuracy.index(max_value)+1
- print("best_depth:",best_depth)
- best_tree= DecisionTreeClassifier(max_depth=best_depth,random_state=0)
- best_tree.fit(X_train,y_train)
- accuracy_training=best_tree.score(X_train,y_train)
- accuracy_test=best_tree.score(x_test,y_test)
- print("decision tree:")
- print("accuracy on the training subset:{:.3f}".format(best_tree.score(X_train,y_train)))
- print("accuracy on the test subset:{:.3f}".format(best_tree.score(x_test,y_test)))
- print('Feature importances:{}'.format(best_tree.feature_importances_))
- n_features=cancer.data.shape[1]
- plt.barh(range(n_features),best_tree.feature_importances_,align='center')
- plt.yticks(np.arange(n_features),cancer.feature_names)
- plt.title("Decision Tree:")
- plt.xlabel('Feature Importance')
- plt.ylabel('Feature')
- plt.show()
- '''
- print(cancer.DESCR)
- print(cancer.feature_names)
- print(cancer.target_names)
- print(cancer.data)
- print(type(cancer.data))
- print(cancer.data.shape)
- #可视化无法展示
- dot_data=export_graphviz(tree,out_file="cancertree.dot",class_names=['malignant','benign'],feature_names=cancer.feature_names,impurity=False,filled=True)
- graph = pydotplus.graph_from_dot_data(dot_data)
- Image(graph.create_png())
- #
- '''
对随机森林树的多少测试

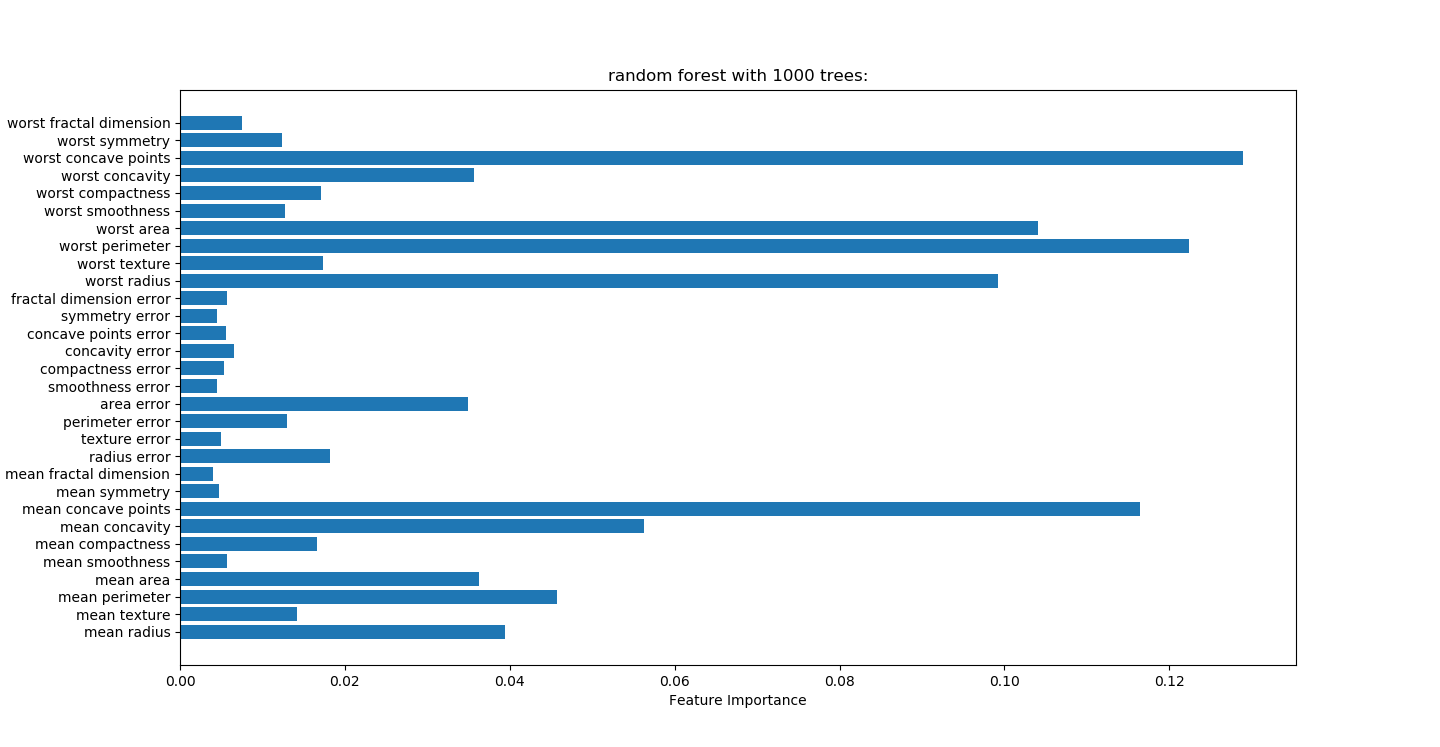
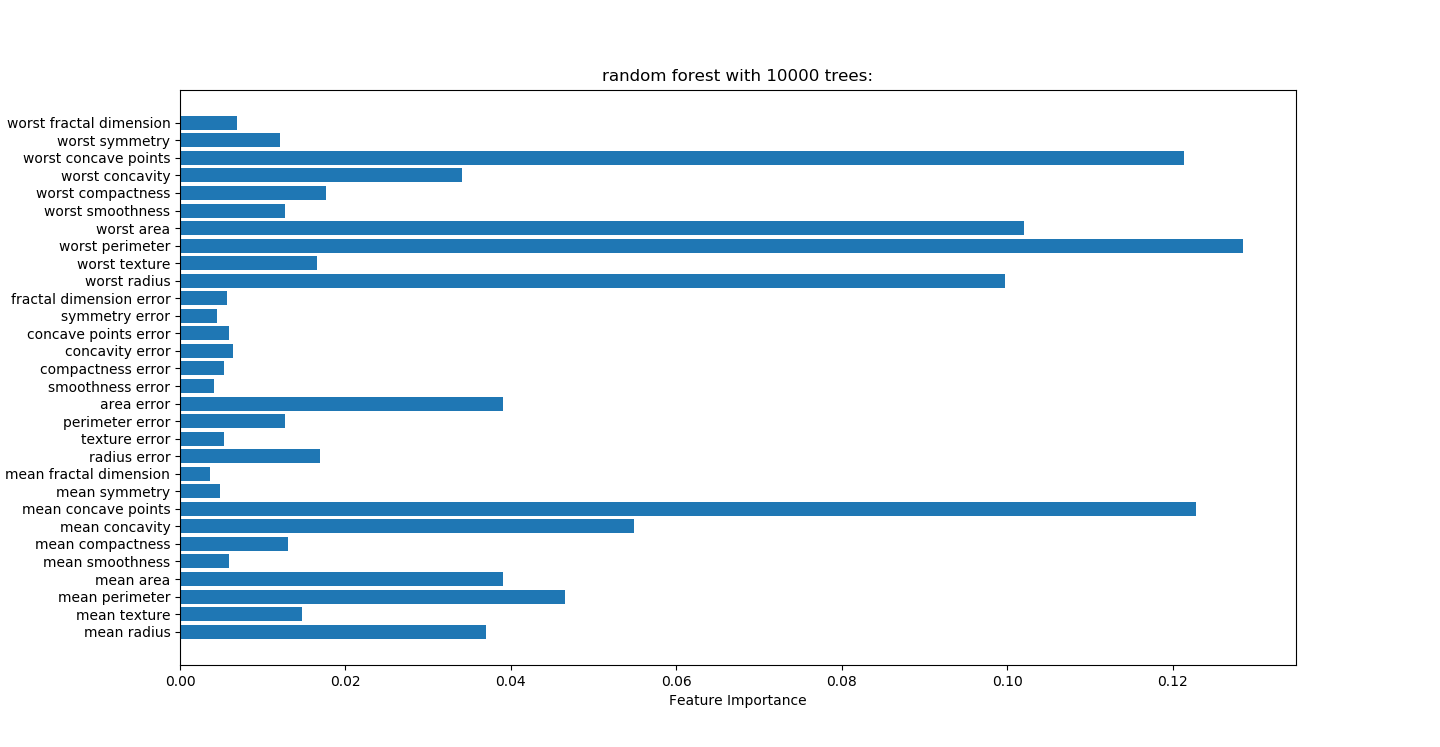
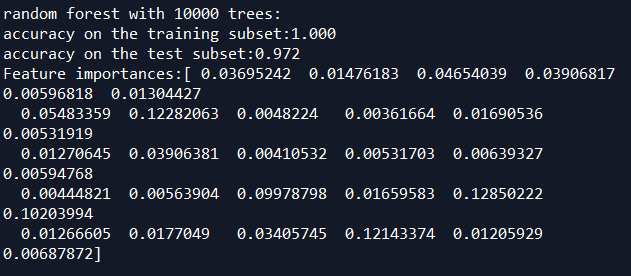
没有变量筛选准确度0.972
随机森林变量筛选
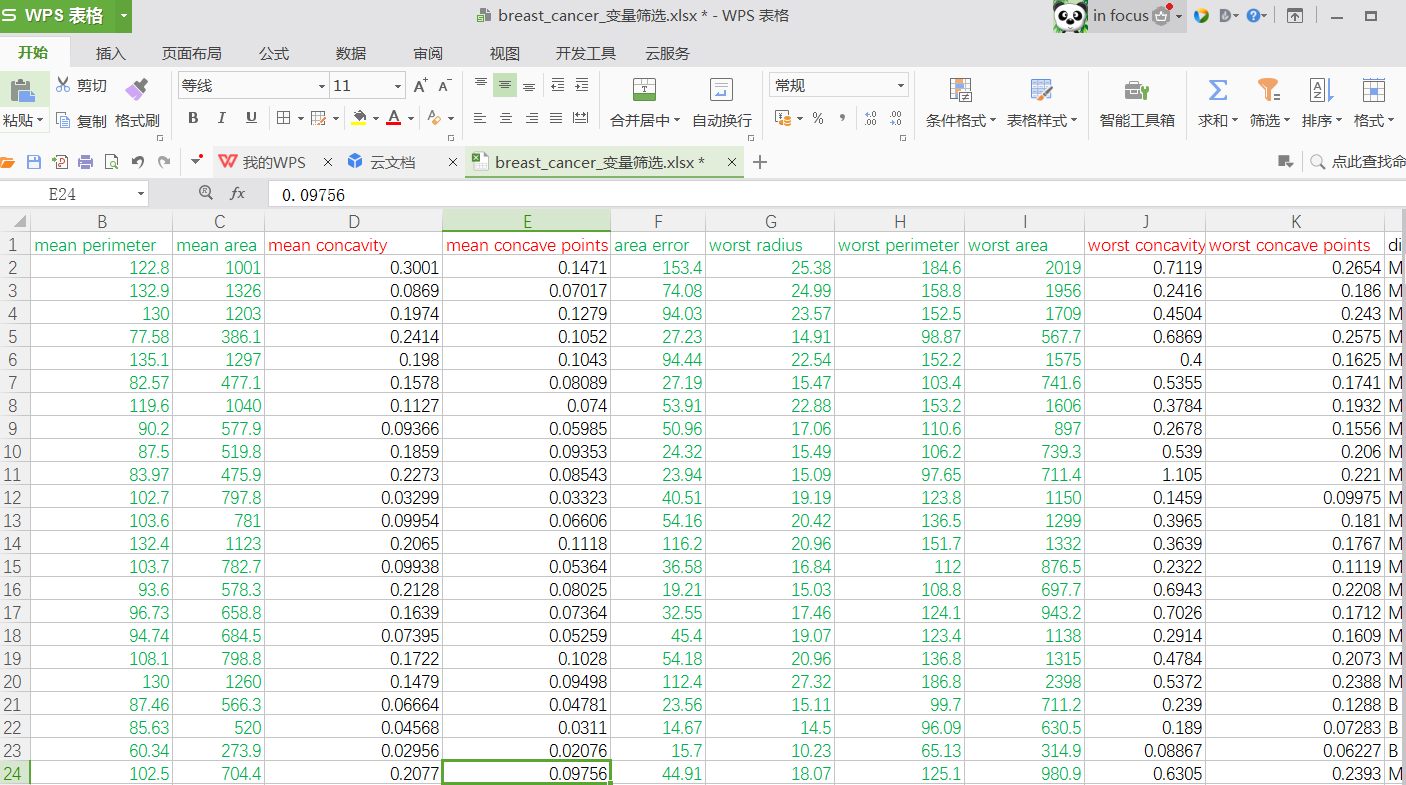
帅选后的乳腺癌数据
- # -*- coding: utf-8 -*-
- """
- Created on Sat Mar 31 09:30:24 2018
- @author: Administrator
- 随机森林不需要预处理数据
- """
- import pandas as pd
- from sklearn import metrics
- import numpy as np
- import matplotlib.pyplot as plt
- from sklearn.ensemble import RandomForestClassifier
- from sklearn.model_selection import train_test_split
- from sklearn.datasets import load_breast_cancer
- #读取文件
- readFileName="breast_cancer_变量筛选.xlsx"
- trees=10000
- #读取excel
- df=pd.read_excel(readFileName)
- # data为Excel前几列数据
- data=df[df.columns[:-1]]
- #标签为Excel最后一列数据
- target=df[df.columns[-1:]]
- #变量名
- feature_names=list(df.columns[:-1])
- x_train,x_test,y_train,y_test=train_test_split(data,target,random_state=0)
- #n_estimators表示树的个数,测试中100颗树足够
- forest=RandomForestClassifier(n_estimators=trees,random_state=0)
- forest.fit(x_train,y_train)
- print("random forest with %d trees:"%trees)
- print("accuracy on the training subset:{:.3f}".format(forest.score(x_train,y_train)))
- print("accuracy on the test subset:{:.3f}".format(forest.score(x_test,y_test)))
- print('Feature importances:{}'.format(forest.feature_importances_))
- n_features=data.shape[1]
- plt.barh(range(n_features),forest.feature_importances_,align='center')
- plt.yticks(np.arange(n_features),feature_names)
- plt.title("random forest with %d trees:"%trees)
- plt.xlabel('Feature Importance')
- plt.ylabel('Feature')
- plt.show()
- '''
- accuracy on the training subset:1.000
- accuracy on the test subset:0.972
- '''
筛选出最佳10个变量后建模,准确率反而没有不筛选高,说明蒙特卡洛算法强大和优越性。建议不要做变量筛选,直接保留原汁原味变量,让蒙特卡洛自己去模拟。
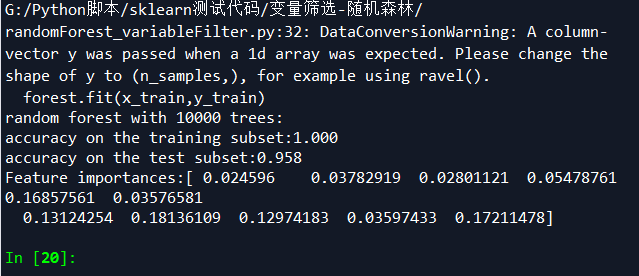
筛选变量VS不筛选变量:
筛选变量准确性,1.0,0.958
不筛选变量准确性:1.0,0.972

随机森林调参
https://www.cnblogs.com/pinard/p/6160412.html
在Bagging与随机森林算法原理小结中,我们对随机森林(Random Forest, 以下简称RF)的原理做了总结。本文就从实践的角度对RF做一个总结。重点讲述scikit-learn中RF的调参注意事项,以及和GBDT调参的异同点。
1. scikit-learn随机森林类库概述
在scikit-learn中,RF的分类类是RandomForestClassifier,回归类是RandomForestRegressor。当然RF的变种Extra Trees也有, 分类类ExtraTreesClassifier,回归类ExtraTreesRegressor。由于RF和Extra Trees的区别较小,调参方法基本相同,本文只关注于RF的调参。
和GBDT的调参类似,RF需要调参的参数也包括两部分,第一部分是Bagging框架的参数,第二部分是CART决策树的参数。下面我们就对这些参数做一个介绍。
2. RF框架参数
首先我们关注于RF的Bagging框架的参数。这里可以和GBDT对比来学习。在scikit-learn 梯度提升树(GBDT)调参小结中我们对GBDT的框架参数做了介绍。GBDT的框架参数比较多,重要的有最大迭代器个数,步长和子采样比例,调参起来比较费力。但是RF则比较简单,这是因为bagging框架里的各个弱学习器之间是没有依赖关系的,这减小的调参的难度。换句话说,达到同样的调参效果,RF调参时间要比GBDT少一些。
下面我来看看RF重要的Bagging框架的参数,由于RandomForestClassifier和RandomForestRegressor参数绝大部分相同,这里会将它们一起讲,不同点会指出。
1) n_estimators: 也就是弱学习器的最大迭代次数,或者说最大的弱学习器的个数。一般来说n_estimators太小,容易欠拟合,n_estimators太大,计算量会太大,并且n_estimators到一定的数量后,再增大n_estimators获得的模型提升会很小,所以一般选择一个适中的数值。默认是100。
2) oob_score :即是否采用袋外样本来评估模型的好坏。默认识False。个人推荐设置为True,因为袋外分数反应了一个模型拟合后的泛化能力。
3) criterion: 即CART树做划分时对特征的评价标准。分类模型和回归模型的损失函数是不一样的。分类RF对应的CART分类树默认是基尼系数gini,另一个可选择的标准是信息增益。回归RF对应的CART回归树默认是均方差mse,另一个可以选择的标准是绝对值差mae。一般来说选择默认的标准就已经很好的。
从上面可以看出, RF重要的框架参数比较少,主要需要关注的是 n_estimators,即RF最大的决策树个数。
3. RF决策树参数
下面我们再来看RF的决策树参数,它要调参的参数基本和GBDT相同,如下:
1) RF划分时考虑的最大特征数max_features: 可以使用很多种类型的值,默认是"auto",意味着划分时最多考虑N−−√N个特征;如果是"log2"意味着划分时最多考虑log2Nlog2N个特征;如果是"sqrt"或者"auto"意味着划分时最多考虑N−−√N个特征。如果是整数,代表考虑的特征绝对数。如果是浮点数,代表考虑特征百分比,即考虑(百分比xN)取整后的特征数。其中N为样本总特征数。一般我们用默认的"auto"就可以了,如果特征数非常多,我们可以灵活使用刚才描述的其他取值来控制划分时考虑的最大特征数,以控制决策树的生成时间。
2) 决策树最大深度max_depth: 默认可以不输入,如果不输入的话,决策树在建立子树的时候不会限制子树的深度。一般来说,数据少或者特征少的时候可以不管这个值。如果模型样本量多,特征也多的情况下,推荐限制这个最大深度,具体的取值取决于数据的分布。常用的可以取值10-100之间。
3) 内部节点再划分所需最小样本数min_samples_split: 这个值限制了子树继续划分的条件,如果某节点的样本数少于min_samples_split,则不会继续再尝试选择最优特征来进行划分。 默认是2.如果样本量不大,不需要管这个值。如果样本量数量级非常大,则推荐增大这个值。
4) 叶子节点最少样本数min_samples_leaf: 这个值限制了叶子节点最少的样本数,如果某叶子节点数目小于样本数,则会和兄弟节点一起被剪枝。 默认是1,可以输入最少的样本数的整数,或者最少样本数占样本总数的百分比。如果样本量不大,不需要管这个值。如果样本量数量级非常大,则推荐增大这个值。
5)叶子节点最小的样本权重和min_weight_fraction_leaf:这个值限制了叶子节点所有样本权重和的最小值,如果小于这个值,则会和兄弟节点一起被剪枝。 默认是0,就是不考虑权重问题。一般来说,如果我们有较多样本有缺失值,或者分类树样本的分布类别偏差很大,就会引入样本权重,这时我们就要注意这个值了。
6) 最大叶子节点数max_leaf_nodes: 通过限制最大叶子节点数,可以防止过拟合,默认是"None”,即不限制最大的叶子节点数。如果加了限制,算法会建立在最大叶子节点数内最优的决策树。如果特征不多,可以不考虑这个值,但是如果特征分成多的话,可以加以限制,具体的值可以通过交叉验证得到。
7) 节点划分最小不纯度min_impurity_split: 这个值限制了决策树的增长,如果某节点的不纯度(基于基尼系数,均方差)小于这个阈值,则该节点不再生成子节点。即为叶子节点 。一般不推荐改动默认值1e-7。
上面决策树参数中最重要的包括最大特征数max_features, 最大深度max_depth, 内部节点再划分所需最小样本数min_samples_split和叶子节点最少样本数min_samples_leaf。
4.RF调参实例
这里仍然使用GBDT调参时同样的数据集来做RF调参的实例,数据的下载地址在这。本例我们采用袋外分数来评估我们模型的好坏。
完整代码参见我的github:https://github.com/ljpzzz/machinelearning/blob/master/ensemble-learning/random_forest_classifier.ipynb
首先,我们载入需要的类库:

- import pandas as pd
- import numpy as np
- from sklearn.ensemble import RandomForestClassifier
- from sklearn.grid_search import GridSearchCV
- from sklearn import cross_validation, metrics
- import matplotlib.pylab as plt
- %matplotlib inline

接着,我们把解压的数据用下面的代码载入,顺便看看数据的类别分布。
- train = pd.read_csv('train_modified.csv')
- target='Disbursed' # Disbursed的值就是二元分类的输出
- IDcol = 'ID'
- train['Disbursed'].value_counts()
可以看到类别输出如下,也就是类别0的占大多数。
0 19680
1 320
Name: Disbursed, dtype: int64
接着我们选择好样本特征和类别输出。
- x_columns = [x for x in train.columns if x not in [target, IDcol]]
- X = train[x_columns]
- y = train['Disbursed']
不管任何参数,都用默认的,我们拟合下数据看看:
- rf0 = RandomForestClassifier(oob_score=True, random_state=10)
- rf0.fit(X,y)
- print rf0.oob_score_
- y_predprob = rf0.predict_proba(X)[:,1]
- print "AUC Score (Train): %f" % metrics.roc_auc_score(y, y_predprob)
输出如下,可见袋外分数已经很高,而且AUC分数也很高。相对于GBDT的默认参数输出,RF的默认参数拟合效果对本例要好一些。
0.98005
AUC Score (Train): 0.999833
我们首先对n_estimators进行网格搜索:

- param_test1 = {'n_estimators':range(10,71,10)}
- gsearch1 = GridSearchCV(estimator = RandomForestClassifier(min_samples_split=100,
- min_samples_leaf=20,max_depth=8,max_features='sqrt' ,random_state=10),
- param_grid = param_test1, scoring='roc_auc',cv=5)
- gsearch1.fit(X,y)
- gsearch1.grid_scores_, gsearch1.best_params_, gsearch1.best_score_

输出结果如下:
([mean: 0.80681, std: 0.02236, params: {'n_estimators': 10},
mean: 0.81600, std: 0.03275, params: {'n_estimators': 20},
mean: 0.81818, std: 0.03136, params: {'n_estimators': 30},
mean: 0.81838, std: 0.03118, params: {'n_estimators': 40},
mean: 0.82034, std: 0.03001, params: {'n_estimators': 50},
mean: 0.82113, std: 0.02966, params: {'n_estimators': 60},
mean: 0.81992, std: 0.02836, params: {'n_estimators': 70}],
{'n_estimators': 60},
0.8211334476626017)
这样我们得到了最佳的弱学习器迭代次数,接着我们对决策树最大深度max_depth和内部节点再划分所需最小样本数min_samples_split进行网格搜索。

- param_test2 = {'max_depth':range(3,14,2), 'min_samples_split':range(50,201,20)}
- gsearch2 = GridSearchCV(estimator = RandomForestClassifier(n_estimators= 60,
- min_samples_leaf=20,max_features='sqrt' ,oob_score=True, random_state=10),
- param_grid = param_test2, scoring='roc_auc',iid=False, cv=5)
- gsearch2.fit(X,y)
- gsearch2.grid_scores_, gsearch2.best_params_, gsearch2.best_score_

输出如下:
([mean: 0.79379, std: 0.02347, params: {'min_samples_split': 50, 'max_depth': 3},
mean: 0.79339, std: 0.02410, params: {'min_samples_split': 70, 'max_depth': 3},
mean: 0.79350, std: 0.02462, params: {'min_samples_split': 90, 'max_depth': 3},
mean: 0.79367, std: 0.02493, params: {'min_samples_split': 110, 'max_depth': 3},
mean: 0.79387, std: 0.02521, params: {'min_samples_split': 130, 'max_depth': 3},
mean: 0.79373, std: 0.02524, params: {'min_samples_split': 150, 'max_depth': 3},
mean: 0.79378, std: 0.02532, params: {'min_samples_split': 170, 'max_depth': 3},
mean: 0.79349, std: 0.02542, params: {'min_samples_split': 190, 'max_depth': 3},
mean: 0.80960, std: 0.02602, params: {'min_samples_split': 50, 'max_depth': 5},
mean: 0.80920, std: 0.02629, params: {'min_samples_split': 70, 'max_depth': 5},
mean: 0.80888, std: 0.02522, params: {'min_samples_split': 90, 'max_depth': 5},
mean: 0.80923, std: 0.02777, params: {'min_samples_split': 110, 'max_depth': 5},
mean: 0.80823, std: 0.02634, params: {'min_samples_split': 130, 'max_depth': 5},
mean: 0.80801, std: 0.02637, params: {'min_samples_split': 150, 'max_depth': 5},
mean: 0.80792, std: 0.02685, params: {'min_samples_split': 170, 'max_depth': 5},
mean: 0.80771, std: 0.02587, params: {'min_samples_split': 190, 'max_depth': 5},
mean: 0.81688, std: 0.02996, params: {'min_samples_split': 50, 'max_depth': 7},
mean: 0.81872, std: 0.02584, params: {'min_samples_split': 70, 'max_depth': 7},
mean: 0.81501, std: 0.02857, params: {'min_samples_split': 90, 'max_depth': 7},
mean: 0.81476, std: 0.02552, params: {'min_samples_split': 110, 'max_depth': 7},
mean: 0.81557, std: 0.02791, params: {'min_samples_split': 130, 'max_depth': 7},
mean: 0.81459, std: 0.02905, params: {'min_samples_split': 150, 'max_depth': 7},
mean: 0.81601, std: 0.02808, params: {'min_samples_split': 170, 'max_depth': 7},
mean: 0.81704, std: 0.02757, params: {'min_samples_split': 190, 'max_depth': 7},
mean: 0.82090, std: 0.02665, params: {'min_samples_split': 50, 'max_depth': 9},
mean: 0.81908, std: 0.02527, params: {'min_samples_split': 70, 'max_depth': 9},
mean: 0.82036, std: 0.02422, params: {'min_samples_split': 90, 'max_depth': 9},
mean: 0.81889, std: 0.02927, params: {'min_samples_split': 110, 'max_depth': 9},
mean: 0.81991, std: 0.02868, params: {'min_samples_split': 130, 'max_depth': 9},
mean: 0.81788, std: 0.02436, params: {'min_samples_split': 150, 'max_depth': 9},
mean: 0.81898, std: 0.02588, params: {'min_samples_split': 170, 'max_depth': 9},
mean: 0.81746, std: 0.02716, params: {'min_samples_split': 190, 'max_depth': 9},
mean: 0.82395, std: 0.02454, params: {'min_samples_split': 50, 'max_depth': 11},
mean: 0.82380, std: 0.02258, params: {'min_samples_split': 70, 'max_depth': 11},
mean: 0.81953, std: 0.02552, params: {'min_samples_split': 90, 'max_depth': 11},
mean: 0.82254, std: 0.02366, params: {'min_samples_split': 110, 'max_depth': 11},
mean: 0.81950, std: 0.02768, params: {'min_samples_split': 130, 'max_depth': 11},
mean: 0.81887, std: 0.02636, params: {'min_samples_split': 150, 'max_depth': 11},
mean: 0.81910, std: 0.02734, params: {'min_samples_split': 170, 'max_depth': 11},
mean: 0.81564, std: 0.02622, params: {'min_samples_split': 190, 'max_depth': 11},
mean: 0.82291, std: 0.02092, params: {'min_samples_split': 50, 'max_depth': 13},
mean: 0.82177, std: 0.02513, params: {'min_samples_split': 70, 'max_depth': 13},
mean: 0.82415, std: 0.02480, params: {'min_samples_split': 90, 'max_depth': 13},
mean: 0.82420, std: 0.02417, params: {'min_samples_split': 110, 'max_depth': 13},
mean: 0.82209, std: 0.02481, params: {'min_samples_split': 130, 'max_depth': 13},
mean: 0.81852, std: 0.02227, params: {'min_samples_split': 150, 'max_depth': 13},
mean: 0.81955, std: 0.02885, params: {'min_samples_split': 170, 'max_depth': 13},
mean: 0.82092, std: 0.02600, params: {'min_samples_split': 190, 'max_depth': 13}],
{'max_depth': 13, 'min_samples_split': 110},
0.8242016800050813)
我们看看我们现在模型的袋外分数:
- rf1 = RandomForestClassifier(n_estimators= 60, max_depth=13, min_samples_split=110,
- min_samples_leaf=20,max_features='sqrt' ,oob_score=True, random_state=10)
- rf1.fit(X,y)
- print rf1.oob_score_
输出结果为:
0.984
可见此时我们的袋外分数有一定的提高。也就是时候模型的泛化能力增强了。
对于内部节点再划分所需最小样本数min_samples_split,我们暂时不能一起定下来,因为这个还和决策树其他的参数存在关联。下面我们再对内部节点再划分所需最小样本数min_samples_split和叶子节点最少样本数min_samples_leaf一起调参。

- param_test3 = {'min_samples_split':range(80,150,20), 'min_samples_leaf':range(10,60,10)}
- gsearch3 = GridSearchCV(estimator = RandomForestClassifier(n_estimators= 60, max_depth=13,
- max_features='sqrt' ,oob_score=True, random_state=10),
- param_grid = param_test3, scoring='roc_auc',iid=False, cv=5)
- gsearch3.fit(X,y)
- gsearch3.grid_scores_, gsearch3.best_params_, gsearch3.best_score_

输出如下:
([mean: 0.82093, std: 0.02287, params: {'min_samples_split': 80, 'min_samples_leaf': 10},
mean: 0.81913, std: 0.02141, params: {'min_samples_split': 100, 'min_samples_leaf': 10},
mean: 0.82048, std: 0.02328, params: {'min_samples_split': 120, 'min_samples_leaf': 10},
mean: 0.81798, std: 0.02099, params: {'min_samples_split': 140, 'min_samples_leaf': 10},
mean: 0.82094, std: 0.02535, params: {'min_samples_split': 80, 'min_samples_leaf': 20},
mean: 0.82097, std: 0.02327, params: {'min_samples_split': 100, 'min_samples_leaf': 20},
mean: 0.82487, std: 0.02110, params: {'min_samples_split': 120, 'min_samples_leaf': 20},
mean: 0.82169, std: 0.02406, params: {'min_samples_split': 140, 'min_samples_leaf': 20},
mean: 0.82352, std: 0.02271, params: {'min_samples_split': 80, 'min_samples_leaf': 30},
mean: 0.82164, std: 0.02381, params: {'min_samples_split': 100, 'min_samples_leaf': 30},
mean: 0.82070, std: 0.02528, params: {'min_samples_split': 120, 'min_samples_leaf': 30},
mean: 0.82141, std: 0.02508, params: {'min_samples_split': 140, 'min_samples_leaf': 30},
mean: 0.82278, std: 0.02294, params: {'min_samples_split': 80, 'min_samples_leaf': 40},
mean: 0.82141, std: 0.02547, params: {'min_samples_split': 100, 'min_samples_leaf': 40},
mean: 0.82043, std: 0.02724, params: {'min_samples_split': 120, 'min_samples_leaf': 40},
mean: 0.82162, std: 0.02348, params: {'min_samples_split': 140, 'min_samples_leaf': 40},
mean: 0.82225, std: 0.02431, params: {'min_samples_split': 80, 'min_samples_leaf': 50},
mean: 0.82225, std: 0.02431, params: {'min_samples_split': 100, 'min_samples_leaf': 50},
mean: 0.81890, std: 0.02458, params: {'min_samples_split': 120, 'min_samples_leaf': 50},
mean: 0.81917, std: 0.02528, params: {'min_samples_split': 140, 'min_samples_leaf': 50}],
{'min_samples_leaf': 20, 'min_samples_split': 120},
0.8248650279471544)
最后我们再对最大特征数max_features做调参:

- param_test4 = {'max_features':range(3,11,2)}
- gsearch4 = GridSearchCV(estimator = RandomForestClassifier(n_estimators= 60, max_depth=13, min_samples_split=120,
- min_samples_leaf=20 ,oob_score=True, random_state=10),
- param_grid = param_test4, scoring='roc_auc',iid=False, cv=5)
- gsearch4.fit(X,y)
- gsearch4.grid_scores_, gsearch4.best_params_, gsearch4.best_score_

输出如下:
([mean: 0.81981, std: 0.02586, params: {'max_features': 3},
mean: 0.81639, std: 0.02533, params: {'max_features': 5},
mean: 0.82487, std: 0.02110, params: {'max_features': 7},
mean: 0.81704, std: 0.02209, params: {'max_features': 9}],
{'max_features': 7},
0.8248650279471544)
用我们搜索到的最佳参数,我们再看看最终的模型拟合:
- rf2 = RandomForestClassifier(n_estimators= 60, max_depth=13, min_samples_split=120,
- min_samples_leaf=20,max_features=7 ,oob_score=True, random_state=10)
- rf2.fit(X,y)
- print rf2.oob_score_
此时的输出为:
0.984
可见此时模型的袋外分数基本没有提高,主要原因是0.984已经是一个很高的袋外分数了,如果想进一步需要提高模型的泛化能力,我们需要更多的数据。
以上就是RF调参的一个总结,希望可以帮到朋友们。
信用评分系统应用
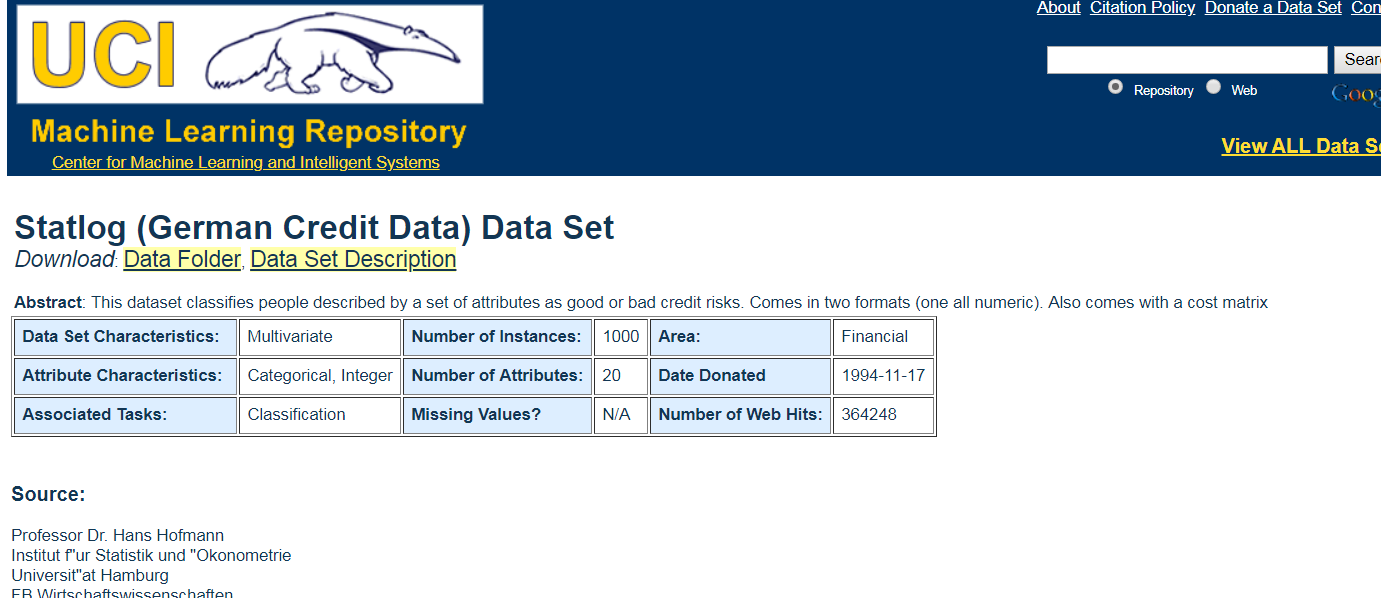
http://archive.ics.uci.edu/ml/datasets/Statlog+(German+Credit+Data)
account balance 账户余额
duration of credit

Data Set Information:
Two datasets are provided. the original dataset, in the form provided by Prof. Hofmann, contains categorical/symbolic attributes and is in the file "german.data".
For algorithms that need numerical attributes, Strathclyde University produced the file "german.data-numeric". This file has been edited and several indicator variables added to make it suitable for algorithms which cannot cope with categorical variables. Several attributes that are ordered categorical (such as attribute 17) have been coded as integer. This was the form used by StatLog.
This dataset requires use of a cost matrix (see below)
..... 1 2
----------------------------
1 0 1
-----------------------
2 5 0
(1 = Good, 2 = Bad)
The rows represent the actual classification and the columns the predicted classification.
It is worse to class a customer as good when they are bad (5), than it is to class a customer as bad when they are good (1).
Attribute Information:
Attribute 1: (qualitative)
Status of existing checking account
A11 : ... < 0 DM
A12 : 0 <= ... < 200 DM
A13 : ... >= 200 DM / salary assignments for at least 1 year
A14 : no checking account
Attribute 2: (numerical)
Duration in month
Attribute 3: (qualitative)
Credit history
A30 : no credits taken/ all credits paid back duly
A31 : all credits at this bank paid back duly
A32 : existing credits paid back duly till now
A33 : delay in paying off in the past
A34 : critical account/ other credits existing (not at this bank)
Attribute 4: (qualitative)
Purpose
A40 : car (new)
A41 : car (used)
A42 : furniture/equipment
A43 : radio/television
A44 : domestic appliances
A45 : repairs
A46 : education
A47 : (vacation - does not exist?)
A48 : retraining
A49 : business
A410 : others
Attribute 5: (numerical)
Credit amount
Attibute 6: (qualitative)
Savings account/bonds
A61 : ... < 100 DM
A62 : 100 <= ... < 500 DM
A63 : 500 <= ... < 1000 DM
A64 : .. >= 1000 DM
A65 : unknown/ no savings account
Attribute 7: (qualitative)
Present employment since
A71 : unemployed
A72 : ... < 1 year
A73 : 1 <= ... < 4 years
A74 : 4 <= ... < 7 years
A75 : .. >= 7 years
Attribute 8: (numerical)
Installment rate in percentage of disposable income
Attribute 9: (qualitative)
Personal status and sex
A91 : male : divorced/separated
A92 : female : divorced/separated/married
A93 : male : single
A94 : male : married/widowed
A95 : female : single
Attribute 10: (qualitative)
Other debtors / guarantors
A101 : none
A102 : co-applicant
A103 : guarantor
Attribute 11: (numerical)
Present residence since
Attribute 12: (qualitative)
Property
A121 : real estate
A122 : if not A121 : building society savings agreement/ life insurance
A123 : if not A121/A122 : car or other, not in attribute 6
A124 : unknown / no property
Attribute 13: (numerical)
Age in years
Attribute 14: (qualitative)
Other installment plans
A141 : bank
A142 : stores
A143 : none
Attribute 15: (qualitative)
Housing
A151 : rent
A152 : own
A153 : for free
Attribute 16: (numerical)
Number of existing credits at this bank
Attribute 17: (qualitative)
Job
A171 : unemployed/ unskilled - non-resident
A172 : unskilled - resident
A173 : skilled employee / official
A174 : management/ self-employed/
highly qualified employee/ officer
Attribute 18: (numerical)
Number of people being liable to provide maintenance for
Attribute 19: (qualitative)
Telephone
A191 : none
A192 : yes, registered under the customers name
Attribute 20: (qualitative)
foreign worker
A201 : yes
A202 : no
It is worse to class a customer as good when they are bad (5),
than it is to class a customer as bad when they are good (1).
多元共线性问题,缺失数据,非平衡数据
随机森林对多元共线性不敏感,结果对缺失数据和非平衡的数据比较稳健,可以很好地预测多达几千个解释变量的作用(Breiman 2001b),被誉为当前最好的算法之一(Iverson et al. 2008)
在做实验室的时候会发现当有线性相关的特征时,选其中一个特征和同时选择两个特征的效果是一样的,即随机森林对多元共线不敏感。
在回归分析中,当自变量之间出现多重共线性现象时,常会严重影响到参数估计,扩大模型误差,并破坏模型的稳健性,因此消除多重共线性成为回归分析中参数估计的一个重要环节。现在常用的解决多元线性回归中多重共线性的回归模型有岭回归(Ridge Regression)、主成分回归(Principal Component Regression简记为PCR)和偏最小二乘回归(Partial Least Square Regression简记为PLS)。
逻辑斯蒂回归对自变量的多元共线性非常敏感,要求自变量之间相互独立。随机森林则完全不需要这个前提条件。
1.随机森林的优点是:
- 它的学习过程很快。在处理很大的数据时,它依旧非常高效。
- 随机森林可以处理大量的多达几千个的自变量(Breiman,2001)。
- 现有的随机森林算法评估所有变量的重要性,而不需要顾虑一般回归问题面临的多元共线性的问题。
- 它包含估计缺失值的算法,如果有一部分的资料遗失,仍可以维持一定的准确度。
- 随机森林中分类树的算法自然地包括了变量的交互作用(interaction)(Cutler, et
al.,2007),即X1的变化导致X2对Y的作用发生改变。交互作用在其他模型中(如逻辑斯蒂回归)因其复杂性经常被忽略。 - 随机森林对离群值不敏感,在随机干扰较多的情况下表现稳健。
- 随机森林不易产生对数据的过度拟合(overfit)(Breiman,2001),然而这点尚有争议(Elith and
Graham,2009)。
随机森林通过袋外误差(out-of-bag error)估计模型的误差。对于分类问题,误差是分类的错误率;对于回归问题,误差是残差的方差。随机森林的每棵分类树,都是对原始记录进行有放回的重抽样后生成的。每次重抽样大约1/3的记录没有被抽取(Liaw,2012)。没有被抽取的自然形成一个对照数据集。所以随机森林不需要另外预留部分数据做交叉验证,其本身的算法类似交叉验证,而且袋外误差是对预测误差的无偏估计(Breiman,2001)。
2.随机森林的缺点:
- 随机森林在解决回归问题时并没有像它在分类中表现的那么好,这是因为它并不能给出一个连续型的输出。当进行回归时,随机森林不能够作出超越训练集数据范围的预测,这可能导致在对某些还有特定噪声的数据进行建模时出现过度拟合。
- 对于许多统计建模者来说,随机森林给人的感觉像是一个黑盒子——你几乎无法控制模型内部的运行,只能在不同的参数和随机种子之间进行尝试。
- 是它的算法倾向于观测值较多的类别(如果昆虫B的记录较多,而且昆虫A、B和C间的差距不大,预测值会倾向于B)。
- 另外,**随机森林中水平较多的分类属性的自变量(如土地利用类型 >
20个类别)比水平较少的分类属性的自变量(气候区类型<10个类别)对模型的影响大**(Deng et
al.,2011)。总之,随机森林功能强大而又简单易用,相信它会对各行各业的数据分析产生积极的推动作用
随机森林是一种比较新的机器学习模型。经典的机器学习模型是神经网络,有半个多世纪的历史了。神经网络预测精确,但是计算量很大。上世纪八十年代Breiman等人发明分类树的算法(Breiman et al. 1984),通过反复二分数据进行分类或回归,计算量大大降低。2001年Breiman把分类树组合成随机森林(Breiman 2001a),即在变量(列)的使用和数据(行)的使用上进行随机化,生成很多分类树,再汇总分类树的结果。随机森林在运算量没有显著提高的前提下提高了预测精度。随机森林对多元公线性不敏感,结果对缺失数据和非平衡的数据比较稳健,可以很好地预测多达几千个解释变量的作用(Breiman 2001b),被誉为当前最好的算法之一(Iverson et al. 2008)。
随机森林顾名思义,是用随机的方式建立一个森林,森林里面有很多的决策树组成,随机森林的每一棵决策树之间是没有关联的。在得到森林之后,当有一个新的输入样本进入的时候,就让森林中的每一棵决策树分别进行一下判断,看看这个样本应该属于哪一类(对于分类算法),然后看看哪一类被选择最多,就预测这个样本为那一类。
1.2 随机森林优点
随机森林是一个最近比较火的算法,它有很多的优点:
a. 在数据集上表现良好,两个随机性的引入,使得随机森林不容易陷入过拟合
b. 在当前的很多数据集上,相对其他算法有着很大的优势,两个随机性的引入,使得随机森林具有很好的抗噪声能力
c. 它能够处理很高维度(feature很多)的数据,并且不用做特征选择,对数据集的适应能力强:既能处理离散型数据,也能处理连续型数据,数据集无需规范化
d. 可生成一个Proximities=(pij)矩阵,用于度量样本之间的相似性: pij=aij/N, aij表示样本i和j出现在随机森林中同一个叶子结点的次数,N随机森林中树的颗数
e. 在创建随机森林的时候,对generlization error使用的是无偏估计
f. 训练速度快,可以得到变量重要性排序(两种:基于OOB误分率的增加量和基于分裂时的GINI下降量
g. 在训练过程中,能够检测到feature间的互相影响
h. 容易做成并行化方法
i. 实现比较简单
1.3 随机森林应用范围
随机森林主要应用于回归和分类。本文主要探讨基于随机森林的分类问题。随机森林和使用决策树作为基本分类器的(bagging)有些类似。以决策树为基本模型的bagging在每次bootstrap放回抽样之后,产生一棵决策树,抽多少样本就生成多少棵树,在生成这些树的时候没有进行更多的干预。而随机森林也是进行bootstrap抽样,但它与bagging的区别是:在生成每棵树的时候,每个节点变量都仅仅在随机选出的少数变量中产生。因此,不但样本是随机的,连每个节点变量(Features)的产生都是随机的。
许多研究表明, 组合分类器比单一分类器的分类效果好,随机森林(random forest)是一种利用多个分类树对数据进行判别与分类的方法,它在对数据进行分类的同时,还可以给出各个变量(基因)的重要性评分,评估各个变量在分类中所起的作用。
2. 随机森林方法理论介绍
2.1 随机森林基本原理
随机森林由LeoBreiman(2001)提出,它通过自助法(bootstrap)重采样技术,从原始训练样本集N中有放回地重复随机抽取k个样本生成新的训练样本集合,然后根据自助样本集生成k个分类树组成随机森林,新数据的分类结果按分类树投票多少形成的分数而定。其实质是对决策树算法的一种改进,将多个决策树合并在一起,每棵树的建立依赖于一个独立抽取的样品,森林中的每棵树具有相同的分布,分类误差取决于每一棵树的分类能力和它们之间的相关性。特征选择采用随机的方法去分裂每一个节点,然后比较不同情况下产生的误差。能够检测到的内在估计误差、分类能力和相关性决定选择特征的数目。单棵树的分
类能力可能很小,但在随机产生大量的决策树后,一个测试样品可以通过每一棵树的分类结果经统计后选择最可能的分类。
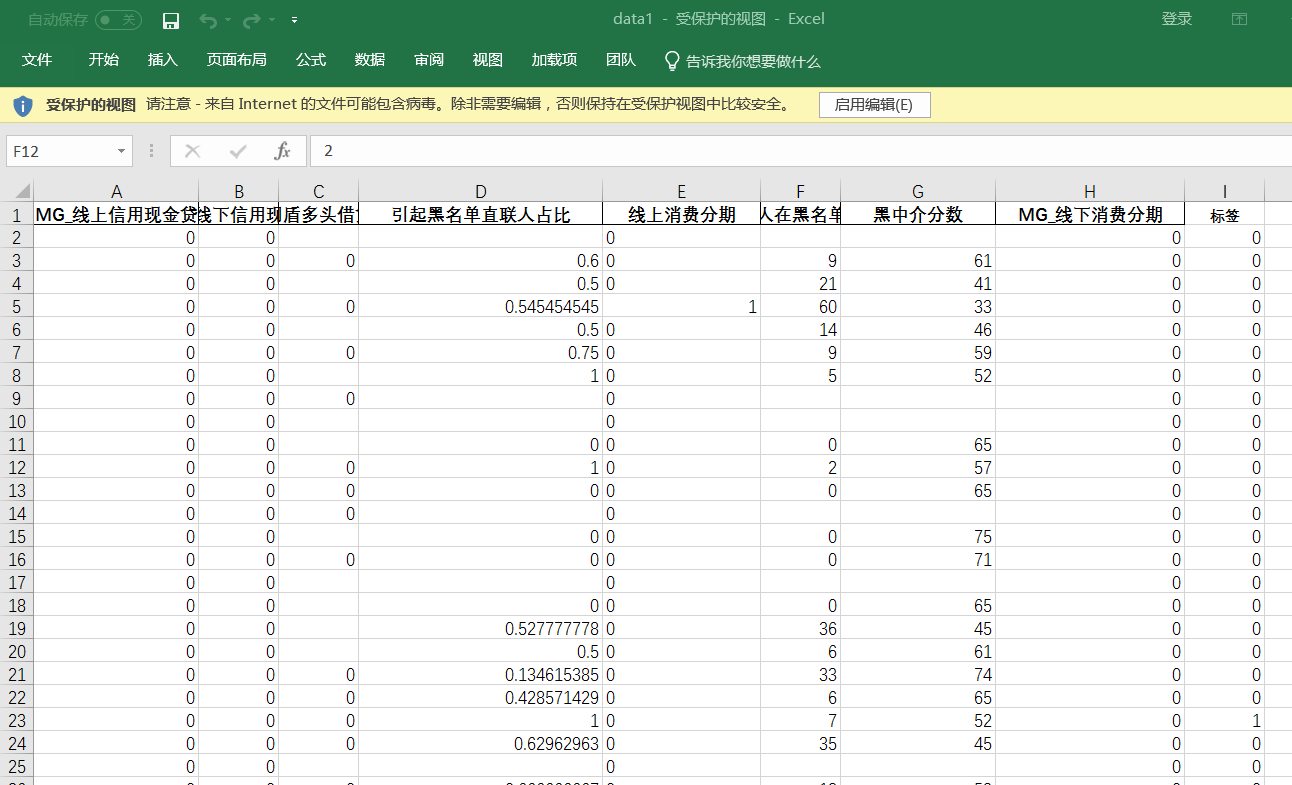
随机森林-医美分期数据
数据
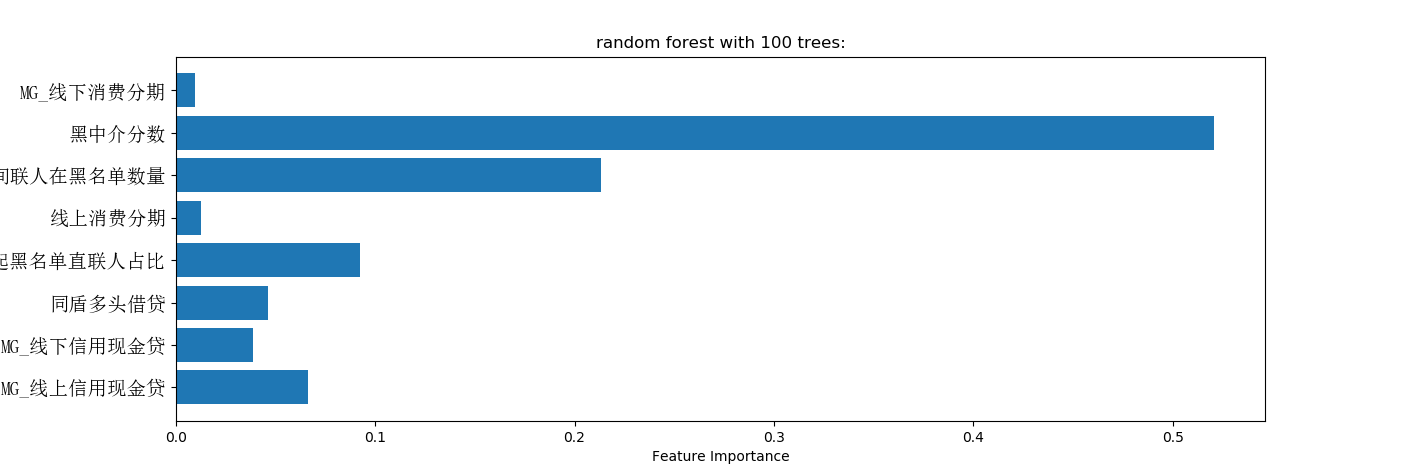
脚本包含数据预处理
- # -*- coding: utf-8 -*-
- """
- Created on Sun Apr 15 13:30:16 2018
- @author: Administrator
- """
- from sklearn.model_selection import train_test_split
- from sklearn.learning_curve import learning_curve
- from sklearn.datasets import load_digits
- import matplotlib.pyplot as plt
- import numpy as np
- import pandas as pd
- #导入数据预处理,包括标准化处理或正则处理
- from sklearn import preprocessing
- #样本平均测试,评分更加
- from sklearn.cross_validation import cross_val_score
- from sklearn import datasets
- #导入knn分类器
- from sklearn.svm import SVC
- from sklearn.neighbors import KNeighborsClassifier
- #数据预处理
- from sklearn.preprocessing import Imputer
- from sklearn.linear_model import LogisticRegression
- #用于训练数据和测试数据分类
- from sklearn.cross_validation import train_test_split
- from sklearn.ensemble import RandomForestClassifier
- from matplotlib.font_manager import FontProperties
- font=FontProperties(fname=r"c:\windows\fonts\simsun.ttc",size=14)
- trees=100
- #excel文件名
- fileName="data1.xlsx"
- #fileName="GermanData_total.xlsx"
- #读取excel
- df=pd.read_excel(fileName)
- # data为Excel前几列数据
- x1=df[df.columns[:-1]]
- #标签为Excel最后一列数据
- y1=df[df.columns[-1:]]
- #把dataframe 格式转换为阵列
- x1=np.array(x1)
- y1=np.array(y1)
- #数据预处理,否则计算出错
- y1=[i[0] for i in y1]
- y1=np.array(y1)
- #数据预处理
- imp = Imputer(missing_values='NaN', strategy='mean', axis=0)
- imp.fit(x1)
- x1=imp.transform(x1)
- forest=RandomForestClassifier(n_estimators=trees,random_state=0)
- x_train,x_test,y_train,y_test=train_test_split(x1,y1,random_state=0)
- forest.fit(x_train,y_train)
- print("accuracy on the training subset:{:.3f}".format(forest.score(x_train,y_train)))
- print("accuracy on the test subset:{:.3f}".format(forest.score(x_test,y_test)))
- print('Feature importances:{}'.format(forest.feature_importances_))
- feature_names=list(df.columns[:-1])
- n_features=x1.shape[1]
- plt.barh(range(n_features),forest.feature_importances_,align='center')
- plt.yticks(np.arange(n_features),feature_names,fontproperties=font)
- plt.title("random forest with %d trees:"%trees)
- plt.xlabel('Feature Importance')
- plt.ylabel('Feature')
- plt.show()
python风控建模实战lendingClub(博主录制,catboost,lightgbm建模,2K超清分辨率)
https://study.163.com/course/courseMain.htm?courseId=1005988013&share=2&shareId=400000000398149

微信扫二维码,免费学习更多python资源

sklearn_随机森林random forest原理_乳腺癌分类器建模(推荐AAA)的更多相关文章
- 机器学习方法(六):随机森林Random Forest,bagging
欢迎转载,转载请注明:本文出自Bin的专栏blog.csdn.net/xbinworld. 技术交流QQ群:433250724,欢迎对算法.技术感兴趣的同学加入. 前面机器学习方法(四)决策树讲了经典 ...
- 机器学习(六)—随机森林Random Forest
1.什么是随机采样? Bagging可以简单的理解为:放回抽样,多数表决(分类)或简单平均(回归): Bagging的弱学习器之间没有boosting那样的联系,不存在强依赖关系,基学习器之间属于并列 ...
- 【机器学习】随机森林(Random Forest)
随机森林是一个最近比较火的算法 它有很多的优点: 在数据集上表现良好 在当前的很多数据集上,相对其他算法有着很大的优势 它能够处理很高维度(feature很多)的数据,并且不用做特征选择 在训练完后, ...
- 随机森林random forest及python实现
引言想通过随机森林来获取数据的主要特征 1.理论根据个体学习器的生成方式,目前的集成学习方法大致可分为两大类,即个体学习器之间存在强依赖关系,必须串行生成的序列化方法,以及个体学习器间不存在强依赖关系 ...
- 【机器学习】随机森林 Random Forest 得到模型后,评估参数重要性
在得出random forest 模型后,评估参数重要性 importance() 示例如下 特征重要性评价标准 %IncMSE 是 increase in MSE.就是对每一个变量 比如 X1 随机 ...
- 第九篇:随机森林(Random Forest)
前言 随机森林非常像<机器学习实践>里面提到过的那个AdaBoost算法,但区别在于它没有迭代,还有就是森林里的树长度不限制. 因为它是没有迭代过程的,不像AdaBoost那样需要迭代,不 ...
- 决策树decision tree原理介绍_python sklearn建模_乳腺癌细胞分类器(推荐AAA)
sklearn实战-乳腺癌细胞数据挖掘(博主亲自录制视频) https://study.163.com/course/introduction.htm?courseId=1005269003& ...
- 随机森林(Random Forest)
决策树介绍:http://www.cnblogs.com/huangshiyu13/p/6126137.html 一些boosting的算法:http://www.cnblogs.com/huangs ...
- Bagging与随机森林(RF)算法原理总结
Bagging与随机森林算法原理总结 在集成学习原理小结中,我们学习到了两个流派,一个是Boosting,它的特点是各个弱学习器之间存在依赖和关系,另一个是Bagging,它的特点是各个弱学习器之间没 ...
随机推荐
- python 生成18年写过的博客词云
文章链接:https://mp.weixin.qq.com/s/NmJjTEADV6zKdT--2DXq9Q 回看18年,最有成就的就是有了自己的 博客网站,坚持记录,写文章,累计写了36篇了,从一开 ...
- C# 获取当前服务器运行程序的根目录,获取当前运行程序物理路径
C# 获取当前服务器运行程序的根目录,获取当前运行程序物理路径 string tmpRootDir = AppDomain.CurrentDomain.BaseDirectory;//获得当前服务器程 ...
- 记一次 c 语言 的 多线程查找 简单实现
//仅供参考学习 1 #define _CRT_SECURE_NO_WARNINGS //屏蔽 vs 的a #include <stdio.h> #include <stdlib.h ...
- 猴子吃桃儿问题(C#)
猴子第一天摘了许多个桃子,先吃了所有桃子的一半,后又吃了一个:第二天又吃了剩下桃子的一半,后又吃了一个……第十天,剩1个桃子.问:猴子第一天摘了多少个桃子? 本程序对其做了修改,天数和吃一半后又吃了一 ...
- VS Code常用快捷键大全
常用 General 按 Press 功能 Function Ctrl + Shift + P,F1 显示命令面板 Show Command Palette Ctrl + P 快速打开 Quick O ...
- windows下为qt msvc版本配置调试器
原文:https://blog.csdn.net/whatnamecaniuse/article/details/80716616 根据开发机的环境,下载 我的机器是win10,因此下载win 10 ...
- 【shell基础】数学计算
#!/bin/bash #4.4.sh s= #定义一个求和变量,初值为0. t=`**$` #用expr改变运算顺序,求x的y次方. t=$[t*] #t乘以3. s=$[s+t] #结果相加. t ...
- 基本MVVM 和 ICommand用法举例(转)
引言 在本贴中,我们将学习WPF Commands. Commands 可以很好地与 MVVM 模式 (Model- View-ViewModel)结合在一起.我们也将看到,视图(view)实际上是怎 ...
- python已经感觉到放弃接近的day08
居然能超过一个星期,我甚至都有点佩服我自己了,今天有两个新的知识点,一个简单一个难,先从简单的开始入手吧,进制,进制分为4种,2进制,8进制,10进制,16进制,一般最常用的就是10进制了,计算机用的 ...
- 关于map的初级应用
map实际采用了红黑树的实现,在此,我们先不讨论map的底层实现结构原理,先来看看map究竟是怎么用,以及我是怎么看待map的. 先上代码: #include <map> #include ...

