matplotlib之legend
在《matplotlib极坐标系应用之雷达图》 中,我们提出了这个问题“图例中每种成员的颜色是怎样和极坐标相应的成员的颜色相对应的呢”,那么接下来我们说说legend的一般使用和设置。
调用legend()一般有三种方式:
方式1. 自动检测,直接调用legend();
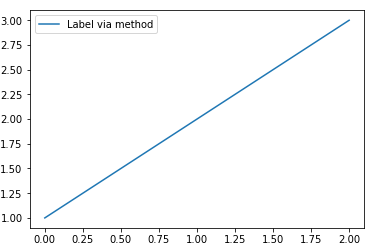
在plot()时就指定图例labels,再直接调用legend()就好了,或者在plot中指定plot elements,然后通过set_label函数指定图例labels
 plt.plot([1, 2, 3], label='Inline label')

 plt.legend()

 line, = plt.plot([1, 2, 3])#此处的逗号非常重要,如果没有的话line是一个list对象;加上的话line是一个matplotlib.lines.Line2D对象,才能调用set_label()函数

 line.set_label('Label via method')

 plt.legend()

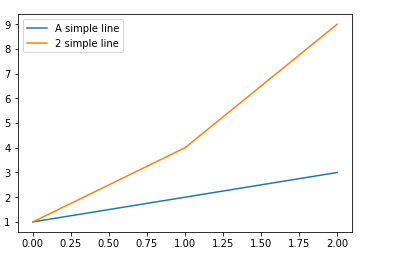
方式2. 显示指定labels,调用legend(labels);
但是,这种方式会使plot elements 和 labels的对应关系不明显,所以并不建议使用这种方式。
Note: This way of using is discouraged, because the relation between plot elements and labels is only implicit by their order and can easily be mixed up.
 plt.plot([1, 2, 3])

 plt.plot([1, 4, 9])

 plt.legend(['A simple line','2 simple line'])
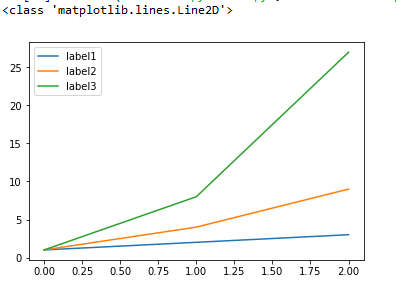
方式3. 显示指定plot elements 和 labels,调用legend(handles, labels)
handles : sequence of Artist/lines/patches
A list of Artists (lines, patches) to be added to the legend. Use this together with labels, if you need full control on what is shown in the legend and the automatic mechanism described above is not sufficient.
The length of handles and labels should be the same in this case. If they are not, they are truncated to the smaller length.
labels : sequence of strings, optional
A list of labels to show next to the artists. Use this together with handles, if you need full control on what is shown in the legend and the automatic mechanism described above is not sufficient.
 line1, = plt.plot([1,2,3])

 print(type(line1))

 line2, = plt.plot([1,4,9])

 line3, = plt.plot([1,8,27])

 handles = (line1, line2, line3)

 labels = ('label1', 'label2', 'label3')

 plt.legend(handles, labels)
legend()的返回值:class:`matplotlib.legend.Legend` instance
其他参数说明:
loc : int or string or pair of floats, default: ‘upper right’
| Location String | Location Code |
| ‘best’ | 0 |
| ‘upper right’ | 1 |
| ‘upper left’ | 2 |
| ‘lower left’ | 3 |
| ‘lower right’ | 4 |
| ‘right’ | 5 |
| ‘center left’ | 6 |
| ‘center right’ | 7 |
| ‘lower center’ | 8 |
| ‘upper center’ | 9 |
| ‘center’ | 10 |
ncol : integer(设置图例显示列数)
The number of columns that the legend has. Default is 1.
prop : None or matplotlib.font_manager.FontProperties or dict(设置图例字体)
The font properties of the legend. If None (default), the current matplotlib.rcParams will be used.
references:
https://matplotlib.org/api/_as_gen/matplotlib.pyplot.legend.html?highlight=legend#matplotlib.pyplot.legend
https://matplotlib.org/tutorials/intermediate/legend_guide.html#sphx-glr-tutorials-intermediate-legend-guide-py
matplotlib之legend的更多相关文章
- matplotlib笔记——legend用法
rates = [0.01, 0.001, 0.0001] models = {} costs = np.array([[0.7, 0.9, 0.4, 0.6, 0.4, 0.3, 0.2, 0.1] ...
- 【Python学习笔记】调整matplotlib的图例legend的位置
有时默认的图例位置不符合我们的需要,那么我们可以使用下面的代码对legend位置进行调整. plt.legend(loc='String or Number', bbox_to_anchor=(num ...
- matplotlib.legend()函数用法
用的较多,作为记录 legend语法参数如下: matplotlib.pyplot.legend(*args, **kwargs) 几个暂时主要用的参数: (1)设置图例位置 使用loc参数 plt. ...
- matplotlib 进阶之Legend guide
目录 matplotlib.pyplot.legend 方法1自动检测 方法2为现有的Artist添加 方3显示添加图例 控制图例的输入 为一类Artist设置图例 Legend 的位置 loc, b ...
- matplotlib 入门之Sample plots in Matplotlib
文章目录 Line Plot One figure, a set of subplots Image 展示图片 展示二元正态分布 A sample image Interpolating images ...
- 基于matplotlib的数据可视化 - 笔记
1 基本绘图 在plot()函数中只有x,y两个量时. import numpy as np import matplotlib.pyplot as plt # 生成曲线上各个点的x,y坐标,然后用一 ...
- matplotlib使用总结
一.简介 Matplotlib 是一个 Python 的 2D绘图库,它以各种硬拷贝格式和跨平台的交互式环境生成出版质量级别的图形.通过 Matplotlib,开发者可以仅需要几行代码,便可以生成绘图 ...
- python 2: 解决python中的plot函数的图例legend不能显示中文问题
问题: 图像标题.横纵坐标轴的标签都能显示中文名字,但是图例就是不能显示中文,怎么解决呢? 解决: plt.figure() plt.title(u'训练性能', fontproperties=f ...
- Python之matplotlib库学习:实现数据可视化
1. 安装和文档 pip install matplotlib 官方文档 为了方便显示图像,还使用了ipython qtconsole方便显示.具体怎么弄网上搜一下就很多教程了. pyplot模块是提 ...
随机推荐
- javascript 检测浏览器类型和版本的代码
方法1:对象/特征检测法 该方法是一种判断浏览器能力(而非浏览器的确切型号)的通用方法.大部分JS专家认为这个方法最合适,因为他们认为按照该方法所编写的脚本是经得起未来考验的. //获取IE浏览器的版 ...
- 从项目上一个子查询扩展学习开来:mysql的查询、子查询及连接查询
上面这样的数据,想要的结果是:如果matchResult为2的话,代表是黑名单.同一个softId,version,pcInfoId的代表是同一个软件,需要去重:同时,如果相同软件里面只要有一个mat ...
- PAAS云服务平台
云计算是一种可以方便.按需从网络訪问的.可配置的.共享的资源池(如网络.server.存储.应用程序和服务)模型,且仅仅需最少的管理(服务提供方交互)就可以高速供应和公布该模型. 云计算平台的核心部分 ...
- Android技术——在Android中的随意视图中找控件
1.在非常多情况下,我们可能不知道控件的id,可是我们却希望在包括这个控件的视图中找到它,能够採用例如以下做法: 例:在Activity的根视图中找出当中全部的Button控件 private voi ...
- jstat的用法
转载:http://www.51testing.com/html/92/77492-203728.html 用以判断JVM是否存在内存问题呢?如何判断JVM垃圾回收是否正常?一般的top指令基本上满足 ...
- Centos 7 搭建蓝鲸3.1.5社区版
第一次搭建蓝鲸平台,参考了蓝鲸社区的官方搭建文档. 友情链接:蓝鲸智云社区版V3.1用户手册 搭建时遇到了不少的坑,这里做一个详细的安装梳理 主机硬件要求 官方的推荐如下: 我在公司测试环境搭建时机器 ...
- 小白系列-免费广告路由器web认证设置(2)
要设置认证页面图片.须要到后台注冊一个帐号,绑定路由器. 路由器管理后台网址 http://115.29.12.130/router 第一步:自己主动获取一个路由器ID(上一篇文章中的路由器ID也要改 ...
- unity3d中布娃娃系统
原地址:http://blog.csdn.net/pizi0475/article/details/9771941 转自: http://forum.mirax.com.tw/unity/viewto ...
- vue vuex 大型项目demo示例
1.vuex 动态模块配置 import Vue from 'vue' import Vuex from 'vuex' import store from '@/store'; // 使用Vuex插件 ...
- leetcode第一刷_Combination Sum Combination Sum II
啊啊啊啊.好怀念这样的用递归保存路径然后打印出来的题目啊.好久没遇到了. 分了两种,一种是能够反复使用数组中数字的,一种是每一个数字仅仅能用一次的.事实上没有多大差别,第一种每次进入递归的时候都要从头 ...