4.matplotlib绘制直方图
 

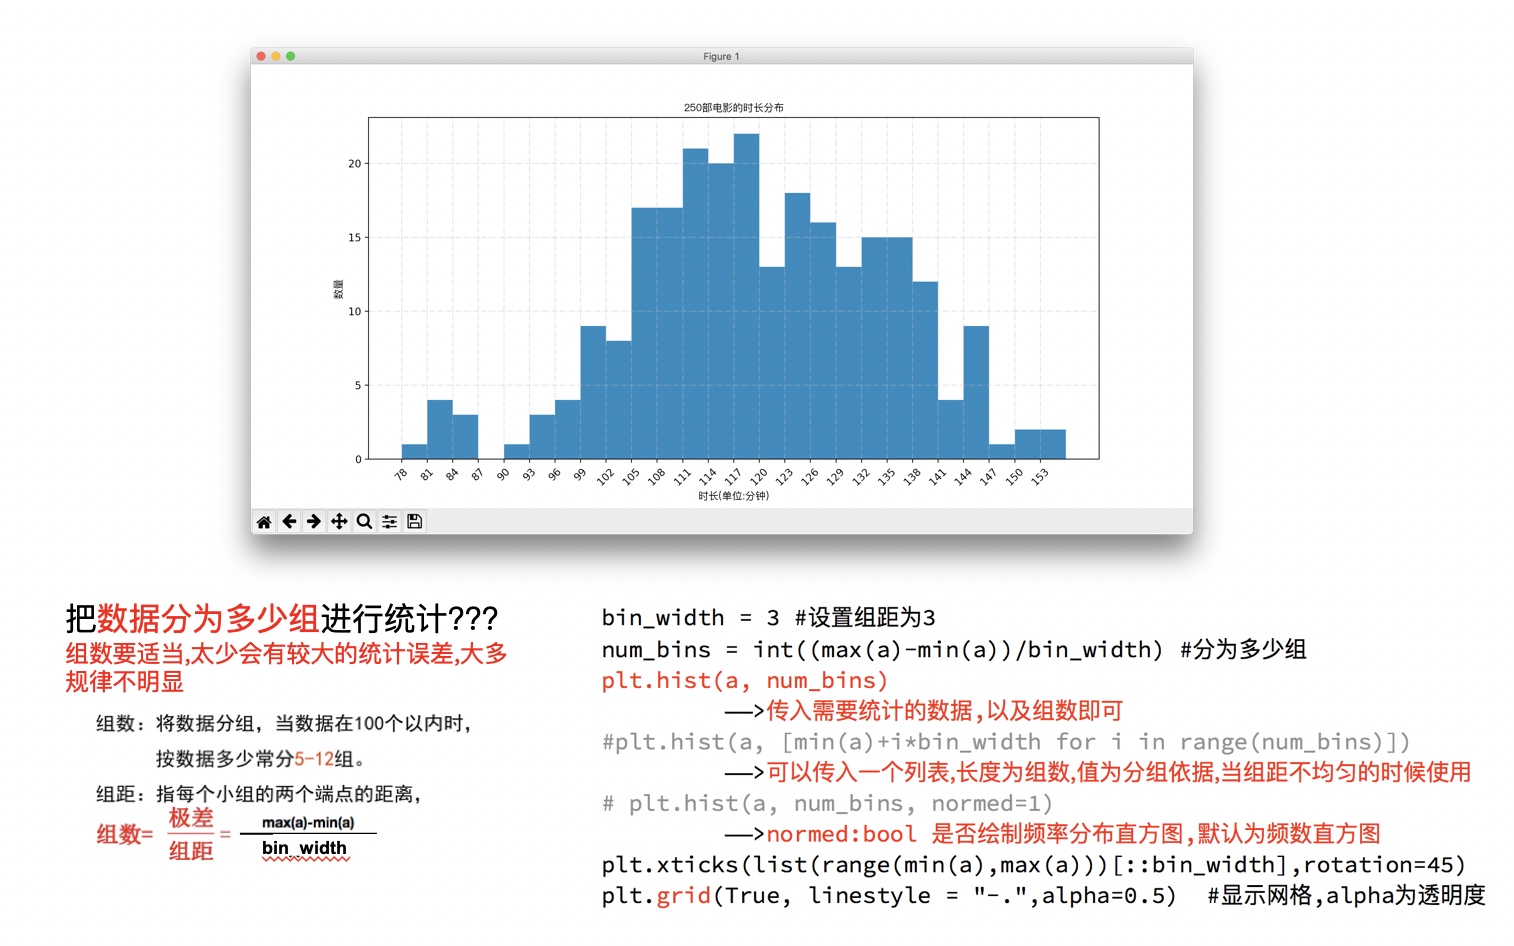 

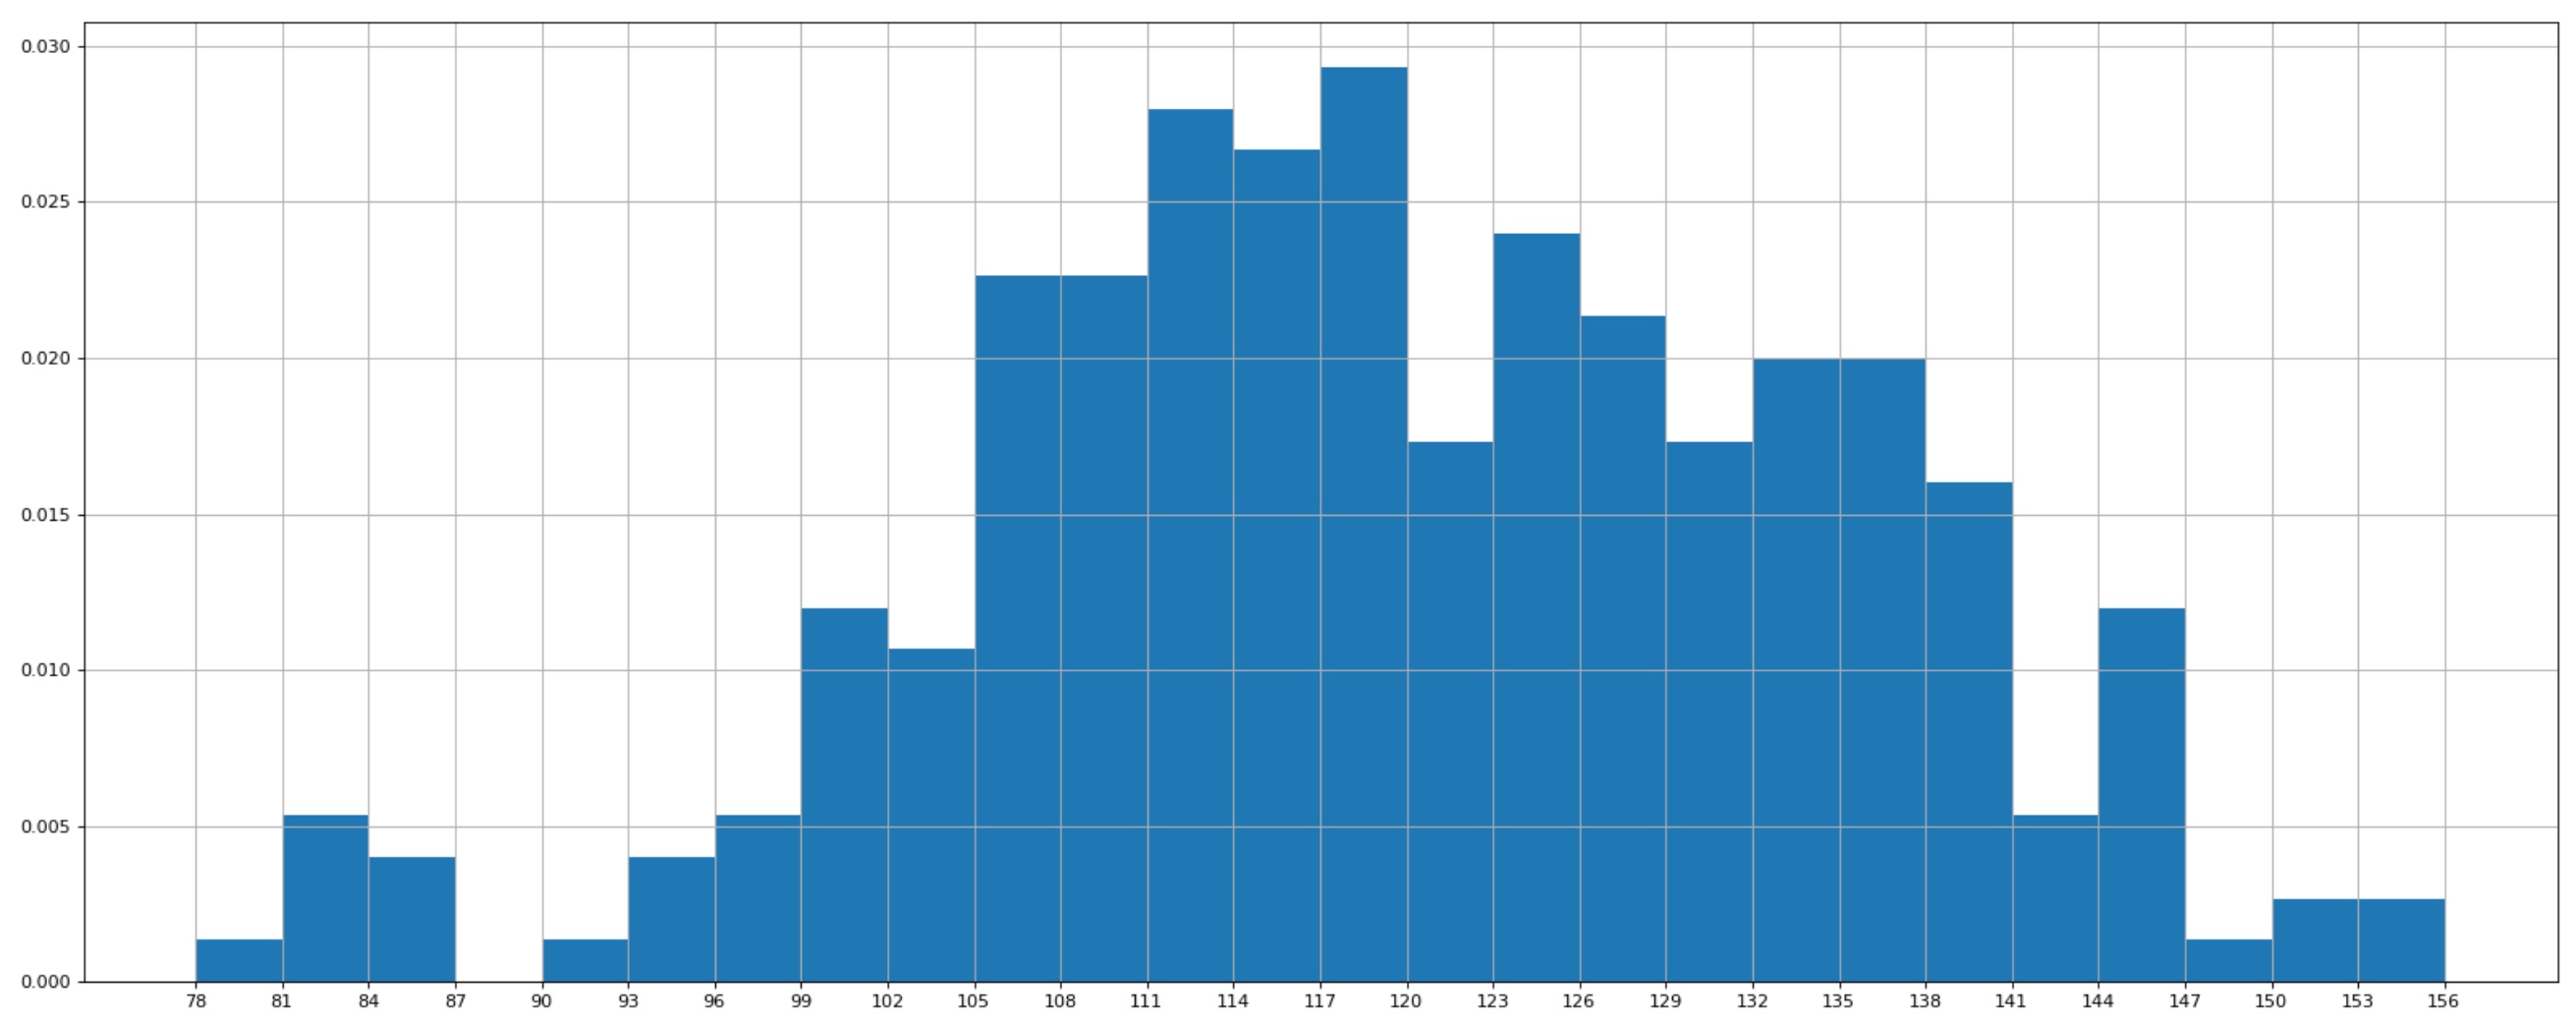
# coding=utf-8from matplotlib import pyplot as pltfrom matplotlib import font_managera=[131, 98, 125, 131, 124, 139, 131, 117, 128, 108, 135, 138, 131, 102, 107, 114, 119, 128, 121, 142, 127, 130, 124, 101, 110, 116, 117, 110, 128, 128, 115, 99, 136, 126, 134, 95, 138, 117, 111,78, 132, 124, 113, 150, 110, 117, 86, 95, 144, 105, 126, 130,126, 130, 126, 116, 123, 106, 112, 138, 123, 86, 101, 99, 136,123, 117, 119, 105, 137, 123, 128, 125, 104, 109, 134, 125, 127,105, 120, 107, 129, 116, 108, 132, 103, 136, 118, 102, 120, 114,105, 115, 132, 145, 119, 121, 112, 139, 125, 138, 109, 132, 134,156, 106, 117, 127, 144, 139, 139, 119, 140, 83, 110, 102,123,107, 143, 115, 136, 118, 139, 123, 112, 118, 125, 109, 119, 133,112, 114, 122, 109, 106, 123, 116, 131, 127, 115, 118, 112, 135,115, 146, 137, 116, 103, 144, 83, 123, 111, 110, 111, 100, 154,136, 100, 118, 119, 133, 134, 106, 129, 126, 110, 111, 109, 141,120, 117, 106, 149, 122, 122, 110, 118, 127, 121, 114, 125, 126,114, 140, 103, 130, 141, 117, 106, 114, 121, 114, 133, 137, 92,121, 112, 146, 97, 137, 105, 98, 117, 112, 81, 97, 139, 113,134, 106, 144, 110, 137, 137, 111, 104, 117, 100, 111, 101, 110,105, 129, 137, 112, 120, 113, 133, 112, 83, 94, 146, 133, 101,131, 116, 111, 84, 137, 115, 122, 106, 144, 109, 123, 116, 111,111, 133, 150]#计算组数d = 3 #组距num_bins = (max(a)-min(a))//dprint(max(a),min(a),max(a)-min(a))print(num_bins)#设置图形的大小plt.figure(figsize=(20,8),dpi=80)plt.hist(a,num_bins,normed=True)#设置x轴的刻度plt.xticks(range(min(a),max(a)+d,d))plt.grid()plt.show()
显示效果

4.matplotlib绘制直方图的更多相关文章
- NumPy使用 Matplotlib 绘制直方图
NumPy - 使用 Matplotlib 绘制直方图 NumPy 有一个numpy.histogram()函数,它是数据的频率分布的图形表示. 水平尺寸相等的矩形对应于类间隔,称为bin,变量hei ...
- matplotlib绘制直方图【柱状图】
代码: def drawBar(): xticks = ['A', 'B', 'C', 'D', 'E']#每个柱的下标说明 gradeGroup = {'A':200,'B':250,'C':330 ...
- 关于matplotlib绘制直方图偏移的问题
在使用pyplot绘制直方图的时候我发现了一个问题,在给函数.hist()传参的时候,如果传入的组数不是刚刚好(就是说这个组数如果是使用(最大值-最小值)/组距计算出来,而这个数字不是整除得来而是取整 ...
- Python:matplotlib绘制直方图
使用hist方法来绘制直方图: 绘制直方图,最主要的是一个数据集data和需要划分的区间数量bins,另外你也可以设置一些颜色.类型参数: plt.hist(np.random.randn(1 ...
- numpy和matplotlib绘制直方图
使用 Matplotlib Matplotlib 中有直方图绘制函数:matplotlib.pyplot.hist()它可以直接统计并绘制直方图.你应该使用函数 calcHist() 或 np.his ...
- 利用pandas读取Excel表格,用matplotlib.pyplot绘制直方图、折线图、饼图
利用pandas读取Excel表格,用matplotlib.pyplot绘制直方图.折线图.饼图 数据: 折线图代码: import pandas as pdimport matplotlib. ...
- matplotlib如何绘制直方图、条形图和饼图
1 绘制直方图: import matplotlib.pyplot as plt import numpy as np import matplotlib def hist1(): # 设置matpl ...
- python包matplotlib绘制图像
使用matplotlib绘制图像 import matplotlib.pyplot as plt from matplotlib.pyplot import MultipleLocator impor ...
- matplotlib绘制动画
matplotlib从1.1.0版本以后就开始支持绘制动画,具体使用可以参考官方帮助文档.下面是一个很基本的例子: """ A simple example of an ...
随机推荐
- docker时区问题
解决: dockerfile: RUN cp /usr/share/zoneinfo/Asia/Shanghai /etc/localtime#update application timezoneR ...
- portaudio使用笔记《转》
原文链接:https://blog.csdn.net/gg_simida/article/details/77185755 介绍 PortAudio是一个免费.跨平台.开源的音频I/O库.看到I/O可 ...
- C# 序列化与反序列化之DataContract与xml对子类进行序列化的解决方案
C# 序列化与反序列化之DataContract与xml对子类进行序列化的解决方案 1.DataContract继承对子类进行序列化的解决方案 第一种是在 [DataContract, KnownTy ...
- Behavior Trees for Path Planning (Autonomous Driving)
Behavior Trees for Path Planning (Autonomous Driving) 2019-11-13 08:16:52 Path planning in self-driv ...
- angular自定义module
在app.module.ts里面,imports部分,添加你的自定义模块名在你的自定义模块内,添加了component以后,需要添加exports导出,类似下面 import { NgModule } ...
- android mk 预编译库
LOCAL_PATH := $(call my-dir) #include $(CLEAR_VARS) # OpenCV #OPENCV_CAMERA_MODULES:=on #OPENCV_INST ...
- 查找算法(4)--Fibonacci search--斐波那契查找
1.斐波那契查找 (1)说明 在介绍斐波那契查找算法之前,我们先介绍一下很它紧密相连并且大家都熟知的一个概念——黄金分割. 黄金比例又称黄金分割,是指事物各部分间一定的数学比例关系,即将整体一分为二, ...
- layui 复选框checkbox 实现全选全选
<!DOCTYPE html> <html lang="en"> <head> <meta charset="UTF-8&quo ...
- 使用Port Forwarding连接k8s集群的pod(redis、mysql等)
一. 创建Redis的deployment和service 1. 创建Redis deployment redis-master-deployment.yaml apiVersion: apps/v ...
- Pi1-加电
作为理工男,怎么能不折腾?终于等到我4G版的树莓派4. 1.制作系统.新手当然上官网下载官方系统,img文件,写入tf卡.mac下的步骤请见<mac下制作树莓派系统盘>,一步步来就行.思路 ...