mean shift聚类算法的MATLAB程序
mean shift聚类算法的MATLAB程序
凯鲁嘎吉 - 博客园 http://www.cnblogs.com/kailugaji/
1. mean shift 简介
mean shift, 写的更符合国人的习惯,应该是mean of shift,也就是平均偏移量,或者偏移均值向量。在明确了含义之后,就可以开始如下的具体讲解了。
<img src="https://pic1.zhimg.com/50/v2-b5f01fcdfc7b850338a7aad6e6540349_hd.jpg" data-caption="" data-size="normal" data-rawwidth="1106" data-rawheight="673" data-default-watermark-src="https://pic1.zhimg.com/50/v2-f5e71dfb333bbc9ca57c70c01032d59f_hd.jpg" class="origin_image zh-lightbox-thumb" width="1106" data-original="https://pic1.zhimg.com/v2-b5f01fcdfc7b850338a7aad6e6540349_r.jpg"/>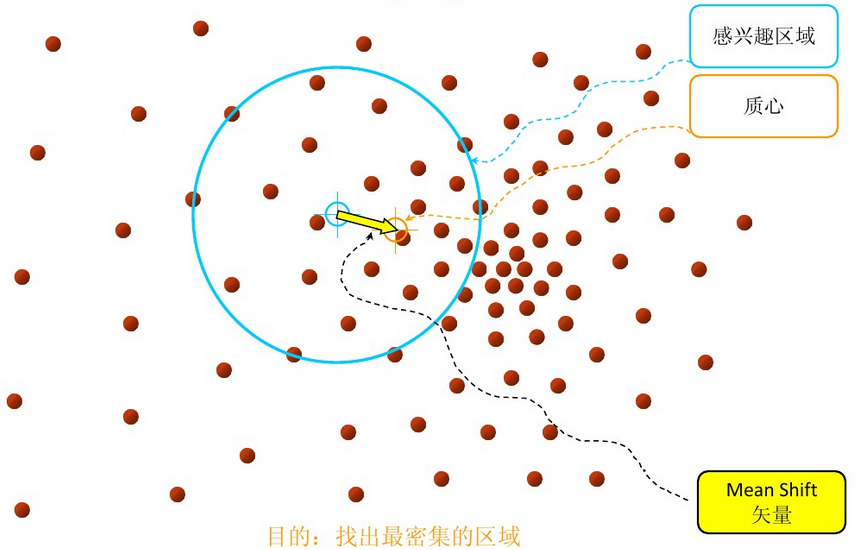
1). 基本形式
其中 为
个样本点,
,
为以
为中心的半径为
的高维球体,表示有效区域,其中包含
个样本点。其变形如下:
由此可以可知, 作为x的偏移均值向量,可用来对
进行更新,但这种更新有什么意义呢?通过简单的二维样本模拟,可以发现其倾向于向有效区域中样本密度高(即概率密度大)的地方移动。
2). 改进形式
基本形式中隐含了在有效区域中对所有的样本点一视同仁的假设,但这通常是不成立,最常见的就是随着距离的增加,作用就越小,因此,就有了如下的改进形式:
其中 为核函数,
表示带宽(严格来讲因为带宽矩阵,为对角矩阵,但通常对角元素取相等,故可表示为标量),
为样本权重。
由此可对基本形式进行更为合理的表示,采用均匀核函数,从而达到统一表示:
2. mean shift 解释
1). 数学推导
概率密度估计中,常用的方法有直方图估计、K近邻估计、核函数估计,其中核函数估计的表示如下:
其中 同样表示核函数。对概率密度函数
求导如下:
令 ,其亦是核函数,进一步分解,有如下表示:
可以看出,其中第二项也是一种概率密度的核函数估计,将其表示为 ,第三项则为上文中的mean shift的改进形式,因此,可以改写为:
接下来是两种解释,首先,求解概率密度局部极大值,令 ,由于
,故有:
这表示mean shift的本质是在求解概率密度局部极大值,即偏移均值向量让目标点始终向概率密度极大点处移动。但当数据量非常大时,一次遍历所有样本点显然不合适,故常选取目标点 附近的一个区域,进行贪心迭代,逐步收敛于概率密度极大值处;另一种更合理的解释是,通过在核函数
中融合进一个均匀核函数来表示选取的有效区域,然后迭代直至收敛。
再者,从梯度上升的优化角度来讲,有如下表示:
即偏移均值向量的作用等价于以概率密度为目标的具有自适应步长的梯度上升优化,其在概率密度较小的位置步长较大,当逼近局部极大点时,概率密度较大,因此步长较小,符合梯度优化中步长变化的需要。
由此,便对mean shift的含义及其合理性进行了解释,也就不难理解为何mean shift具有强大的效果及适用性了。
2). 泛化拓展
进一步拓展,虽然一般形式的mean shift是由概率密度的核函数估计推导出来的,其核心是核函数,但由于其具有归一化表示的性质,因此,理论上可以泛化为如下表示形式:
其中 确定偏移向量
的整体权重,可以任意选取,但必然需要具有一定的意义。显然偏移均值向量会倾向于权重较大的样本点,因此,从概率密度最大化的角度来看,
可以是
处概率密度的一种表示。
3. mean shift MATLAB程序
testMeanShift.m
clear

clc

profile on

bandwidth = 1;

%% 加载数据

data_load=dlmread('gauss_data.txt');

[~,dim]=size(data_load);

data=data_load(:,1:dim-1);

x=data';

%% 聚类

tic

[clustCent,point2cluster,clustMembsCell] = MeanShiftCluster(x,bandwidth);

% clustCent:聚类中心 D*K, point2cluster:聚类结果 类标签, 1*N

toc

%% 作图

numClust = length(clustMembsCell);

figure(2),clf,hold on

cVec = 'bgrcmykbgrcmykbgrcmykbgrcmyk';%, cVec = [cVec cVec];

for k = 1:min(numClust,length(cVec))

    myMembers = clustMembsCell{k};

    myClustCen = clustCent(:,k);

    plot(x(1,myMembers),x(2,myMembers),[cVec(k) '.'])

    plot(myClustCen(1),myClustCen(2),'o','MarkerEdgeColor','k','MarkerFaceColor',cVec(k), 'MarkerSize',10)

end

title(['no shifting, numClust:' int2str(numClust)])
MeanShiftCluster.m
function [clustCent,data2cluster,cluster2dataCell] = MeanShiftCluster(dataPts,bandWidth,plotFlag)

%perform MeanShift Clustering of data using a flat kernel

%

% ---INPUT---

% dataPts           - input data, (numDim x numPts)

% bandWidth         - is bandwidth parameter (scalar)

% plotFlag          - display output if 2 or 3 D    (logical)

% ---OUTPUT---

% clustCent         - is locations of cluster centers (numDim x numClust)

% data2cluster      - for every data point which cluster it belongs to (numPts)

% cluster2dataCell  - for every cluster which points are in it (numClust)

%

% Bryan Feldman 02/24/06

% MeanShift first appears in

% K. Funkunaga and L.D. Hosteler, "The Estimation of the Gradient of a

% Density Function, with Applications in Pattern Recognition"

%*** Check input ****

if nargin < 2

    error('no bandwidth specified')

end

if nargin < 3

    plotFlag = true;

    plotFlag = false;

end

%**** Initialize stuff ***

[numDim,numPts] = size(dataPts);

numClust        = 0;

bandSq          = bandWidth^2;

initPtInds      = 1:numPts;

maxPos          = max(dataPts,[],2);                    %biggest size in each dimension

minPos          = min(dataPts,[],2);                    %smallest size in each dimension

boundBox        = maxPos-minPos;                        %bounding box size

sizeSpace       = norm(boundBox);                       %indicator of size of data space

stopThresh      = 1e-3*bandWidth;                       %when mean has converged

clustCent       = [];                                   %center of clust

beenVisitedFlag = zeros(1,numPts);                      %track if a points been seen already

numInitPts      = numPts;                               %number of points to posibaly use as initilization points

clusterVotes    = zeros(1,numPts);                      %used to resolve conflicts on cluster membership

while numInitPts

    tempInd         = ceil( (numInitPts-1e-6)*rand);        %pick a random seed point

    stInd           = initPtInds(tempInd);                  %use this point as start of mean

    myMean          = dataPts(:,stInd);                     % intilize mean to this points location

    myMembers       = [];                                   % points that will get added to this cluster

    thisClusterVotes    = zeros(1,numPts);                  %used to resolve conflicts on cluster membership

    while 1     %loop untill convergence

        sqDistToAll = sum((repmat(myMean,1,numPts) - dataPts).^2);    %dist squared from mean to all points still active

        inInds      = find(sqDistToAll < bandSq);                     %points within bandWidth

        thisClusterVotes(inInds) = thisClusterVotes(inInds)+1;        %add a vote for all the in points belonging to this cluster

        myOldMean   = myMean;                                   %save the old mean

        myMean      = mean(dataPts(:,inInds),2);                %compute the new mean

        myMembers   = [myMembers inInds];                       %add any point within bandWidth to the cluster

        beenVisitedFlag(myMembers) = 1;                         %mark that these points have been visited

        %*** plot stuff ****

        if plotFlag

            figure(1),clf,hold on

            if numDim == 2

                plot(dataPts(1,:),dataPts(2,:),'.')

                plot(dataPts(1,myMembers),dataPts(2,myMembers),'ys')

                plot(myMean(1),myMean(2),'go')

                plot(myOldMean(1),myOldMean(2),'rd')

                pause

            end

        end

        %**** if mean doesn't move much stop this cluster ***

        if norm(myMean-myOldMean) < stopThresh

            %check for merge posibilities

            mergeWith = 0;

            for cN = 1:numClust

                distToOther = norm(myMean-clustCent(:,cN));     %distance from posible new clust max to old clust max

                if distToOther < bandWidth/2                    %if its within bandwidth/2 merge new and old

                    mergeWith = cN;

                    break;

                end

            end

            if mergeWith > 0    % something to merge

                clustCent(:,mergeWith)       = 0.5*(myMean+clustCent(:,mergeWith));              %record the max as the mean of the two merged (I know biased twoards new ones)

                %clustMembsCell{mergeWith}    = unique([clustMembsCell{mergeWith} myMembers]);   %record which points inside

                clusterVotes(mergeWith,:)    = clusterVotes(mergeWith,:) + thisClusterVotes;     %add these votes to the merged cluster

            else    %its a new cluster

                numClust                    = numClust+1;                    %increment clusters

                clustCent(:,numClust)       = myMean;                        %record the mean

                %clustMembsCell{numClust}    = myMembers;                    %store my members

                clusterVotes(numClust,:)    = thisClusterVotes;

            end

            break;

        end

    end

    initPtInds      = find(beenVisitedFlag == 0);           %we can initialize with any of the points not yet visited

    numInitPts      = length(initPtInds);                   %number of active points in set

end

[val,data2cluster] = max(clusterVotes,[],1);                %a point belongs to the cluster with the most votes

%*** If they want the cluster2data cell find it for them

if nargout > 2

    cluster2dataCell = cell(numClust,1);

    for cN = 1:numClust

        myMembers = find(data2cluster == cN);

        cluster2dataCell{cN} = myMembers;

    end

end
数据见:MATLAB中“fitgmdist”的用法及其GMM聚类算法,保存为gauss_data.txt文件,数据最后一列是类标签。
4. 结果

注意:聚类结果与核函数中的参数带宽bandwidth有很大关系,视具体数据而定。
5. 参考文献
mean shift聚类算法的MATLAB程序的更多相关文章
- ISODATA聚类算法的matlab程序
ISODATA聚类算法的matlab程序 作者:凯鲁嘎吉 - 博客园 http://www.cnblogs.com/kailugaji/ 参考:Kmeans及ISODATA算法的matlab实现 算法 ...
- canopy聚类算法的MATLAB程序
canopy聚类算法的MATLAB程序 凯鲁嘎吉 - 博客园 http://www.cnblogs.com/kailugaji/ 1. canopy聚类算法简介 Canopy聚类算法是一个将对象分组到 ...
- KFCM算法的matlab程序(用FCM初始化聚类中心)
KFCM算法的matlab程序(用FCM初始化聚类中心) 在“聚类——KFCM”这篇文章中已经介绍了KFCM算法,现在用matlab程序对iris数据库进行实现,用FCM初始化聚类中心,并求其准确度与 ...
- GMM算法的matlab程序
GMM算法的matlab程序 在“GMM算法的matlab程序(初步)”这篇文章中已经用matlab程序对iris数据库进行简单的实现,下面的程序最终的目的是求准确度. 作者:凯鲁嘎吉 - 博客园 h ...
- GMM算法的matlab程序(初步)
GMM算法的matlab程序 在https://www.cnblogs.com/kailugaji/p/9648508.html文章中已经介绍了GMM算法,现在用matlab程序实现它. 作者:凯鲁嘎 ...
- 聚类——GAKFCM的matlab程序
聚类——GAKFCM的matlab程序 作者:凯鲁嘎吉 - 博客园 http://www.cnblogs.com/kailugaji/ 在聚类——GAKFCM文章中已介绍了GAKFCM算法的理论知识, ...
- 聚类——WKFCM的matlab程序
聚类——WKFCM的matlab程序 作者:凯鲁嘎吉 - 博客园 http://www.cnblogs.com/kailugaji/ 在聚类——WKFCM文章中已介绍了WKFCM算法的理论知识,现在用 ...
- 聚类——KFCM的matlab程序
聚类——KFCM的matlab程序 作者:凯鲁嘎吉 - 博客园 http://www.cnblogs.com/kailugaji/ 在聚类——KFCM文章中已介绍了KFCM-F算法的理论知识,现在用m ...
- 聚类——FCM的matlab程序
聚类——FCM的matlab程序 作者:凯鲁嘎吉 - 博客园 http://www.cnblogs.com/kailugaji/ 在聚类——FCM文章中已介绍了FCM算法的理论知识,现在用matlab ...
随机推荐
- k8s kubernetes 核心笔记 镜像仓库 项目k8s改造(含最新k8s v1.16.2版本)
k8s kubernetes 核心笔记 镜像仓库 项目k8s改造 2019/10/24 Chenxin 一 基本资料 一 参考: https://kubernetes.io/ 官网 https://k ...
- 记一次mq无法正常生产消息的事故排查过程
早上上班后得知,服务费未同步到代理商系统.查看draft_server系统生产环境的log,显示在往RabbitMQ推数据时出现异常:no route to host. 2019-07-29 01:3 ...
- python创建文件夹
import os filePath = 'D:\12345' # 判断文件夹是否存在,不存在则创建文件夹if not os.path.exists(filePath): os.makedirs(fi ...
- nvidia quadro m5000 驱动安装 - 1804 ubuntu; nvidia-smi topo --matrix 查看gpu拓扑;nvidia-smi命令使用;
查看GPU型号: lspci | grep -i nvidia 驱动安装: https://www.nvidia.cn/Download/index.aspx?lang=cn 下载对应版本的驱动驱动程 ...
- (入门SpringBoot)SpringBoot加接口操作日志好方法(九)
用Spring的切面去做,慕课网上的大神的小妙招,被我拷贝下来了.import org.aspectj.lang.JoinPoint; import org.aspectj.lang.annotati ...
- python操作队列
进行队列的操作,首先要引入queue这个库 一:设置队列(括号中是队列可容纳数据的多少,如果不设置,则可以一直增加) import queue q = queue.Queue(10) 二:添加/获取元 ...
- AcWing 154. 滑动窗口 单调队列
地址 https://www.acwing.com/problem/content/description/156/ 输入格式 输入包含两行. 第一行包含两个整数n和k,分别代表数组长度和滑动窗口的长 ...
- golang数据结构之单链表
实现单链表的增删查改. 目录如下: singleLink.go package link import ( "fmt" ) //HeroNode 链表节点 type HeroNod ...
- Unity Settings Deamon crash in 16.04 every time after boot
安装ubuntu 16.04的时候,出现这样一个错误: unity-settings-deamon crashed with SIGSEGV in up_exported_dae (can't rea ...
- openpyxl常用API
worksheet.cell(self, row, column, value=None)描述:给指定位置的单元格赋值参数: row&column:必须参数,单元格的坐标 value:可选参数 ...