吴裕雄--天生自然 PYTHON数据分析:糖尿病视网膜病变数据分析(完整版)
# This Python 3 environment comes with many helpful analytics libraries installed

# It is defined by the kaggle/python docker image: https://github.com/kaggle/docker-python

# For example, here's several helpful packages to load in

import numpy as np # linear algebra

import pandas as pd # data processing, CSV file I/O (e.g. pd.read_csv)

# Input data files are available in the "../input/" directory.

# For example, running this (by clicking run or pressing Shift+Enter) will list the files in the input directory
import os, sys

import numpy as np

import pandas as pd

import matplotlib.pyplot as plt

import skimage.io

from skimage.transform import resize

#from imgaug import augmenters as iaa

from tqdm import tqdm

import PIL

from PIL import Image, ImageOps

import cv2

from sklearn.utils import class_weight, shuffle

from keras.losses import binary_crossentropy

from keras.applications.resnet50 import preprocess_input

import keras.backend as K

import tensorflow as tf

from sklearn.metrics import f1_score, fbeta_score

from keras.utils import Sequence

from keras.utils import to_categorical

from sklearn.model_selection import train_test_split

WORKERS = 2

CHANNEL = 3

import warnings

warnings.filterwarnings("ignore")

IMG_SIZE = 512

NUM_CLASSES = 5

SEED = 77

TRAIN_NUM = 1000 # use 1000 when you just want to explore new idea, use -1 for full train
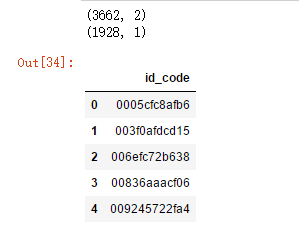
df_train = pd.read_csv('F:\\kaggleDataSet\\diabeticRetinopathy\\trainLabels19.csv')

df_test = pd.read_csv('F:\\kaggleDataSet\\diabeticRetinopathy\\testImages19.csv')

x = df_train['id_code']

y = df_train['diagnosis']

x, y = shuffle(x, y, random_state=SEED)
train_x, valid_x, train_y, valid_y = train_test_split(x, y, test_size=0.15,stratify=y, random_state=SEED)

print(train_x.shape, train_y.shape, valid_x.shape, valid_y.shape)

train_y.hist()

valid_y.hist()

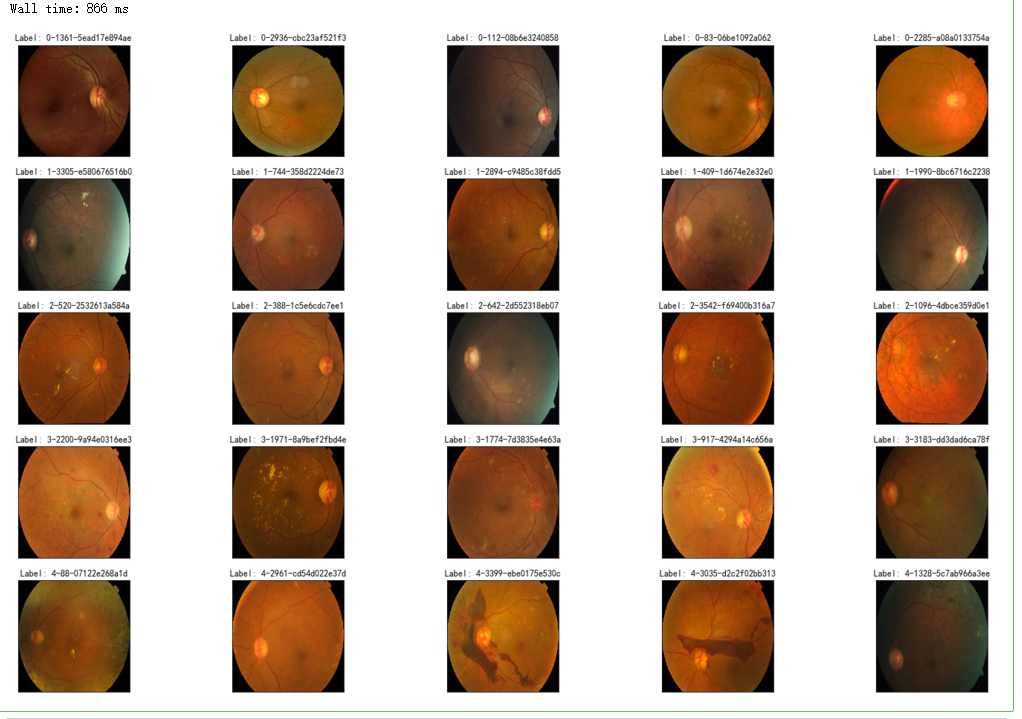
%%time

fig = plt.figure(figsize=(25, 16))

# display 10 images from each class

for class_id in sorted(train_y.unique()):

    for i, (idx, row) in enumerate(df_train.loc[df_train['diagnosis'] == class_id].sample(5, random_state=SEED).iterrows()):

        ax = fig.add_subplot(5, 5, class_id * 5 + i + 1, xticks=[], yticks=[])

        path="F:\\kaggleDataSet\\diabeticRetinopathy\\resized train 19\\"+str(row['id_code'])+".jpg"

        image = cv2.imread(path)

        image = cv2.cvtColor(image, cv2.COLOR_BGR2RGB)

        image = cv2.resize(image, (IMG_SIZE, IMG_SIZE))

        plt.imshow(image)

        ax.set_title('Label: %d-%d-%s' % (class_id, idx, row['id_code']) )
%%time

fig = plt.figure(figsize=(25, 16))

for class_id in sorted(train_y.unique()):

    for i, (idx, row) in enumerate(df_train.loc[df_train['diagnosis'] == class_id].sample(5, random_state=SEED).iterrows()):

        ax = fig.add_subplot(5, 5, class_id * 5 + i + 1, xticks=[], yticks=[])

        path="F:\\kaggleDataSet\\diabeticRetinopathy\\resized train 19\\"+str(row['id_code'])+".jpg"

        image = cv2.imread(path)

        image = cv2.cvtColor(image, cv2.COLOR_BGR2GRAY)

#         image=cv2.addWeighted ( image, 0 , cv2.GaussianBlur( image , (0 ,0 ) , 10) ,-4 ,128)

        image = cv2.resize(image, (IMG_SIZE, IMG_SIZE))

        plt.imshow(image, cmap='gray')

        ax.set_title('Label: %d-%d-%s' % (class_id, idx, row['id_code']) )

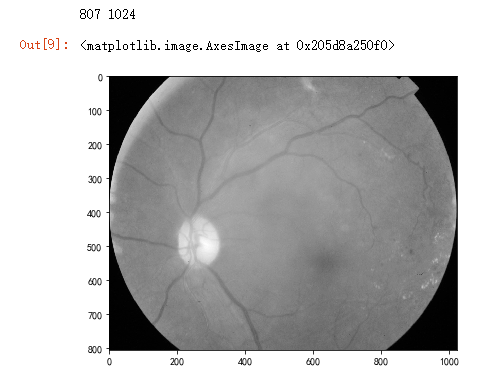
dpi = 80 #inch # path=f"../input/aptos2019-blindness-detection/train_images/5c7ab966a3ee.png" # notice upper part
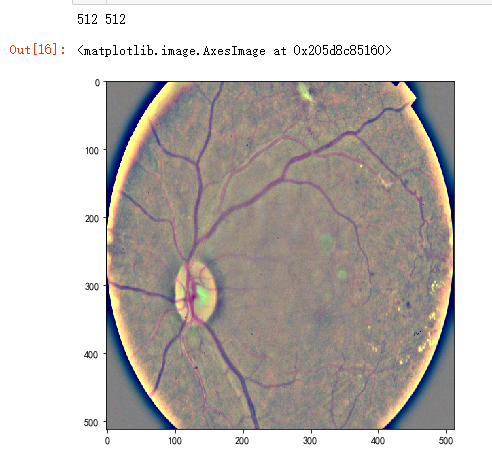
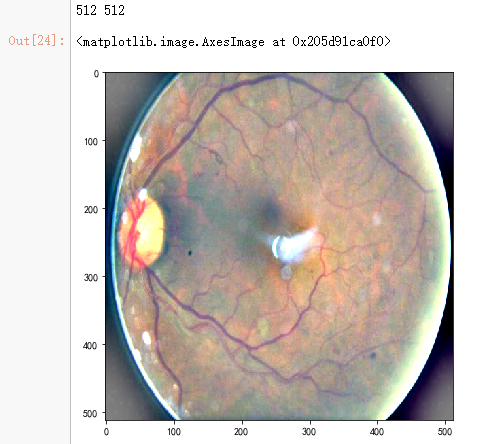
path="F:\\kaggleDataSet\\diabeticRetinopathy\\resized train 19\\cd54d022e37d.jpg" # lower-right, this still looks not so severe, can be class3
image = cv2.imread(path)
image = cv2.cvtColor(image, cv2.COLOR_BGR2GRAY)
height, width = image.shape
print(height, width) SCALE=2
figsize = (width / float(dpi))/SCALE, (height / float(dpi))/SCALE fig = plt.figure(figsize=figsize)
plt.imshow(image, cmap='gray')
%%time

fig = plt.figure(figsize=(25, 16))

for class_id in sorted(train_y.unique()):

    for i, (idx, row) in enumerate(df_train.loc[df_train['diagnosis'] == class_id].sample(5, random_state=SEED).iterrows()):

        ax = fig.add_subplot(5, 5, class_id * 5 + i + 1, xticks=[], yticks=[])

        path="F:\\kaggleDataSet\\diabeticRetinopathy\\resized train 19\\"+str(row['id_code'])+".jpg"

        image = cv2.imread(path)

        image = cv2.cvtColor(image, cv2.COLOR_BGR2GRAY)

#         image = cv2.cvtColor(image, cv2.COLOR_BGR2RGB)

        image = cv2.resize(image, (IMG_SIZE, IMG_SIZE))

        image=cv2.addWeighted ( image,4, cv2.GaussianBlur( image , (0,0) , IMG_SIZE/10) ,-4 ,128) # the trick is to add this line

        plt.imshow(image, cmap='gray')

        ax.set_title('Label: %d-%d-%s' % (class_id, idx, row['id_code']) )

def crop_image1(img,tol=7):

    # img is image data

    # tol  is tolerance

    mask = img>tol

    return img[np.ix_(mask.any(1),mask.any(0))]

def crop_image_from_gray(img,tol=7):

    if img.ndim ==2:

        mask = img>tol

        return img[np.ix_(mask.any(1),mask.any(0))]

    elif img.ndim==3:

        gray_img = cv2.cvtColor(img, cv2.COLOR_RGB2GRAY)

        mask = gray_img>tol

        check_shape = img[:,:,0][np.ix_(mask.any(1),mask.any(0))].shape[0]

        if (check_shape == 0): # image is too dark so that we crop out everything,

            return img # return original image

        else:

            img1=img[:,:,0][np.ix_(mask.any(1),mask.any(0))]

            img2=img[:,:,1][np.ix_(mask.any(1),mask.any(0))]

            img3=img[:,:,2][np.ix_(mask.any(1),mask.any(0))]

    #         print(img1.shape,img2.shape,img3.shape)

            img = np.stack([img1,img2,img3],axis=-1)

    #         print(img.shape)

        return img
def load_ben_color(path, sigmaX=10):

    image = cv2.imread(path)

    image = cv2.cvtColor(image, cv2.COLOR_BGR2RGB)

    image = crop_image_from_gray(image)

    image = cv2.resize(image, (IMG_SIZE, IMG_SIZE))

    image=cv2.addWeighted ( image,4, cv2.GaussianBlur( image , (0,0) , sigmaX) ,-4 ,128)

    return image
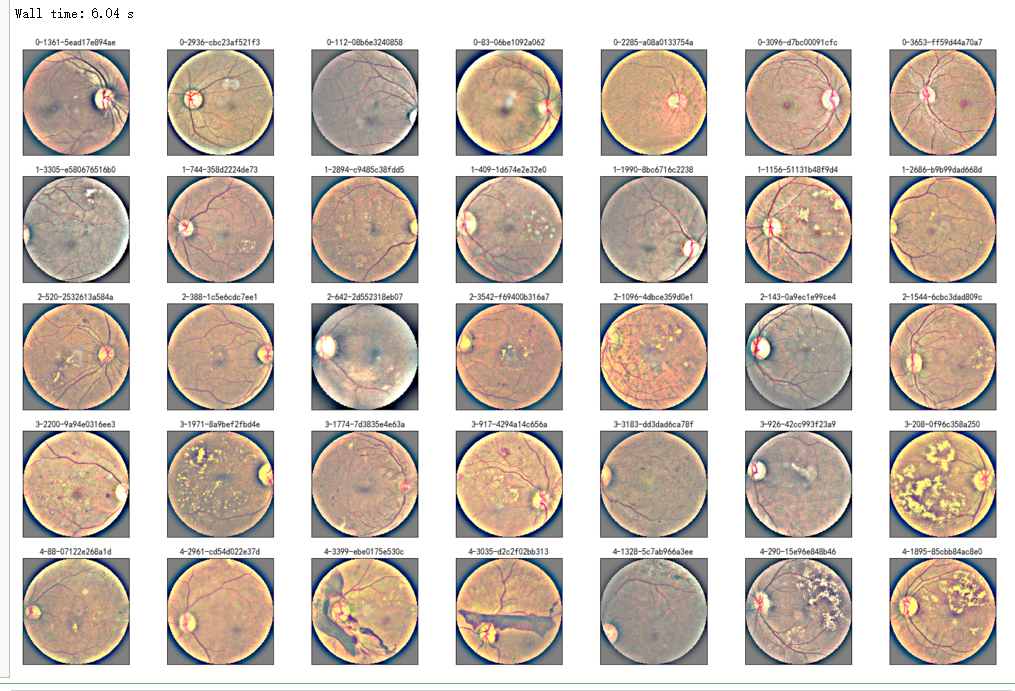
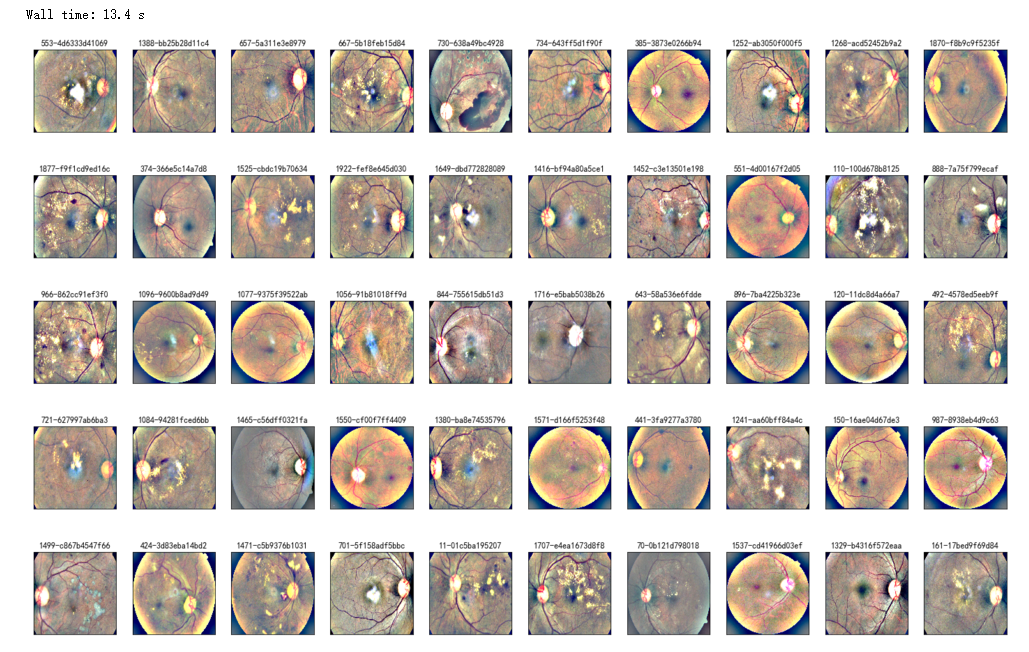
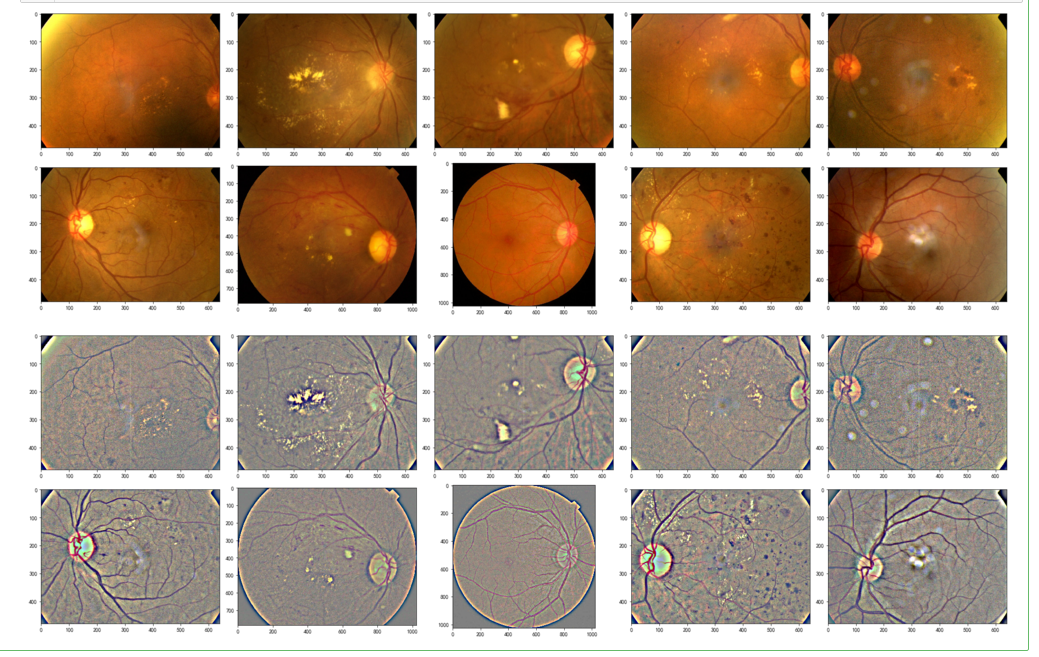
%%time

NUM_SAMP=7

fig = plt.figure(figsize=(25, 16))

for class_id in sorted(train_y.unique()):

    for i, (idx, row) in enumerate(df_train.loc[df_train['diagnosis'] == class_id].sample(NUM_SAMP, random_state=SEED).iterrows()):

        ax = fig.add_subplot(5, NUM_SAMP, class_id * NUM_SAMP + i + 1, xticks=[], yticks=[])

        path="F:\\kaggleDataSet\\diabeticRetinopathy\\resized train 19\\"+str(row['id_code'])+".jpg"

        image = load_ben_color(path,sigmaX=30)

        plt.imshow(image)

        ax.set_title('%d-%d-%s' % (class_id, idx, row['id_code']) )

def circle_crop(img, sigmaX=10):

    """

    Create circular crop around image centre

    """

    img = cv2.imread(img)

    img = crop_image_from_gray(img)

    img = cv2.cvtColor(img, cv2.COLOR_BGR2RGB)

    height, width, depth = img.shape

    x = int(width/2)

    y = int(height/2)

    r = np.amin((x,y))

    circle_img = np.zeros((height, width), np.uint8)

    cv2.circle(circle_img, (x,y), int(r), 1, thickness=-1)

    img = cv2.bitwise_and(img, img, mask=circle_img)

    img = crop_image_from_gray(img)

    img=cv2.addWeighted ( img,4, cv2.GaussianBlur( img , (0,0) , sigmaX) ,-4 ,128)

    return img
%%time

## try circle crop

NUM_SAMP=7

fig = plt.figure(figsize=(25, 16))

for class_id in sorted(train_y.unique()):

    for i, (idx, row) in enumerate(df_train.loc[df_train['diagnosis'] == class_id].sample(NUM_SAMP, random_state=SEED).iterrows()):

        ax = fig.add_subplot(5, NUM_SAMP, class_id * NUM_SAMP + i + 1, xticks=[], yticks=[])

        path="F:\\kaggleDataSet\\diabeticRetinopathy\\resized train 19\\"+str(row['id_code'])+".jpg"

        image = circle_crop(path,sigmaX=30)

        plt.imshow(image)

        ax.set_title('%d-%d-%s' % (class_id, idx, row['id_code']) )
dpi = 80 #inch

path="F:\\kaggleDataSet\\diabeticRetinopathy\\resized train 19\\cd54d022e37d.jpg"

image = load_ben_color(path,sigmaX=10)

height, width = IMG_SIZE, IMG_SIZE

print(height, width)

SCALE=1

figsize = (width / float(dpi))/SCALE, (height / float(dpi))/SCALE

fig = plt.figure(figsize=figsize)

plt.imshow(image, cmap='gray')
%%time

NUM_SAMP=10

fig = plt.figure(figsize=(25, 16))

for jj in range(5):

    for i, (idx, row) in enumerate(df_test.sample(NUM_SAMP,random_state=SEED+jj).iterrows()):

        ax = fig.add_subplot(5, NUM_SAMP, jj * NUM_SAMP + i + 1, xticks=[], yticks=[])

        path="F:\\kaggleDataSet\\diabeticRetinopathy\\resized test 19\\"+str(row['id_code'])+".jpg"

        image = load_ben_color(path,sigmaX=30)

        plt.imshow(image)

        ax.set_title('%d-%s' % (idx, row['id_code']) )

%%time

NUM_SAMP=10

fig = plt.figure(figsize=(25, 16))

for jj in range(5):

    for i, (idx, row) in enumerate(df_test.sample(NUM_SAMP,random_state=SEED+jj).iterrows()):

        ax = fig.add_subplot(5, NUM_SAMP, jj * NUM_SAMP + i + 1, xticks=[], yticks=[])

        path="F:\\kaggleDataSet\\diabeticRetinopathy\\resized test 19\\"+str(row['id_code'])+".jpg"

        image = load_ben_color(path,sigmaX=50)

        plt.imshow(image, cmap='gray')

        ax.set_title('%d-%s' % (idx, row['id_code']) )
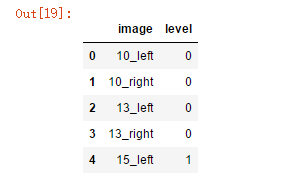
df_old = pd.read_csv('F:\\kaggleDataSet\\diabeticRetinopathy\\trainLabels.csv')

df_old.head()
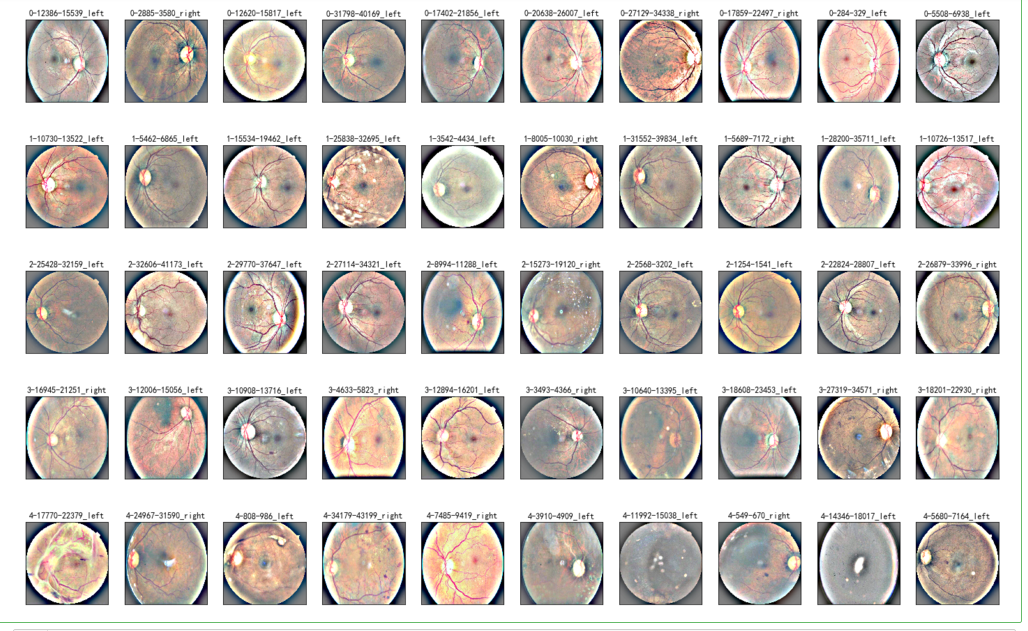
NUM_SAMP=10

fig = plt.figure(figsize=(25, 16))

for class_id in sorted(train_y.unique()):

    for i, (idx, row) in enumerate(df_old.loc[df_old['level'] == class_id].sample(NUM_SAMP, random_state=SEED).iterrows()):

        ax = fig.add_subplot(5, NUM_SAMP, class_id * NUM_SAMP + i + 1, xticks=[], yticks=[])

        path="F:\\kaggleDataSet\\diabeticRetinopathy\\resized_train\\"+row['image']+".jpeg"

        image = load_ben_color(path,sigmaX=30)

        plt.imshow(image)

        ax.set_title('%d-%d-%s' % (class_id, idx, row['image']) )
NUM_SAMP=10

fig = plt.figure(figsize=(25, 16))

for class_id in sorted(train_y.unique()):

    for i, (idx, row) in enumerate(df_old.loc[df_old['level'] == class_id].sample(NUM_SAMP, random_state=SEED).iterrows()):

        ax = fig.add_subplot(5, NUM_SAMP, class_id * NUM_SAMP + i + 1, xticks=[], yticks=[])

        path="F:\\kaggleDataSet\\diabeticRetinopathy\\resized_train\\"+row['image']+".jpeg"

        image = cv2.imread(path)

        image = cv2.cvtColor(image, cv2.COLOR_BGR2RGB)

        image = cv2.resize(image, (IMG_SIZE, IMG_SIZE))

        plt.imshow(image, cmap='gray')

        ax.set_title('%d-%d-%s' % (class_id, idx, row['image']) )

dpi = 80 #inch

path=f"F:\\kaggleDataSet\\diabeticRetinopathy\\resized_train\\31590_right.jpeg" # too many vessels?

image = load_ben_color(path,sigmaX=30)

# image = cv2.imread(path)

# image = cv2.cvtColor(image, cv2.COLOR_BGR2GRAY)

# image = crop_image1(image)

# image = cv2.resize(image, (IMG_SIZE, IMG_SIZE))

# image=cv2.addWeighted ( image,4, cv2.GaussianBlur( image , (0,0) , IMG_SIZE/10) ,-4 ,128)

height, width = IMG_SIZE, IMG_SIZE

print(height, width)

SCALE=1

figsize = (width / float(dpi))/SCALE, (height / float(dpi))/SCALE

fig = plt.figure(figsize=figsize)

plt.imshow(image, cmap='gray')
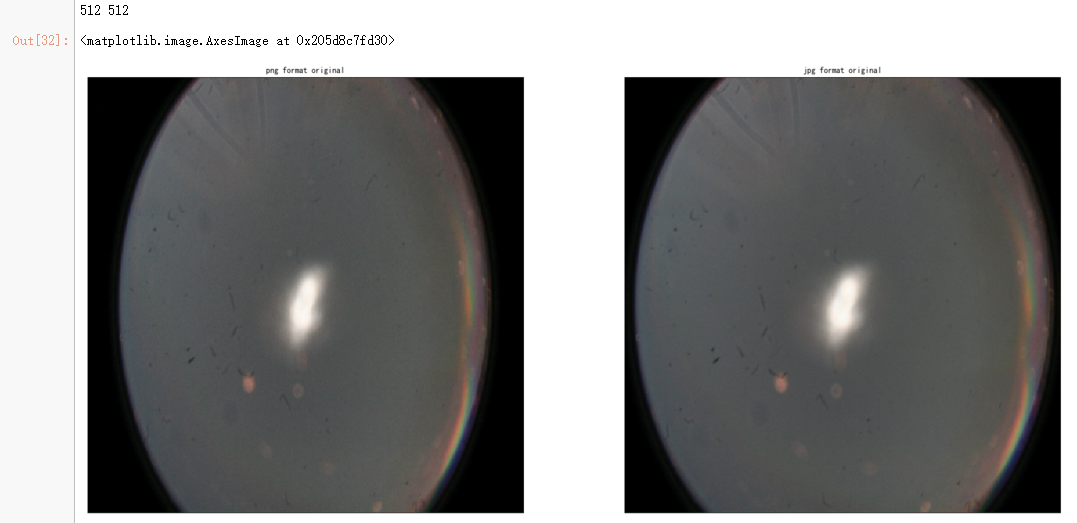
dpi = 80 #inch

path_jpg=f"F:\\kaggleDataSet\\diabeticRetinopathy\\resized_train_cropped\\18017_left.jpeg" # too many vessels?

path_png=f"F:\\kaggleDataSet\\diabeticRetinopathy\\rescaled_train_896\\18017_left.png" # details are lost

image = cv2.imread(path_png)

image = cv2.cvtColor(image, cv2.COLOR_BGR2RGB)

image = cv2.resize(image, (IMG_SIZE, IMG_SIZE))

image2 =  cv2.imread(path_jpg)

image2 = cv2.cvtColor(image2, cv2.COLOR_BGR2RGB)

image2 = cv2.resize(image2, (IMG_SIZE, IMG_SIZE))

height, width = IMG_SIZE, IMG_SIZE

print(height, width)

SCALE=1/4

figsize = (width / float(dpi))/SCALE, (height / float(dpi))/SCALE

fig = plt.figure(figsize=figsize)

ax = fig.add_subplot(2, 2, 1, xticks=[], yticks=[])

ax.set_title('png format original' )

plt.imshow(image, cmap='gray')

ax = fig.add_subplot(2, 2, 2, xticks=[], yticks=[])

ax.set_title('jpg format original' )

plt.imshow(image2, cmap='gray')

image = load_ben_color(path_png,sigmaX=30)

image2 = load_ben_color(path_jpg,sigmaX=30)

ax = fig.add_subplot(2, 2, 3, xticks=[], yticks=[])

ax.set_title('png format transformed' )

plt.imshow(image, cmap='gray')

ax = fig.add_subplot(2, 2, 4, xticks=[], yticks=[])

ax.set_title('jpg format transformed' )

plt.imshow(image2, cmap='gray')

import json

import math

import os

import cv2

from PIL import Image

import numpy as np

from keras import layers

from keras.applications import DenseNet121

from keras.callbacks import Callback, ModelCheckpoint

from keras.preprocessing.image import ImageDataGenerator

from keras.models import Sequential

from keras.optimizers import Adam

import matplotlib.pyplot as plt

import pandas as pd

from sklearn.model_selection import train_test_split

from sklearn.metrics import cohen_kappa_score, accuracy_score

import scipy

from tqdm import tqdm

%matplotlib inline
train_df = pd.read_csv('F:\\kaggleDataSet\\diabeticRetinopathy\\trainLabels19.csv')

test_df = pd.read_csv('F:\\kaggleDataSet\\diabeticRetinopathy\\testImages19.csv')

print(train_df.shape)

print(test_df.shape)

test_df.head()
def get_pad_width(im, new_shape, is_rgb=True):

    pad_diff = new_shape - im.shape[0], new_shape - im.shape[1]

    t, b = math.floor(pad_diff[0]/2), math.ceil(pad_diff[0]/2)

    l, r = math.floor(pad_diff[1]/2), math.ceil(pad_diff[1]/2)

    if is_rgb:

        pad_width = ((t,b), (l,r), (0, 0))

    else:

        pad_width = ((t,b), (l,r))

    return pad_width

def preprocess_image(image_path, desired_size=224):

    im = Image.open(image_path)

    im = im.resize((desired_size, )*2, resample=Image.LANCZOS)

    return im
N = test_df.shape[0]

x_test = np.empty((N, 224, 224, 3), dtype=np.uint8)

for i, image_id in enumerate(tqdm(test_df['id_code'])):

    x_test[i, :, :, :] = preprocess_image("F:\\kaggleDataSet\\diabeticRetinopathy\\resized test 19\\"+str(image_id)+".jpg")

# model.summary()

def load_image_ben_orig(path,resize=True,crop=False,norm255=True,keras=False):

    image = cv2.imread(path)

    image = cv2.cvtColor(image, cv2.COLOR_BGR2RGB)

    image=cv2.addWeighted( image,4, cv2.GaussianBlur( image , (0,0) ,  10) ,-4 ,128)

    if norm255:

        return image/255

    elif keras:

        #see https://github.com/keras-team/keras-applications/blob/master/keras_applications/imagenet_utils.py for mode

        #see https://github.com/keras-team/keras-applications/blob/master/keras_applications/xception.py for inception,xception mode

        #the use of tf based preprocessing (- and / by 127 respectively) will results in [-1,1] so it will not visualize correctly (directly)

        image = np.expand_dims(image, axis=0)

        return preprocess_input(image)[0]

    else:

        return image.astype(np.int16)

    return image

def transform_image_ben(img,resize=True,crop=False,norm255=True,keras=False):

    image=cv2.addWeighted( img,4, cv2.GaussianBlur( img , (0,0) ,  10) ,-4 ,128)

    if norm255:

        return image/255

    elif keras:

        image = np.expand_dims(image, axis=0)

        return preprocess_input(image)[0]

    else:

        return image.astype(np.int16)

    return image
def display_samples(df, columns=5, rows=2, Ben=True):

    fig=plt.figure(figsize=(5*columns, 4*rows))

    for i in range(columns*rows):

        image_path = df.loc[i,'id_code']

        path = f"F:\\kaggleDataSet\\diabeticRetinopathy\\resized test 19\\"+str(image_path)+".jpg"

        if Ben:

            img = load_image_ben_orig(path)

        else:

            img = cv2.imread(path)

            img = cv2.cvtColor(img, cv2.COLOR_BGR2RGB)

        fig.add_subplot(rows, columns, i+1)

        plt.imshow(img)

    plt.tight_layout()

display_samples(test_df, Ben=False)

display_samples(test_df, Ben=True)
from keras import layers

from keras.models import Model

import keras.backend as K
K.clear_session()

densenet = DenseNet121(weights=None,include_top=False,input_shape=(None,None,3))
GAP_layer = layers.GlobalAveragePooling2D()

drop_layer = layers.Dropout(0.5)

dense_layer = layers.Dense(5, activation='sigmoid', name='final_output')
def build_model_sequential():

    model = Sequential()

    model.add(densenet)

    model.add(GAP_layer)

    model.add(drop_layer)

    model.add(dense_layer)

    return model
modelA = build_model_sequential()

modelA.load_weights('F:\\kaggleDataSet\\diabeticRetinopathy\\dense_xhlulu_731.h5')

modelA.summary()
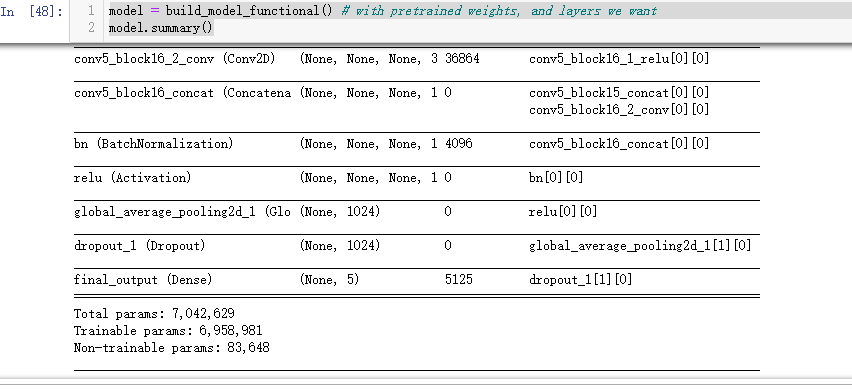
model = build_model_functional() # with pretrained weights, and layers we want

model.summary()
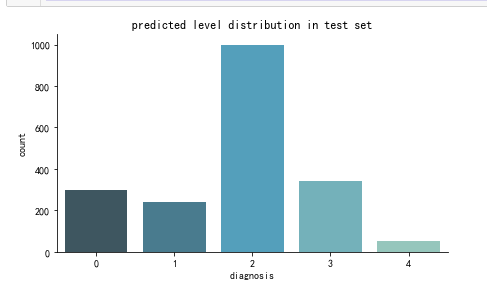
y_test = model.predict(x_test) > 0.5

y_test = y_test.astype(int).sum(axis=1) - 1
import seaborn as sns

import cv2

SIZE=224

def create_pred_hist(pred_level_y,title='NoTitle'):

    results = pd.DataFrame({'diagnosis':pred_level_y})

    f, ax = plt.subplots(figsize=(7, 4))

    ax = sns.countplot(x="diagnosis", data=results, palette="GnBu_d")

    sns.despine()

    plt.title(title)

    plt.show()

create_pred_hist(y_test,title='predicted level distribution in test set')
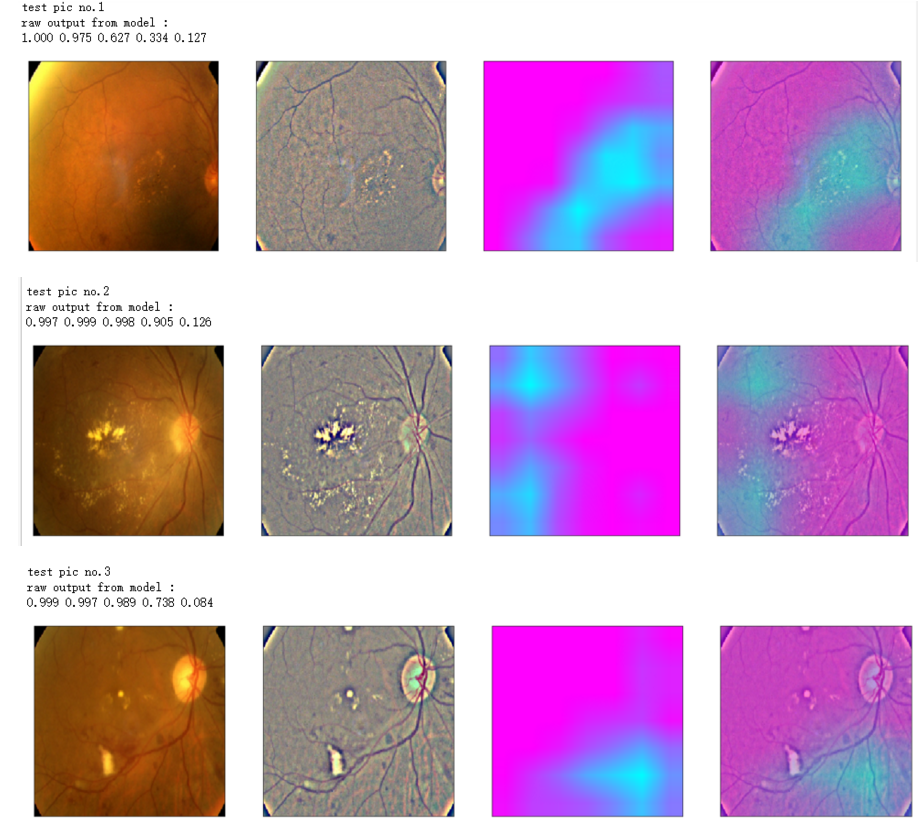
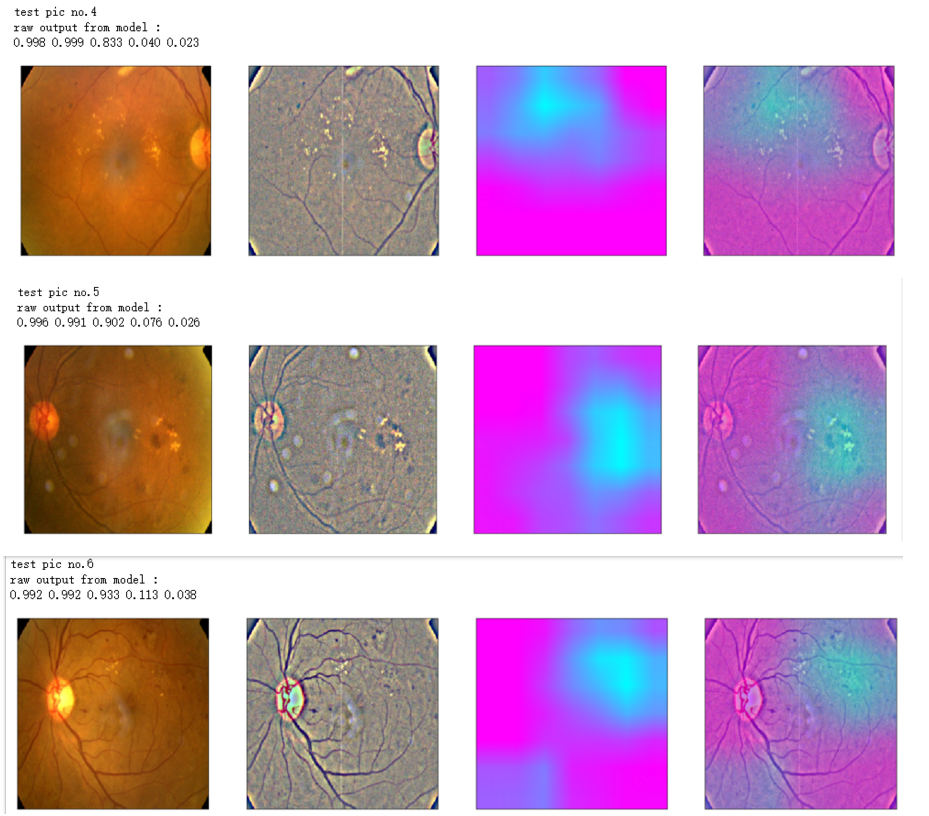
def gen_heatmap_img(img, model0, layer_name='last_conv_layer',viz_img=None,orig_img=None):
preds_raw = model0.predict(img[np.newaxis])
preds = preds_raw > 0.5 # use the same threshold as @xhlulu original kernel
class_idx = (preds.astype(int).sum(axis=1) - 1)[0]
class_output_tensor = model0.output[:, class_idx] viz_layer = model0.get_layer(layer_name)
grads = K.gradients(class_output_tensor ,viz_layer.output)[0] # gradients of viz_layer wrt output_tensor of predicted class
pooled_grads=K.mean(grads,axis=(0,1,2))
iterate=K.function([model0.input],[pooled_grads, viz_layer.output[0]])
pooled_grad_value, viz_layer_out_value = iterate([img[np.newaxis]])
for i in range(pooled_grad_value.shape[0]):
viz_layer_out_value[:,:,i] *= pooled_grad_value[i]
heatmap = np.mean(viz_layer_out_value, axis=-1)
heatmap = np.maximum(heatmap,0)
heatmap /= np.max(heatmap)
viz_img=cv2.resize(viz_img,(img.shape[1],img.shape[0]))
heatmap=cv2.resize(heatmap,(viz_img.shape[1],viz_img.shape[0]))
heatmap_color = cv2.applyColorMap(np.uint8(heatmap*255), cv2.COLORMAP_SPRING)/255
heated_img = heatmap_color*0.5 + viz_img*0.5
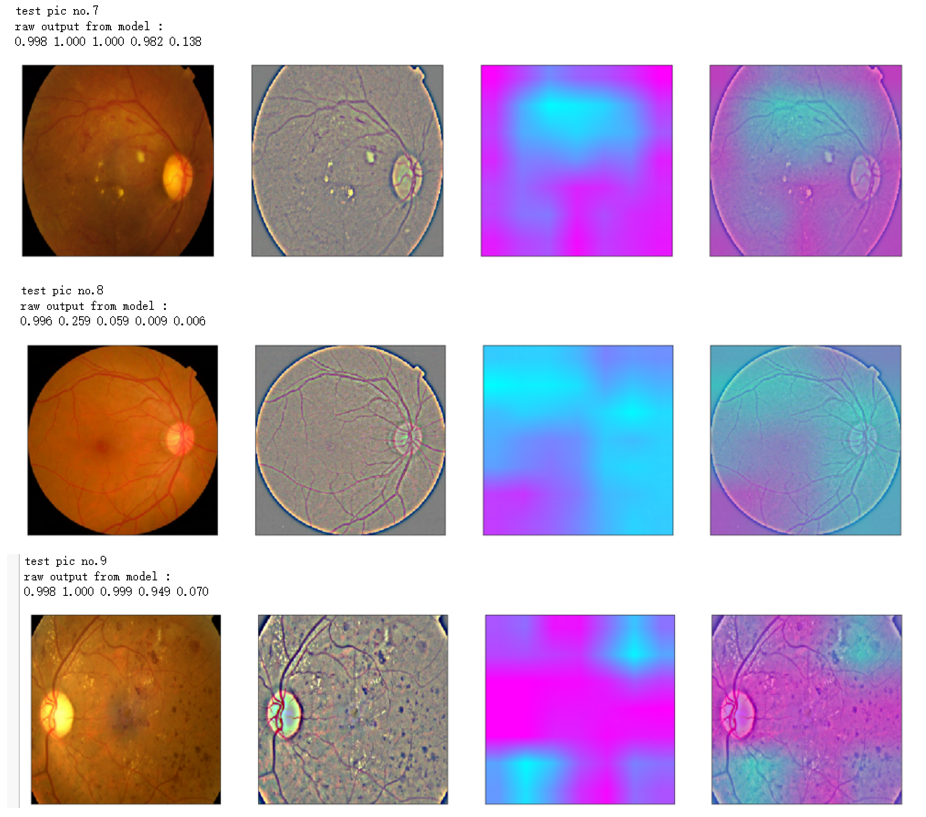
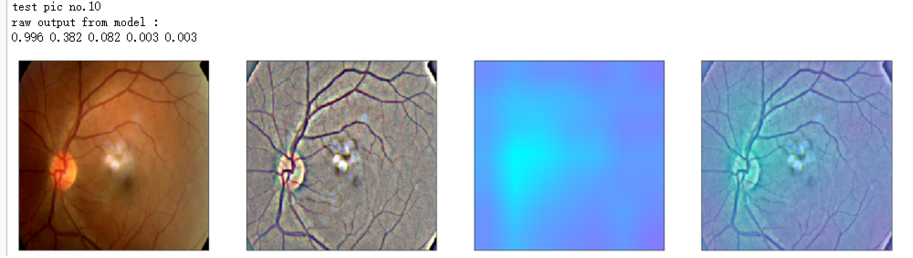
print('raw output from model : ')
print_pred(preds_raw)
if orig_img is None:
show_Nimages([img,viz_img,heatmap_color,heated_img])
else:
show_Nimages([orig_img,img,viz_img,heatmap_color,heated_img])
plt.show()
return heated_img
def show_image(image,figsize=None,title=None):

    if figsize is not None:

        fig = plt.figure(figsize=figsize)

    if image.ndim == 2:

        plt.imshow(image,cmap='gray')

    else:

        plt.imshow(image)

    if title is not None:

        plt.title(title)

def show_Nimages(imgs,scale=1):

    N=len(imgs)

    fig = plt.figure(figsize=(25/scale, 16/scale))

    for i, img in enumerate(imgs):

        ax = fig.add_subplot(1, N, i + 1, xticks=[], yticks=[])

        show_image(img)

def print_pred(array_of_classes):

    xx = array_of_classes

    s1,s2 = xx.shape

    for i in range(s1):

        for j in range(s2):

            print('%.3f ' % xx[i,j],end='')

        print('')
NUM_SAMP=10

SEED=77

layer_name = 'relu' #'conv5_block16_concat'

for i, (idx, row) in enumerate(test_df[:NUM_SAMP].iterrows()):

    path=f"F:\\kaggleDataSet\\diabeticRetinopathy\\resized test 19\\"+str(row["id_code"])+".jpg"

    ben_img = load_image_ben_orig(path)

    input_img = np.empty((1,224, 224, 3), dtype=np.uint8)

    input_img[0,:,:,:] = preprocess_image(path)

    print('test pic no.%d' % (i+1))

    _ = gen_heatmap_img(input_img[0],model, layer_name=layer_name,viz_img=ben_img)
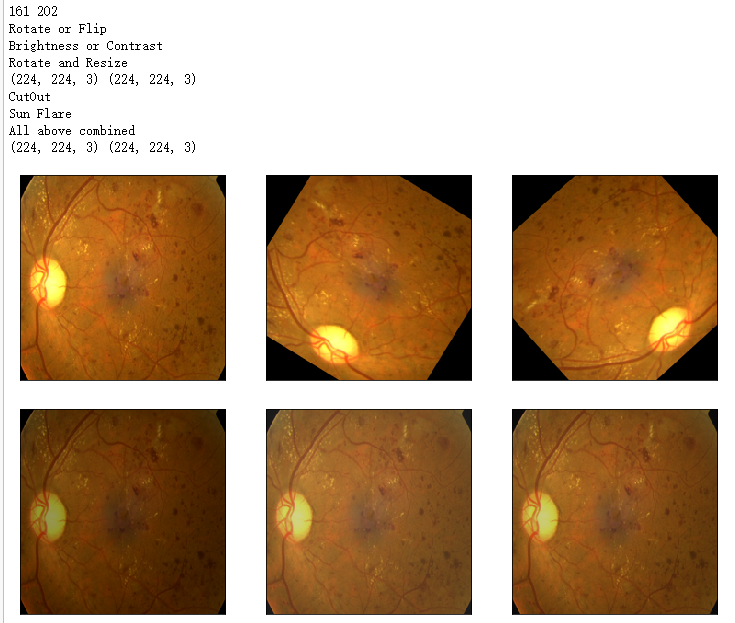
from albumentations import *
import time IMG_SIZE = (224,224) '''Use case from https://www.kaggle.com/alexanderliao/image-augmentation-demo-with-albumentation/'''
def albaugment(aug0, img):
return aug0(image=img)['image']
idx=8
image1=x_test[idx] '''1. Rotate or Flip'''
aug1 = OneOf([Rotate(p=0.99, limit=160, border_mode=0,value=0), Flip(p=0.5)],p=1) '''2. Adjust Brightness or Contrast'''
aug2 = RandomBrightnessContrast(brightness_limit=0.45, contrast_limit=0.45,p=1)
h_min=np.round(IMG_SIZE[1]*0.72).astype(int)
h_max= np.round(IMG_SIZE[1]*0.9).astype(int)
print(h_min,h_max) '''3. Random Crop and then Resize'''
#w2h_ratio = aspect ratio of cropping
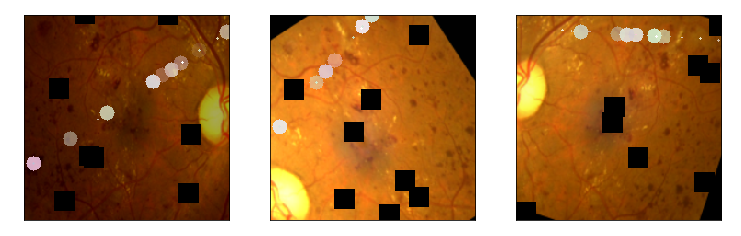
aug3 = RandomSizedCrop((h_min, h_max),IMG_SIZE[1],IMG_SIZE[0], w2h_ratio=IMG_SIZE[0]/IMG_SIZE[1],p=1) '''4. CutOut Augmentation'''
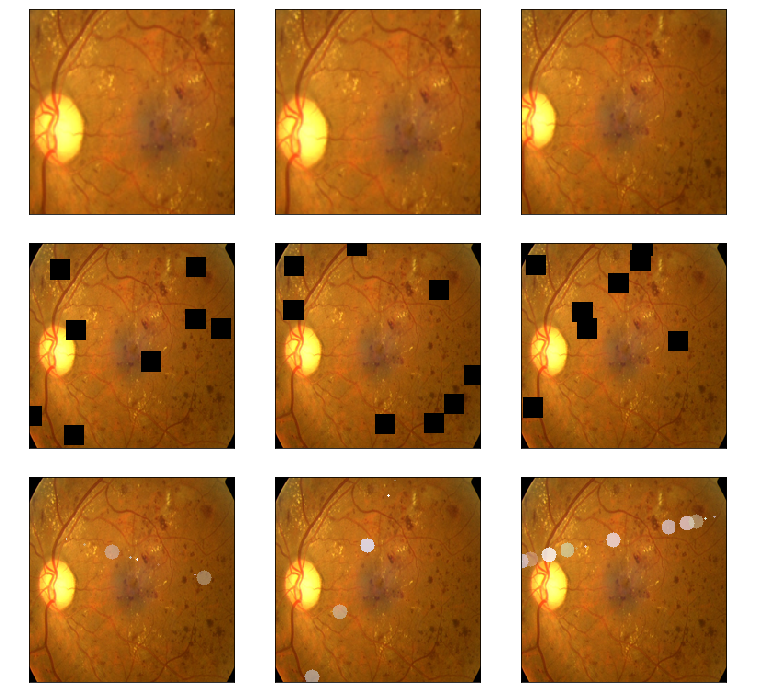
max_hole_size = int(IMG_SIZE[1]/10)
aug4 = Cutout(p=1,max_h_size=max_hole_size,max_w_size=max_hole_size,num_holes=8 )#default num_holes=8 '''5. SunFlare Augmentation'''
aug5 = RandomSunFlare(src_radius=max_hole_size,num_flare_circles_lower=10,num_flare_circles_upper=20,p=1) '''6. Ultimate Augmentation -- combine everything'''
final_aug = Compose([aug1,aug2,aug3,aug4,aug5],p=1) img1 = albaugment(aug1,image1)
img2 = albaugment(aug1,image1)
print('Rotate or Flip')
show_Nimages([image1,img1,img2],scale=2)
# time.sleep(1) img1 = albaugment(aug2,image1)
img2 = albaugment(aug2,image1)
img3 = albaugment(aug2,image1)
print('Brightness or Contrast')
show_Nimages([img3,img1,img2],scale=2)
# time.sleep(1) img1 = albaugment(aug3,image1)
img2 = albaugment(aug3,image1)
img3 = albaugment(aug3,image1)
print('Rotate and Resize')
show_Nimages([img3,img1,img2],scale=2)
print(img1.shape,img2.shape)
# time.sleep(1) img1 = albaugment(aug4,image1)
img2 = albaugment(aug4,image1)
img3 = albaugment(aug4,image1)
print('CutOut')
show_Nimages([img3,img1,img2],scale=2)
# time.sleep(1) img1 = albaugment(aug5,image1)
img2 = albaugment(aug5,image1)
img3 = albaugment(aug5,image1)
print('Sun Flare')
show_Nimages([img3,img1,img2],scale=2)
# time.sleep(1) img1 = albaugment(final_aug,image1)
img2 = albaugment(final_aug,image1)
img3 = albaugment(final_aug,image1)
print('All above combined')
show_Nimages([img3,img1,img2],scale=2)
print(img1.shape,img2.shape)
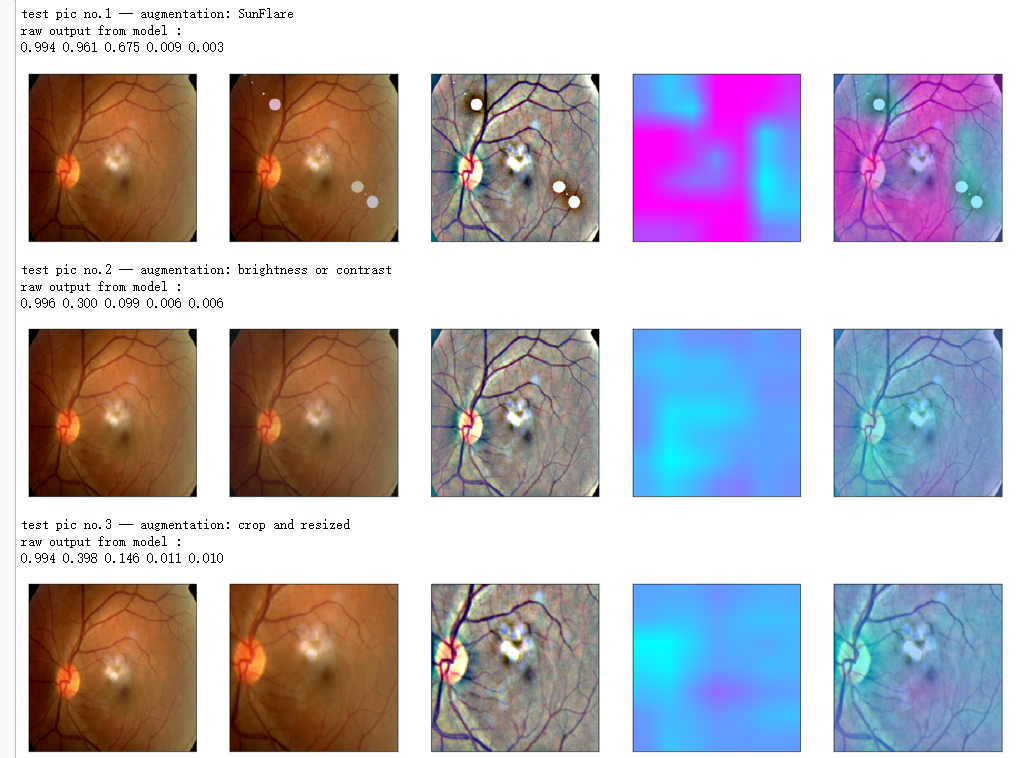
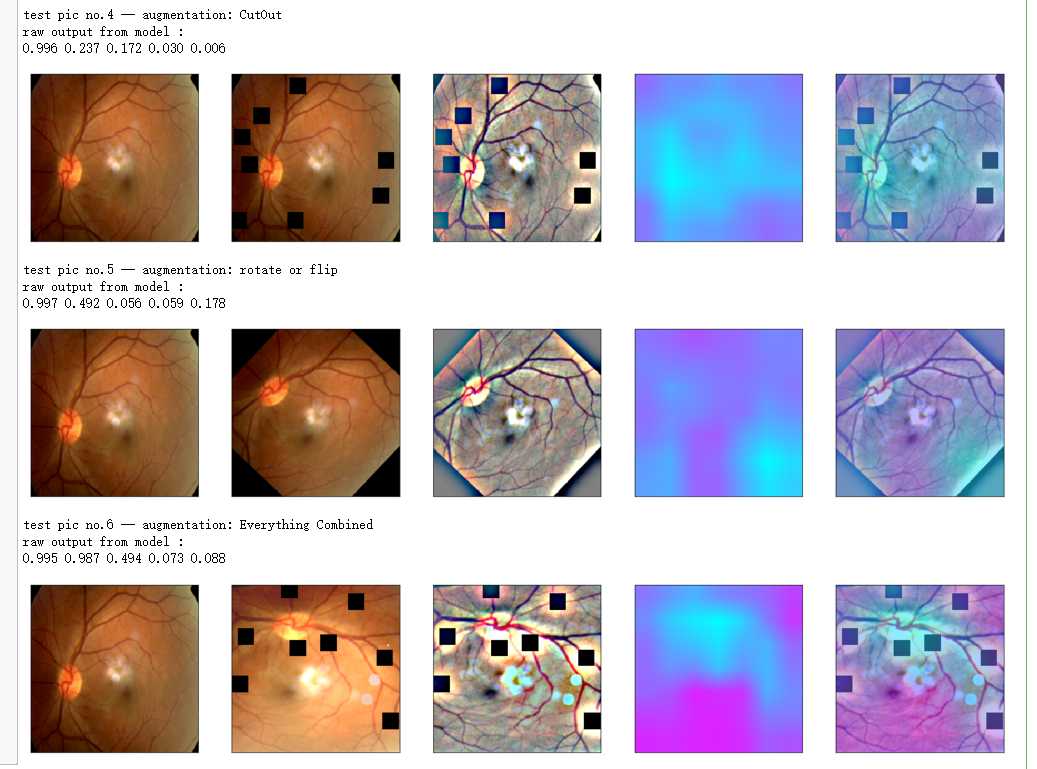
aug_list = [aug5, aug2, aug3, aug4, aug1, final_aug]

aug_name = ['SunFlare', 'brightness or contrast', 'crop and resized', 'CutOut', 'rotate or flip', 'Everything Combined']

idx=8

layer_name = 'relu'

for i in range(len(aug_list)):

    path=f"F:\\kaggleDataSet\\diabeticRetinopathy\\resized test 19\\"+str(row["id_code"])+".jpg"

    input_img = np.empty((1,224, 224, 3), dtype=np.uint8)

    input_img[0,:,:,:] = preprocess_image(path)

    aug_img = albaugment(aug_list[i],input_img[0,:,:,:])

    ben_img = transform_image_ben(aug_img)

    print('test pic no.%d -- augmentation: %s' % (i+1, aug_name[i]))

    _ = gen_heatmap_img(aug_img,model, layer_name=layer_name,viz_img=ben_img,orig_img=input_img[0])
吴裕雄--天生自然 PYTHON数据分析:糖尿病视网膜病变数据分析(完整版)的更多相关文章
- 吴裕雄--天生自然 PYTHON数据分析:所有美国股票和etf的历史日价格和成交量分析
# This Python 3 environment comes with many helpful analytics libraries installed # It is defined by ...
- 吴裕雄--天生自然 python数据分析:健康指标聚集分析(健康分析)
# This Python 3 environment comes with many helpful analytics libraries installed # It is defined by ...
- 吴裕雄--天生自然 python数据分析:葡萄酒分析
# import pandas import pandas as pd # creating a DataFrame pd.DataFrame({'Yes': [50, 31], 'No': [101 ...
- 吴裕雄--天生自然 PYTHON数据分析:人类发展报告——HDI, GDI,健康,全球人口数据数据分析
import pandas as pd # Data analysis import numpy as np #Data analysis import seaborn as sns # Data v ...
- 吴裕雄--天生自然 python数据分析:医疗费数据分析
import numpy as np import pandas as pd import os import matplotlib.pyplot as pl import seaborn as sn ...
- 吴裕雄--天生自然 PYTHON语言数据分析:ESA的火星快车操作数据集分析
import os import numpy as np import pandas as pd from datetime import datetime import matplotlib imp ...
- 吴裕雄--天生自然 python语言数据分析:开普勒系外行星搜索结果分析
import pandas as pd pd.DataFrame({'Yes': [50, 21], 'No': [131, 2]}) pd.DataFrame({'Bob': ['I liked i ...
- 吴裕雄--天生自然 PYTHON数据分析:基于Keras的CNN分析太空深处寻找系外行星数据
#We import libraries for linear algebra, graphs, and evaluation of results import numpy as np import ...
- 吴裕雄--天生自然 python数据分析:基于Keras使用CNN神经网络处理手写数据集
import pandas as pd import numpy as np import matplotlib.pyplot as plt import matplotlib.image as mp ...
随机推荐
- 1、OSI参考模型
网络的层次模型:Core layer (核心层):高速转发,不建议做策略 Distribution layer (分布层,汇聚层):基于策略连接(路由控制,安全策略)Access layer (接入 ...
- VC运行时库/MD、/MDd、/MT、/MTd说明
http://blog.csdn.net/holybin/article/details/26134153 VC运行时库设置:VC项目属性->配置属性->C/C++->代码生成-&g ...
- 01背包与完全背包(dp复习)
01背包和完全背包都是dp入门的经典,我的dp学的十分的水,借此更新博客的机会回顾一下 01背包:给定总容量为maxv的背包,有n件物品,第i件物品的的体积为w[i],价值为v[i],问如何选取才能是 ...
- 初见shell
在写了一段时间的java后,发现要一次性执行多个java很麻烦,因此想到了用shell脚本去调用.但是因为之前没有学过shell,所以一切都是重新开始.在此,简单的记录下意思的基础性知识. 参数相关的 ...
- python库之numpy学习---nonzero()用法
当使用布尔数组直接作为下标对象或者元组下标对象中有布尔数组时,都相当于用nonzero()将布尔数组转换成一组整数数组,然后使用整数数组进行下标运算. nonzeros(a)返回数组a中值不为零的元素 ...
- Centos 7 x64 系统初始化
前言 Hi,小伙伴们,系统初始化是运维工作中重要的一环,它能有效的提升工作效率,并且是标准化规范化的前提:它能省去要用时再去下载的麻烦,另外,还可以避免因未初始化引起的一些故障问题,可谓好处多多.系统 ...
- 《C# 爬虫 破境之道》:第二境 爬虫应用 — 第四节:小说网站采集
之前的章节,我们陆续的介绍了使用C#制作爬虫的基础知识,而且现在也应该比较了解如何制作一只简单的Web爬虫了. 本节,我们来做一个完整的爬虫系统,将之前的零散的东西串联起来,可以作为一个爬虫项目运作流 ...
- 第3章 JDK并发包(一)
3.1 多线程的团队协作:同步控制 3.1.1 synchronized的功能扩展:重入锁 重入锁可以完全替代synchronized关键字. 重入锁使用java.util.concurrent.lo ...
- Window下,Jenkins忘记密码解决方法
没有修改过密码的情况下找回初始密码(或者第一次部署的时候) 进入目录 D:\jenkins\secrets ,找到文件 initialAdminPassword 在jenkins页面,输入登录名adm ...
- NR / 5G - F-OFDM