matplotlib 进阶之origin and extent in imshow
matplotlib教程学习笔记
import numpy as np

import matplotlib.pyplot as plt

from matplotlib.gridspec import GridSpec

def index_to_coordinate(index, extent, origin):

    """Return the pixel center of an index."""

    left, right, bottom, top = extent

    hshift = 0.5 * np.sign(right - left)

    left, right = left + hshift, right - hshift

    vshift = 0.5 * np.sign(top - bottom)

    bottom, top = bottom + vshift, top - vshift

    if origin == 'upper':

        bottom, top = top, bottom

    return {

        "[0, 0]": (left, bottom),

        "[M', 0]": (left, top),

        "[0, N']": (right, bottom),

        "[M', N']": (right, top),

    }[index]

def get_index_label_pos(index, extent, origin, inverted_xindex):

    """

    Return the desired position and horizontal alignment of an index label.

    """

    if extent is None:

        extent = lookup_extent(origin)

    left, right, bottom, top = extent

    x, y = index_to_coordinate(index, extent, origin)

    is_x0 = index[-2:] == "0]"

    halign = 'left' if is_x0 ^ inverted_xindex else 'right'

    hshift = 0.5 * np.sign(left - right)

    x += hshift * (1 if is_x0 else -1)

    return x, y, halign

def get_color(index, data, cmap):

    """Return the data color of an index."""

    val = {

        "[0, 0]": data[0, 0],

        "[0, N']": data[0, -1],

        "[M', 0]": data[-1, 0],

        "[M', N']": data[-1, -1],

    }[index]

    return cmap(val / data.max())

def lookup_extent(origin):

    """Return extent for label positioning when not given explicitly."""

    if origin == 'lower':

        return (-0.5, 6.5, -0.5, 5.5)

    else:

        return (-0.5, 6.5, 5.5, -0.5)

def set_extent_None_text(ax):

    ax.text(3, 2.5, 'equals\nextent=None', size='large',

            ha='center', va='center', color='w')

def plot_imshow_with_labels(ax, data, extent, origin, xlim, ylim):

    """Actually run ``imshow()`` and add extent and index labels."""

    im = ax.imshow(data, origin=origin, extent=extent)

    # extent labels (left, right, bottom, top)

    left, right, bottom, top = im.get_extent()

    if xlim is None or top > bottom:

        upper_string, lower_string = 'top', 'bottom'

    else:

        upper_string, lower_string = 'bottom', 'top'

    if ylim is None or left < right:

        port_string, starboard_string = 'left', 'right'

        inverted_xindex = False

    else:

        port_string, starboard_string = 'right', 'left'

        inverted_xindex = True

    bbox_kwargs = {'fc': 'w', 'alpha': .75, 'boxstyle': "round4"}

    ann_kwargs = {'xycoords': 'axes fraction',

                  'textcoords': 'offset points',

                  'bbox': bbox_kwargs}

    ax.annotate(upper_string, xy=(.5, 1), xytext=(0, -1),

                ha='center', va='top', **ann_kwargs)

    ax.annotate(lower_string, xy=(.5, 0), xytext=(0, 1),

                ha='center', va='bottom', **ann_kwargs)

    ax.annotate(port_string, xy=(0, .5), xytext=(1, 0),

                ha='left', va='center', rotation=90,

                **ann_kwargs)

    ax.annotate(starboard_string, xy=(1, .5), xytext=(-1, 0),

                ha='right', va='center', rotation=-90,

                **ann_kwargs)

    ax.set_title('origin: {origin}'.format(origin=origin))

    # index labels

    for index in ["[0, 0]", "[0, N']", "[M', 0]", "[M', N']"]:

        tx, ty, halign = get_index_label_pos(index, extent, origin,

                                             inverted_xindex)

        facecolor = get_color(index, data, im.get_cmap())

        ax.text(tx, ty, index, color='white', ha=halign, va='center',

                bbox={'boxstyle': 'square', 'facecolor': facecolor})

    if xlim:

        ax.set_xlim(*xlim)

    if ylim:

        ax.set_ylim(*ylim)

def generate_imshow_demo_grid(extents, xlim=None, ylim=None):

    N = len(extents)

    fig = plt.figure(tight_layout=True)

    fig.set_size_inches(6, N * (11.25) / 5)

    gs = GridSpec(N, 5, figure=fig)

    columns = {'label': [fig.add_subplot(gs[j, 0]) for j in range(N)],

               'upper': [fig.add_subplot(gs[j, 1:3]) for j in range(N)],

               'lower': [fig.add_subplot(gs[j, 3:5]) for j in range(N)]}

    x, y = np.ogrid[0:6, 0:7]

    data = x + y

    for origin in ['upper', 'lower']:

        for ax, extent in zip(columns[origin], extents):

            plot_imshow_with_labels(ax, data, extent, origin, xlim, ylim)

    for ax, extent in zip(columns['label'], extents):

        text_kwargs = {'ha': 'right',

                       'va': 'center',

                       'xycoords': 'axes fraction',

                       'xy': (1, .5)}

        if extent is None:

            ax.annotate('None', **text_kwargs)

            ax.set_title('extent=')

        else:

            left, right, bottom, top = extent

            text = ('left: {left:0.1f}\nright: {right:0.1f}\n' +

                    'bottom: {bottom:0.1f}\ntop: {top:0.1f}\n').format(

                        left=left, right=right, bottom=bottom, top=top)

            ax.annotate(text, **text_kwargs)

        ax.axis('off')

    return columns
generate_imshow_demo_grid(extents=[None]);

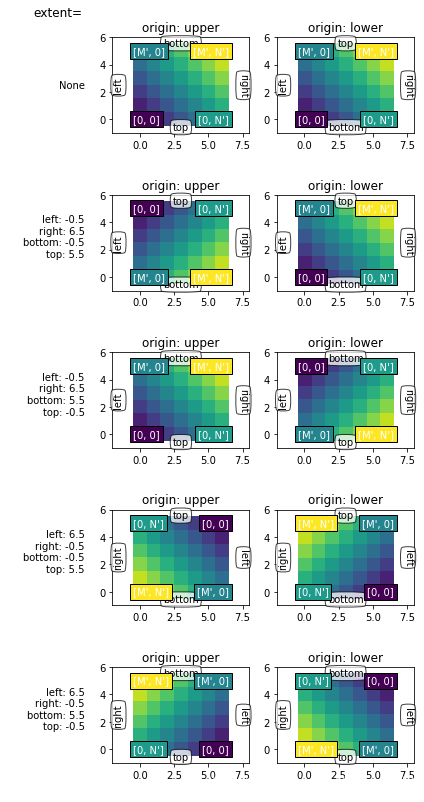
通常来说,对于shape(M, N)来讲,M是沿着竖直方向的,而N是沿着水平方向的。
origin参数觉得了其实位置:
对于 origin="lower":
[0, 0] 在 (left, bottom)位置
[M, 0] 在 (left, upper)位置
[0, N] 在 (right, bottom)位置
[M, N] 在 (right, top) 位置
实际上就是,从左下角往右上角发展
而对于orgin="upper",则是从左上角往右下角发展
显示的extent
extent是控制图片的坐标轴的工具,为(left, right, bottom, top)
就是控制x轴为: left -> right
y轴为: bottom -> top
extents = [(-0.5, 6.5, -0.5, 5.5),

           (-0.5, 6.5, 5.5, -0.5),

           (6.5, -0.5, -0.5, 5.5),

           (6.5, -0.5, 5.5, -0.5)]

columns = generate_imshow_demo_grid(extents)

set_extent_None_text(columns['upper'][1])

set_extent_None_text(columns['lower'][0])

Explicit extent and axes limits
搞不懂了啊,为什么加了limits之后,可以随便转来转去了啊不知道,就这样吧
generate_imshow_demo_grid(extents=[None] + extents,

                          xlim=(-2, 8), ylim=(-1, 6));
matplotlib 进阶之origin and extent in imshow的更多相关文章
- matplotlib 进阶之Tight Layout guide
目录 简单的例子 Use with GridSpec Legend and Annotations Use with AxesGrid1 Colorbar 函数链接 matplotlib教程学习笔记 ...
- 【python】matplotlib进阶
参考文章:https://liam0205.me/2014/09/11/matplotlib-tutorial-zh-cn/ 几个重要对象:图像.子图.坐标轴.记号 figure:图像, subplo ...
- matplotlib 进阶之Constrained Layout Guide
目录 简单的例子 Colorbars Suptitle Legends Padding and Spacing spacing with colobars rcParams Use with Grid ...
- matplotlib 进阶之Customizing Figure Layouts Using GridSpec and Other Functions
目录 对Gridspec的一些精细的调整 利用SubplotSpec fig.add_grdispec; gs.subgridspec 一个利用Subplotspec的复杂例子 函数链接 matplo ...
- matplotlib 进阶之Legend guide
目录 matplotlib.pyplot.legend 方法1自动检测 方法2为现有的Artist添加 方3显示添加图例 控制图例的输入 为一类Artist设置图例 Legend 的位置 loc, b ...
- matplotlib 进阶之Artist tutorial(如何操作Atrist和定制)
目录 基本 plt.figure() fig.add_axes() ax.lines set_xlabel 一个完整的例子 定制你的对象 obj.set(alpha=0.5, zorder=2), o ...
- 基于matplotlib的数据可视化 - 热图imshow
热图: Display an image on the axes. 可以用来比较两个矩阵的相似程度 mp.imshow(z, cmap=颜色映射,origin=垂直轴向) imshow( X, cma ...
- 『Python』matplotlib的imshow用法
热力图是一种数据的图形化表示,具体而言,就是将二维数组中的元素用颜色表示.热力图之所以非常有用,是因为它能够从整体视角上展示数据,更确切的说是数值型数据. 使用imshow()函数可以非常容易地制作热 ...
- matplotlib 入门之Sample plots in Matplotlib
文章目录 Line Plot One figure, a set of subplots Image 展示图片 展示二元正态分布 A sample image Interpolating images ...
随机推荐
- Go知识盲区--闭包
1. 引言 关于闭包的说明,曾在很多篇幅中都有过一些说明,包括Go基础--函数2, go 函数进阶,异常与错误 都有所提到, 但是会发现,好像原理(理论)都懂,但是就是不知道如何使用,或者在看到一些源 ...
- A Child's History of England.14
At first, Elfrida possessed great influence over the young King, but, as he grew older and came of a ...
- ubantu上编辑windows程序
命令简记 cd $GOROOT/src cp -r $GOROOT /root/go1.4 CGO_ENABLED=0 GOOS=windows GOARCH=amd64 ./make.bash 操作 ...
- 【Linux】【Basis】【RHEL】KickStart for RHEL6.8
1. 概念: 自动安装的脚本,这篇文章以RHEL6.8为例 kickstart for RHEL6.8官方教程:https://access.redhat.com/documentation/en-U ...
- String 、StringBuffer、StringBuilder的区别
String:字符串常量 StringBuffer:字符串变量:线程安全的 StringBuilder:字符串变量:线程非安全的 三者执行速度比较:StringBuilder > String ...
- 【C/C++】最长公共子序列(LCS)/动态规划
晴神这个的最巧妙之处,在于用dp[i][0] = dp[0][j] = 0的边界条件 这样从1的下标开始填数组的时候,递推公式dp[i-1][j-1]之类的不会报错 #include <iost ...
- bootstrapTable频繁向后台接口发请求
当bootstrapTable出现这样的问题,是因为查询到的数据行数为空,而后台返回的总行数又不为0时,就会疯狂地往接口发请求
- pipeline when指令
目录 一.简介 二.选项 单独判断 条件组合 一.简介 when指令允许pipeline根据给定的条件,决定是否执行阶段内的步骤.when指令必须至少包含一个条件.when指令除了支持branch判断 ...
- Table.RowCount行列计数…Count(Power Query 之 M 语言)
数据源: 任意五行两列 目标: 计算行数(包括空行) 操作过程: [转换]>[对行进行计数] M公式: = Table.RowCount( 表 ) 扩展: 对表中列进行计数:= Table.C ...
- 可视报表(Project)
<Project2016 企业项目管理实践>张会斌 董方好 编著 原来一直有一个执念,做项目的人电脑上一定要安装Project软件,今天突然知道了,原来领导的电脑上,可以不装,因为,Pro ...