Python数据可视化-seaborn库之countplot
在Python数据可视化中,seaborn较好的提供了图形的一些可视化功效。
seaborn官方文档见链接:http://seaborn.pydata.org/api.html
countplot是seaborn库中分类图的一种,作用是使用条形显示每个分箱器中的观察计数。接下来,对seaborn中的countplot方法进行详细的一个讲解,希望可以帮助到刚入门的同行。
- 导入seaborn库
import seaborn as sns
- 使用countplot
sns.countplot()
countplot方法中必须要x或者y参数,不然就报错。
官方给出的countplot方法及参数:
sns.countplot(x=None, y=None, hue=None, data=None, order=None, hue_order=None, orient=None, color=None, palette=None, saturation=0.75, dodge=True, ax=None, **kwargs)
下面讲解countplot方法中的每一个参数。以泰坦尼克号为例。
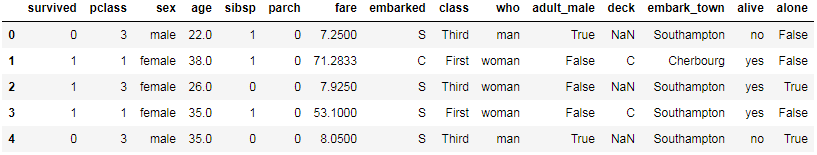
原始数据如下:
 sns.set(style='darkgrid')

 titanic = sns.load_dataset('titanic')

 titanic.head()
x, y, hue : names of variables in ``data`` or vector data, optional. Inputs for plotting long-form data. See examples for interpretation.
- 第一种方式
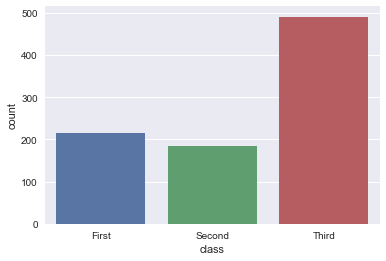
x: x轴上的条形图,以x标签划分统计个数
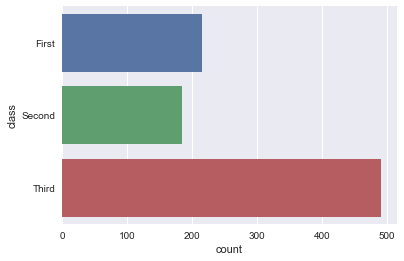
y: y轴上的条形图,以y标签划分统计个数
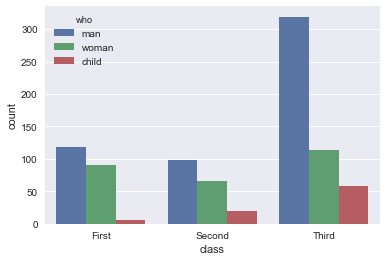
hue: 在x或y标签划分的同时,再以hue标签划分统计个数
sns.countplot(x="class", data=titanic)

sns.countplot(y="class", data=titanic)

sns.countplot(x="class", hue="who", data=titanic)
- 第二种方法
x: x轴上的条形图,直接为series数据
y: y轴上的条形图,直接为series数据
sns.countplot(x=titanic['class'])

sns.countplot(y=titanic['class'])
data : DataFrame, array, or list of arrays, optional. Dataset for plotting.
If ``x`` and ``y`` are absent, this is interpreted as wide-form. Otherwise it is expected to be long-form.
data: DataFrame或array或array列表,用于绘图的数据集,x或y缺失时,data参数为数据集,同时x或y不可缺少,必须要有其中一个。
sns.countplot(x='class', data=titanic)
order, hue_order : lists of strings, optional.Order to plot the categorical levels in, otherwise the levels are inferred from the data objects.
order, hue_order分别是对x或y的字段排序,hue的字段排序。排序的方式为列表。
sns.countplot(x='class', data=titanic, order=['Third', 'Second', 'First'])
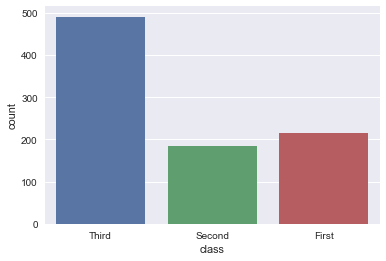
1 sns.countplot(x='class', hue='who', data=titanic, hue_order=['woman', 'man', 'child'])

orient : "v" | "h", optional

    Orientation of the plot (vertical or horizontal). This is usually

    inferred from the dtype of the input variables, but can be used to

    specify when the "categorical" variable is a numeric or when plotting

    wide-form data.
强制定向,v:竖直方向;h:水平方向,具体实例未知。
color : matplotlib color, optional

    Color for all of the elements, or seed for a gradient palette.
palette : palette name, list, or dict, optional.Colors to use for the different levels of the ``hue`` variable.
Should be something that can be interpreted by :func:`color_palette`, or a dictionary mapping hue levels to matplotlib colors.
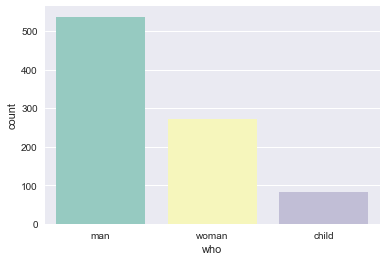
palette:使用不同的调色板
sns.countplot(x="who", data=titanic, palette="Set3")
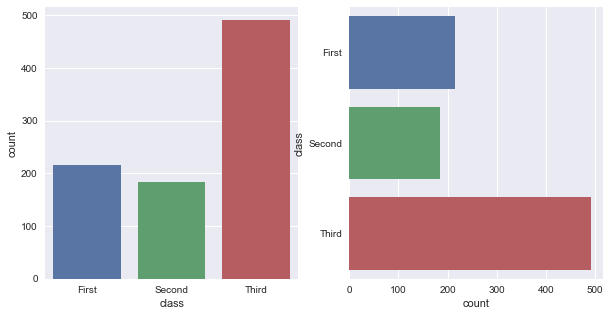
ax : matplotlib Axes, optional

    Axes object to draw the plot onto, otherwise uses the current Axes.

ax用来指定坐标系。
 fig, ax = plt.subplots(1, 2, figsize=(10, 5))

 sns.countplot(x='class', data=titanic, ax=ax[0])

 sns.countplot(y='class', data=titanic, ax=ax[1])
Python数据可视化-seaborn库之countplot的更多相关文章
- Python数据可视化-seaborn
详细介绍可以看seaborn官方API和example galler. 1 set_style( ) set( ) set_style( )是用来设置主题的,Seaborn有五个预设好的主题: d ...
- Python数据可视化的四种简易方法
摘要: 本文讲述了热图.二维密度图.蜘蛛图.树形图这四种Python数据可视化方法. 数据可视化是任何数据科学或机器学习项目的一个重要组成部分.人们常常会从探索数据分析(EDA)开始,来深入了解数据, ...
- 推荐一款Python数据可视化神器
1. 前言 在日常工作中,为了更直观的发现数据中隐藏的规律,察觉到变量之间的互动关系,人们常常借助可视化帮助我们更好的给他人解释现象,做到一图胜千文的说明效果. 在Python中,常见的数据可视化库有 ...
- Python数据可视化基础讲解
前言 本文的文字及图片来源于网络,仅供学习.交流使用,不具有任何商业用途,版权归原作者所有,如有问题请及时联系我们以作处理. 作者:爱数据学习社 首先,要知道我们用哪些库来画图? matplotlib ...
- Python数据可视化编程实战——导入数据
1.从csv文件导入数据 原理:with语句打开文件并绑定到对象f.不必担心在操作完资源后去关闭数据文件,with的上下文管理器会帮助处理.然后,csv.reader()方法返回reader对象,通过 ...
- Python数据可视化——使用Matplotlib创建散点图
Python数据可视化——使用Matplotlib创建散点图 2017-12-27 作者:淡水化合物 Matplotlib简述: Matplotlib是一个用于创建出高质量图表的桌面绘图包(主要是2D ...
- Python数据可视化编程实战pdf
Python数据可视化编程实战(高清版)PDF 百度网盘 链接:https://pan.baidu.com/s/1vAvKwCry4P4QeofW-RqZ_A 提取码:9pcd 复制这段内容后打开百度 ...
- 【数据科学】Python数据可视化概述
注:很早之前就打算专门写一篇与Python数据可视化相关的博客,对一些基本概念和常用技巧做一个小结.今天终于有时间来完成这个计划了! 0. Python中常用的可视化工具 Python在数据科学中的地 ...
- python --数据可视化(一)
python --数据可视化 一.python -- pyecharts库的使用 pyecharts--> 生成Echarts图标的类库 1.安装: pip install pyecharts ...
随机推荐
- Fedora 24系统基本命令
Fedora 24基本命令 一. DNF软件管理 1. 修改配置:在/etc/dnf/dnf.conf中加入fastestmirror=true.keepcache=true ...
- [HNOI2001] 产品加工
题目类型:\(DP\) 传送门:>Here< 题意:有\(N\)个零件,每个零件有三种选择,在\(A\)机器加工,在\(B\)机器加工,同时在\(AB\)加工.其中所需要的时间分别为\(t ...
- [POI2015]KIN[线段树]
很套路的维护最大和子段 #include <cmath> #include <cstring> #include <cstdio> #include <cst ...
- 【BZOJ4013】[HNOI2015]实验比较(动态规划)
[BZOJ4013][HNOI2015]实验比较(动态规划) 题面 BZOJ 洛谷 题解 看题目意思就是给你一棵树,连边表示强制顺序关系.然后你要给点染色,在满足顺序关系的情况下,将序列染成若干个颜色 ...
- 详解最大似然估计(MLE)、最大后验概率估计(MAP),以及贝叶斯公式的理解
转载声明:本文为转载文章,发表于nebulaf91的csdn博客.欢迎转载,但请务必保留本信息,注明文章出处. 原文作者: nebulaf91 原文原始地址:http://blog.csdn.net/ ...
- 帕斯卡(pascal)命名法:
帕斯卡(pascal)命名法: 与骆驼命名法类似.只不过骆驼命名法是首字母小写,而帕斯卡命名法是首字母大写 如:public void DisplayInfo(); string UserName; ...
- com.fasterxml.jackson工具类
老版本的Jackson使用的包名为org.codehaus.jackson,而新版本使用的是com.fasterxml.jackson. Jackson主要包含了3个模块: jackson-core ...
- [Leetcode] 01 Matrix
问题: https://leetcode.com/problems/01-matrix/#/description 基本思路:广度优先遍历,根据所有最短距离为N的格找到所有距离为N+1的格,直到所有的 ...
- JSON使用与类型转换
JSON语法与对象 JSON方法与使用 一.JSON语法与对象 JSON是英文JavaScript Object Notation(JavaScript 对象表示法)的缩写,是存储和交换文本信息的语法 ...
- 关于python环境配置的博客收藏
使用anaconda的pip来扩展anaconda的库: https://www.cnblogs.com/duan-qs/p/6289339.html 一个.py文件如何调用另一个.py文件中的类和函 ...