[D3] 7. Quantitative Scales
# Quantitative Scales
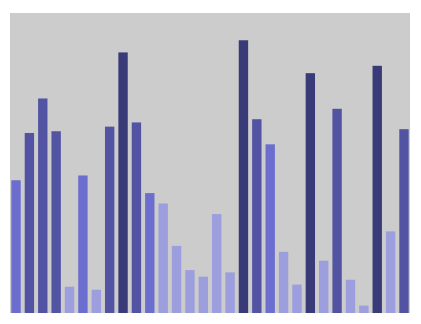
    var colorScale = d3.scale.quantile()

            .domain([d3.max(dataset) / 4, d3.max(dataset) / 2 , 3*d3.max(dataset) / 4, d3.max(dataset)])

            .range(["#9c9ede","#6b6ecf","#5254a3", "#393b79"]);
So the code divide the value into 4 range, if the value smaller than 1/4 max value, then it use #9c9ede color;
from 1/4 - 1/2: #6b6ecf
...
from 3/4 - 1: #393b79
 var q = d3.scale.quantize().domain([0, 1]).range(['a', 'b', 'c']);

 //q(0.3) === 'a', q(0.4) === 'b', q(0.6) === 'b', q(0.7) ==='c';

 //q.invertExtent('a') returns [0, 0.3333333333333333]
### use:
.attr('fill', colorScale);
<!DOCTYPE html>

<html>

<head lang="en">

    <meta charset="UTF-8">

    <title></title>

    <script src="../bower_components/underscore/underscore-min.js"></script>

    <script src="../ventor/d3.min.js"></script>

    <style type="text/css">

        body

        {

            padding-top: 50px;

            padding-left: 100px;

        }

        #chartArea {

            width: 400px;

            height: 300px;

            background-color: #CCC;

        }

        .bar

        {

            display: inline-block;

            width: 20px;

            height: 75px; /* Gets overriden by D3-assigned height below */

            margin-right: 2px;

           /* fill: teal; *//* SVG doesn't have background prop, use fill instead*/

            z-index:99;

        }

    </style>

</head>

<body>

<section id="chartArea"></section>

<script>

    var dataset = _.map(_.range(30), function(num) {

        return Math.random() * 50;

    }), //reandom generate 15 data from 1 to 50

            w = 400, h = 300;

    var svg = d3.select('#chartArea').append('svg')

            .attr('width', w)

            .attr('height', h); //svg deosn't need 'px'

    var yScale = d3.scale.linear()

            .domain([0, d3.max(dataset) * 1.1]) //d3.max(dataset), set the max val of database

            .range([0, h]);

    var xScale = d3.scale.ordinal()

            .domain(dataset)

            .rangeBands([0,w],0.3, 0.1);

//    var colorScale = d3.scale.category20c();

    var colorScale = d3.scale.quantile()

            .domain([d3.max(dataset) / 4, d3.max(dataset) / 2 , 3*d3.max(dataset) / 4, d3.max(dataset)])

            .range(["#9c9ede","#6b6ecf","#5254a3", "#393b79"]);

    svg.selectAll('div')

            .data(dataset)

            .enter()

            .append('rect')// svg doesn't have div, use rect instead

            .attr('class', "bar")

            .attr('width', xScale.rangeBand())

            .attr('x', function(each_data, index){

                return xScale(each_data);

            })

            .attr('y', function(each_data){

                return h-yScale(each_data);

            })

            .attr('height', function(each_data, i){

                return yScale(each_data);

            })

            .attr('fill', colorScale);

</script>

</body>

</html>
[D3] 7. Quantitative Scales的更多相关文章
- 【D3.V3.js系列教程】--(十二)坐标尺度
[D3.V3.js系列教程]--(十二)坐标尺度 1.多种类型的缩放尺度 Quantitative Scales Linear Scales Identity Scales Power Scales ...
- D3 JS study notes
如何使用d3来解析自定义格式的数据源? var psv = d3.dsvFormat("|"); // This parser can parse pipe-delimited t ...
- 【D3 API 中文手冊】
[D3 API 中文手冊] 声明:本文仅供学习所用,未经作者同意严禁转载和演绎 <D3 API 中文手冊>是D3官方API文档的中文翻译. 始于2014-3-23日,基于VisualCre ...
- D3——scale
d3.scale 比例尺 “Scales are functions that map from an input domain to an output range” Domains 定义域 和 R ...
- [D3] Build a Column Chart with D3 v4
Column and bar charts are staples of every visualization library. They also make a great project for ...
- [D3] Convert Dates to Numeric Values with Time Scales in D3 v4
Mapping abstract values to visual representations is what data visualization is all about, and that’ ...
- [D3] Convert Input Data to Output Values with Linear Scales in D3
Mapping abstract values to visual representations is what data visualization is all about, and that’ ...
- [D3] Create Labels from Non-numeric Data with Ordinal Scales in D3 v4
When your data contains discrete, non-numeric property values that you need to format or convert bef ...
- [D3] Create Labels from Numeric Data with Quantize Scales in D3 v4
Sometimes data needs to be converted from a continuous range, like test scores, to a discrete set of ...
随机推荐
- 如何快速正确的安装 Ruby, Rails 运行环境-b
对于新入门的开发者,如何安装 Ruby, Ruby Gems 和 Rails 的运行环境可能会是个问题,本页主要介绍如何用一条靠谱的路子快速安装 Ruby 开发环境.次安装方法同样适用于产品环境! 系 ...
- JQuery为元素添加样式
由于jquery支持css3,所有能很好的兼容很多浏览器,所以通过jquery来使用css样式比较好 为定义好的css样式可以调用元素的css方法添加样式 $("span").cs ...
- java.lang.UnsupportedClassVersionError(java项目版本一致问题)
报此错误,一般都是由于在myeclipse中的java项目是用高版本(jdk1.6之后)的jdk进行编译后生成的class文件,却要运行在低版本的jdk虚拟机上,导致这个错误 解决办法: 在myecl ...
- [转贴] 从零开始学C++之异常(二):程序错误、异常(语法、抛出、捕获、传播)、栈展开
一.程序错误 编译错误,即语法错误.程序就无法被生成运行代码. 运行时错误 不可预料的逻辑错误 可以预料的运行异常 例如: 动态分配空间时可能不会成功 打开文件可能会失败 除法运算时分母可能为0 整数 ...
- Qt创建窗体的过程
版权声明 本文为原创作品,请尊重作者的劳动成果.转载必须保持文章完整性,并以超链接形式注明原始作者“ tingsking18”和 主站点地址,方便其他朋友提问和指正. QT源码解析(一) QT创建窗口 ...
- 转:三十三、Java图形化界面设计——布局管理器之null布局(空布局)——即SWT中的绝对布局
http://blog.csdn.net/liujun13579/article/details/7774267 一般容器都有默认布局方式,但是有时候需要精确指定各个组建的大小和位置,就需要用到 ...
- Python之re模块
参考:http://www.cnblogs.com/PythonHome/archive/2011/11/19/2255459.html 这个模块提供了与 Perl 相似l的正则表达式匹配操作.Uni ...
- 彻底卸载oracle10g
如果Oracle安装在Windows上,那么删除起来特别麻烦,以下列出具体步骤: 软件环境: Windows 7.ORACLE 10.1.24:ORACLE安装路径为:C:/ORACLE 实现方法: ...
- nini
using Nini.Ini; using Nini.Config; IniDocument doc = new IniDocument("Settings.ini", IniFi ...
- TeamViewer 远程时出现:现在无法捕捉画面。这可能是由于恰的用户切换或远程桌面会话断开、最小化
关掉远程访问主机的TeamViewer ,再重新打开软件