SQLdiag-配置文件-PerfmonCollector
前一篇我们已经使用默认配置文件收集了部分诊断数据,并且知道配置文件会影响收集数据的内容。这一篇我们重点讲述配置文件中与性能计数器相关的操作。
可使用XML模板控制SQLdiag使用的收集器。每个收集器可以使用配置文件的<enabled="true">或<enabled="false">来启用或禁用。使用自己最喜欢的文件编辑器,甚至在支持XML文档编辑的Management Studio中修改XML配置文件。不要从XML文件中删除收集器,因为如果XML文件不能匹配,随后SQLdiag将不能加载XSD。
首先让我们使用SD_Detailed.XML配置文件收集5分钟数据:
cd D:\Program Files\Microsoft SQL Server\\Tools\Binn\

SQLdiag /I F:\TroubleShooting\SQLdiag\input\SD_Detailed.XML /O F:\TroubleShooting\SQLdiag\LocalOutput  /E +::
生成的文件如下: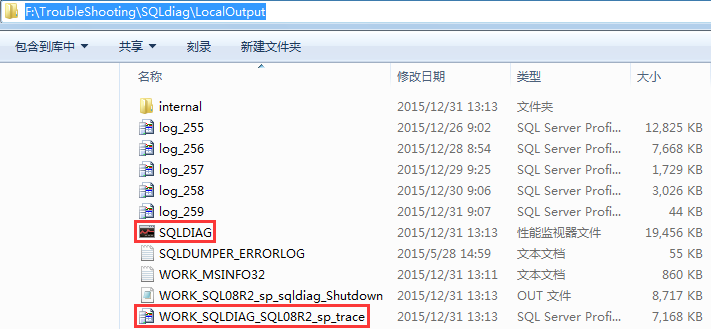
SQLDIAG:收集PerfMon数据,对应PerfmonCollector元素
WORK_SQLDIAG_SQL08R2_sp_trace:收集的跟踪数据,对应ProfilerCollector元素
其他文件的说明见上一篇,在我本地收集5分钟性能监视器文件达到19Mb、跟踪数据文件为7Mb(没有做任何其他操作)。
性能计数器数据,与收集计数器数量、轮询时间间隔有关。与收集时长是线性增长关系。
跟踪数据,与添加的跟踪事件,系统繁忙程度有关。收集的大小可能不成比例地膨胀。
建议在高峰时段短暂地运行SQLdiag约10-15分钟,来估计Profiler跟踪事件的生成率和耗费的磁盘空间。这使你能够在数据被改写之前,对将要捕获的活动的时间跨度形成一个粗略的近似。PerfMon文件并不像Profiler跟踪文件一样迅速地增大。Profiler跟踪收集到目前为止是SQLdiag中最消耗资源的数据收集组件。
PerfmonCollector
虽说收集PerfMon数据的开销相比其他数据收集器是最低的,但也不必要将所有性能计数据器都启用。本节将按照下面步骤测试:
1>禁用EventlogCollector、BlockingCollector、ProfilerCollector、CustomDiagnostics元素收集器;PerfmonCollector、SqldiagCollector元素保持启用
2>参照之前配置的数据收集器模板PerfmonLine启用/禁用PerfmonCollector元素下对应的计数器
<?xml version="1.0" encoding="UTF-16"?>
<DataCollectorSet>
<Status>1</Status>
<Duration>86100</Duration>
<Description>
</Description>
<DescriptionUnresolved>
</DescriptionUnresolved>
<DisplayName>
</DisplayName>
<DisplayNameUnresolved>
</DisplayNameUnresolved>
<SchedulesEnabled>-1</SchedulesEnabled>
<LatestOutputLocation>D:\Perfmon\DataCollector</LatestOutputLocation>
<Name>PLAYER</Name>
<OutputLocation>D:\Perfmon\DataCollector</OutputLocation>
<RootPath>D:\Perfmon</RootPath>
<Segment>0</Segment>
<SegmentMaxDuration>0</SegmentMaxDuration>
<SegmentMaxSize>0</SegmentMaxSize>
<SerialNumber>15</SerialNumber>
<Server>
</Server>
<Subdirectory>DataCollector</Subdirectory>
<SubdirectoryFormat>1</SubdirectoryFormat>
<SubdirectoryFormatPattern>
</SubdirectoryFormatPattern>
<Task>
</Task>
<TaskRunAsSelf>0</TaskRunAsSelf>
<TaskArguments>
</TaskArguments>
<TaskUserTextArguments>
</TaskUserTextArguments>
<UserAccount>SYSTEM</UserAccount>
<Security>O:BAG:S-1-5-21-2109620463-1702659591-2666464273-513D:AI(A;;FA;;;SY)(A;;FA;;;BA)(A;;FR;;;LU)(A;;0x1301ff;;;S-1-5-80-2661322625-712705077-2999183737-3043590567-590698655)(A;ID;FA;;;SY)(A;ID;FA;;;BA)(A;ID;0x1200ab;;;LU)(A;ID;FR;;;AU)(A;ID;FR;;;LS)(A;ID;FR;;;NS)</Security>
<StopOnCompletion>0</StopOnCompletion>
<PerformanceCounterDataCollector>
<DataCollectorType>0</DataCollectorType>
<Name>DataCollector</Name>
<FileName>PLAYER</FileName>
<FileNameFormat>1</FileNameFormat>
<FileNameFormatPattern>\-yyyyMMdd</FileNameFormatPattern>
<LogAppend>0</LogAppend>
<LogCircular>0</LogCircular>
<LogOverwrite>0</LogOverwrite>
<LatestOutputLocation>D:\Perfmon\DataCollector\PLAYER-20151105.blg</LatestOutputLocation>
<DataSourceName>
</DataSourceName>
<SampleInterval>30</SampleInterval>
<SegmentMaxRecords>0</SegmentMaxRecords>
<LogFileFormat>3</LogFileFormat>
<Counter>\Memory\Available MBytes</Counter>
<Counter>\Memory\Cache Bytes</Counter>
<Counter>\Memory\Commit Limit</Counter>
<Counter>\Memory\Committed Bytes</Counter>
<Counter>\Memory\Free System Page Table Entries</Counter>
<Counter>\Memory\Pages Input/sec</Counter>
<Counter>\Memory\Pages/sec</Counter>
<Counter>\Memory\System Cache Resident Bytes</Counter>
<Counter>\MSSQL$PLAYER:Access Methods\FreeSpace Scans/sec</Counter>
<Counter>\MSSQL$PLAYER:Access Methods\Full Scans/sec</Counter>
<Counter>\MSSQL$PLAYER:Access Methods\Table Lock Escalations/sec</Counter>
<Counter>\MSSQL$PLAYER:Access Methods\Worktables Created/sec</Counter>
<Counter>\MSSQL$PLAYER:Access Methods\Worktables From Cache Ratio</Counter>
<Counter>\MSSQL$PLAYER:Buffer Manager\Buffer cache hit ratio</Counter>
<Counter>\MSSQL$PLAYER:Buffer Manager\Checkpoint pages/sec</Counter>
<Counter>\MSSQL$PLAYER:Buffer Manager\Database pages</Counter>
<Counter>\MSSQL$PLAYER:Buffer Manager\Free list stalls/sec</Counter>
<Counter>\MSSQL$PLAYER:Buffer Manager\Free pages</Counter>
<Counter>\MSSQL$PLAYER:Buffer Manager\Lazy writes/sec</Counter>
<Counter>\MSSQL$PLAYER:Buffer Manager\Page life expectancy</Counter>
<Counter>\MSSQL$PLAYER:Buffer Manager\Page lookups/sec</Counter>
<Counter>\MSSQL$PLAYER:Buffer Manager\Page reads/sec</Counter>
<Counter>\MSSQL$PLAYER:Buffer Manager\Page writes/sec</Counter>
<Counter>\MSSQL$PLAYER:Buffer Manager\Readahead pages/sec</Counter>
<Counter>\MSSQL$PLAYER:Buffer Manager\Stolen pages</Counter>
<Counter>\MSSQL$PLAYER:Buffer Manager\Target pages</Counter>
<Counter>\MSSQL$PLAYER:Buffer Manager\Total pages</Counter>
<Counter>\MSSQL$PLAYER:Databases(_Total)\Transactions/sec</Counter>
<Counter>\MSSQL$PLAYER:General Statistics\Connection Reset/sec</Counter>
<Counter>\MSSQL$PLAYER:General Statistics\Logins/sec</Counter>
<Counter>\MSSQL$PLAYER:General Statistics\Logouts/sec</Counter>
<Counter>\MSSQL$PLAYER:General Statistics\Processes blocked</Counter>
<Counter>\MSSQL$PLAYER:General Statistics\User Connections</Counter>
<Counter>\MSSQL$PLAYER:Latches\Average Latch Wait Time (ms)</Counter>
<Counter>\MSSQL$PLAYER:Latches\Latch Waits/sec</Counter>
<Counter>\MSSQL$PLAYER:Latches\Total Latch Wait Time (ms)</Counter>
<Counter>\MSSQL$PLAYER:Locks(_Total)\Average Wait Time (ms)</Counter>
<Counter>\MSSQL$PLAYER:Locks(_Total)\Lock Requests/sec</Counter>
<Counter>\MSSQL$PLAYER:Locks(_Total)\Lock Timeouts (timeout > 0)/sec</Counter>
<Counter>\MSSQL$PLAYER:Locks(_Total)\Lock Timeouts/sec</Counter>
<Counter>\MSSQL$PLAYER:Locks(_Total)\Lock Wait Time (ms)</Counter>
<Counter>\MSSQL$PLAYER:Locks(_Total)\Lock Waits/sec</Counter>
<Counter>\MSSQL$PLAYER:Locks(_Total)\Number of Deadlocks/sec</Counter>
<Counter>\MSSQL$PLAYER:Memory Manager\Granted Workspace Memory (KB)</Counter>
<Counter>\MSSQL$PLAYER:Memory Manager\Maximum Workspace Memory (KB)</Counter>
<Counter>\MSSQL$PLAYER:Memory Manager\Memory Grants Outstanding</Counter>
<Counter>\MSSQL$PLAYER:Memory Manager\Memory Grants Pending</Counter>
<Counter>\MSSQL$PLAYER:Memory Manager\Stolen Server Memory (KB)</Counter>
<Counter>\MSSQL$PLAYER:Memory Manager\Target Server Memory (KB)</Counter>
<Counter>\MSSQL$PLAYER:Memory Manager\Total Server Memory (KB)</Counter>
<Counter>\MSSQL$PLAYER:Plan Cache(_Total)\Cache Hit Ratio</Counter>
<Counter>\MSSQL$PLAYER:SQL Statistics\Auto-Param Attempts/sec</Counter>
<Counter>\MSSQL$PLAYER:SQL Statistics\Batch Requests/sec</Counter>
<Counter>\MSSQL$PLAYER:SQL Statistics\Failed Auto-Params/sec</Counter>
<Counter>\MSSQL$PLAYER:SQL Statistics\Safe Auto-Params/sec</Counter>
<Counter>\MSSQL$PLAYER:SQL Statistics\SQL Compilations/sec</Counter>
<Counter>\MSSQL$PLAYER:SQL Statistics\SQL Re-Compilations/sec</Counter>
<Counter>\MSSQL$PLAYER:SQL Statistics\Unsafe Auto-Params/sec</Counter>
<Counter>\MSSQL$PLAYER:Transactions\Longest Transaction Running Time</Counter>
<Counter>\Network Interface(*)\Bytes Sent/sec</Counter>
<Counter>\Paging File(_Total)\% Usage Peak</Counter>
<Counter>\Paging File(_Total)\% Usage</Counter>
<Counter>\PhysicalDisk(1 D:)\% Idle Time</Counter>
<Counter>\PhysicalDisk(1 D:)\Avg. Disk Queue Length</Counter>
<Counter>\PhysicalDisk(1 D:)\Avg. Disk sec/Read</Counter>
<Counter>\PhysicalDisk(1 D:)\Avg. Disk sec/Transfer</Counter>
<Counter>\PhysicalDisk(1 D:)\Avg. Disk sec/Write</Counter>
<Counter>\PhysicalDisk(1 D:)\Disk Bytes/sec</Counter>
<Counter>\PhysicalDisk(1 D:)\Disk Reads/sec</Counter>
<Counter>\PhysicalDisk(1 D:)\Disk Writes/sec</Counter>
<Counter>\Process(sqlservr)\% Processor Time</Counter>
<Counter>\Process(sqlservr)\Private Bytes</Counter>
<Counter>\Process(sqlservr)\% User Time</Counter>
<Counter>\Processor(_Total)\% Privileged Time</Counter>
<Counter>\Processor(_Total)\% Processor Time</Counter>
<Counter>\Processor(_Total)\% User Time</Counter>
<Counter>\System\Context Switches/sec</Counter>
<Counter>\System\Processor Queue Length</Counter>
<CounterDisplayName>\Memory\Available MBytes</CounterDisplayName>
<CounterDisplayName>\Memory\Cache Bytes</CounterDisplayName>
<CounterDisplayName>\Memory\Commit Limit</CounterDisplayName>
<CounterDisplayName>\Memory\Committed Bytes</CounterDisplayName>
<CounterDisplayName>\Memory\Free System Page Table Entries</CounterDisplayName>
<CounterDisplayName>\Memory\Pages Input/sec</CounterDisplayName>
<CounterDisplayName>\Memory\Pages/sec</CounterDisplayName>
<CounterDisplayName>\Memory\System Cache Resident Bytes</CounterDisplayName>
<CounterDisplayName>\MSSQL$PLAYER:Access Methods\FreeSpace Scans/sec</CounterDisplayName>
<CounterDisplayName>\MSSQL$PLAYER:Access Methods\Full Scans/sec</CounterDisplayName>
<CounterDisplayName>\MSSQL$PLAYER:Access Methods\Table Lock Escalations/sec</CounterDisplayName>
<CounterDisplayName>\MSSQL$PLAYER:Access Methods\Worktables Created/sec</CounterDisplayName>
<CounterDisplayName>\MSSQL$PLAYER:Access Methods\Worktables From Cache Ratio</CounterDisplayName>
<CounterDisplayName>\MSSQL$PLAYER:Buffer Manager\Buffer cache hit ratio</CounterDisplayName>
<CounterDisplayName>\MSSQL$PLAYER:Buffer Manager\Checkpoint pages/sec</CounterDisplayName>
<CounterDisplayName>\MSSQL$PLAYER:Buffer Manager\Database pages</CounterDisplayName>
<CounterDisplayName>\MSSQL$PLAYER:Buffer Manager\Free list stalls/sec</CounterDisplayName>
<CounterDisplayName>\MSSQL$PLAYER:Buffer Manager\Free pages</CounterDisplayName>
<CounterDisplayName>\MSSQL$PLAYER:Buffer Manager\Lazy writes/sec</CounterDisplayName>
<CounterDisplayName>\MSSQL$PLAYER:Buffer Manager\Page life expectancy</CounterDisplayName>
<CounterDisplayName>\MSSQL$PLAYER:Buffer Manager\Page lookups/sec</CounterDisplayName>
<CounterDisplayName>\MSSQL$PLAYER:Buffer Manager\Page reads/sec</CounterDisplayName>
<CounterDisplayName>\MSSQL$PLAYER:Buffer Manager\Page writes/sec</CounterDisplayName>
<CounterDisplayName>\MSSQL$PLAYER:Buffer Manager\Readahead pages/sec</CounterDisplayName>
<CounterDisplayName>\MSSQL$PLAYER:Buffer Manager\Stolen pages</CounterDisplayName>
<CounterDisplayName>\MSSQL$PLAYER:Buffer Manager\Target pages</CounterDisplayName>
<CounterDisplayName>\MSSQL$PLAYER:Buffer Manager\Total pages</CounterDisplayName>
<CounterDisplayName>\MSSQL$PLAYER:Databases(_Total)\Transactions/sec</CounterDisplayName>
<CounterDisplayName>\MSSQL$PLAYER:General Statistics\Connection Reset/sec</CounterDisplayName>
<CounterDisplayName>\MSSQL$PLAYER:General Statistics\Logins/sec</CounterDisplayName>
<CounterDisplayName>\MSSQL$PLAYER:General Statistics\Logouts/sec</CounterDisplayName>
<CounterDisplayName>\MSSQL$PLAYER:General Statistics\Processes blocked</CounterDisplayName>
<CounterDisplayName>\MSSQL$PLAYER:General Statistics\User Connections</CounterDisplayName>
<CounterDisplayName>\MSSQL$PLAYER:Latches\Average Latch Wait Time (ms)</CounterDisplayName>
<CounterDisplayName>\MSSQL$PLAYER:Latches\Latch Waits/sec</CounterDisplayName>
<CounterDisplayName>\MSSQL$PLAYER:Latches\Total Latch Wait Time (ms)</CounterDisplayName>
<CounterDisplayName>\MSSQL$PLAYER:Locks(_Total)\Average Wait Time (ms)</CounterDisplayName>
<CounterDisplayName>\MSSQL$PLAYER:Locks(_Total)\Lock Requests/sec</CounterDisplayName>
<CounterDisplayName>\MSSQL$PLAYER:Locks(_Total)\Lock Timeouts (timeout > 0)/sec</CounterDisplayName>
<CounterDisplayName>\MSSQL$PLAYER:Locks(_Total)\Lock Timeouts/sec</CounterDisplayName>
<CounterDisplayName>\MSSQL$PLAYER:Locks(_Total)\Lock Wait Time (ms)</CounterDisplayName>
<CounterDisplayName>\MSSQL$PLAYER:Locks(_Total)\Lock Waits/sec</CounterDisplayName>
<CounterDisplayName>\MSSQL$PLAYER:Locks(_Total)\Number of Deadlocks/sec</CounterDisplayName>
<CounterDisplayName>\MSSQL$PLAYER:Memory Manager\Granted Workspace Memory (KB)</CounterDisplayName>
<CounterDisplayName>\MSSQL$PLAYER:Memory Manager\Maximum Workspace Memory (KB)</CounterDisplayName>
<CounterDisplayName>\MSSQL$PLAYER:Memory Manager\Memory Grants Outstanding</CounterDisplayName>
<CounterDisplayName>\MSSQL$PLAYER:Memory Manager\Memory Grants Pending</CounterDisplayName>
<CounterDisplayName>\MSSQL$PLAYER:Memory Manager\Stolen Server Memory (KB)</CounterDisplayName>
<CounterDisplayName>\MSSQL$PLAYER:Memory Manager\Target Server Memory (KB)</CounterDisplayName>
<CounterDisplayName>\MSSQL$PLAYER:Memory Manager\Total Server Memory (KB)</CounterDisplayName>
<CounterDisplayName>\MSSQL$PLAYER:Plan Cache(_Total)\Cache Hit Ratio</CounterDisplayName>
<CounterDisplayName>\MSSQL$PLAYER:SQL Statistics\Auto-Param Attempts/sec</CounterDisplayName>
<CounterDisplayName>\MSSQL$PLAYER:SQL Statistics\Batch Requests/sec</CounterDisplayName>
<CounterDisplayName>\MSSQL$PLAYER:SQL Statistics\Failed Auto-Params/sec</CounterDisplayName>
<CounterDisplayName>\MSSQL$PLAYER:SQL Statistics\Safe Auto-Params/sec</CounterDisplayName>
<CounterDisplayName>\MSSQL$PLAYER:SQL Statistics\SQL Compilations/sec</CounterDisplayName>
<CounterDisplayName>\MSSQL$PLAYER:SQL Statistics\SQL Re-Compilations/sec</CounterDisplayName>
<CounterDisplayName>\MSSQL$PLAYER:SQL Statistics\Unsafe Auto-Params/sec</CounterDisplayName>
<CounterDisplayName>\MSSQL$PLAYER:Transactions\Longest Transaction Running Time</CounterDisplayName>
<CounterDisplayName>\Network Interface(*)\Bytes Sent/sec</CounterDisplayName>
<CounterDisplayName>\Paging File(_Total)\% Usage Peak</CounterDisplayName>
<CounterDisplayName>\Paging File(_Total)\% Usage</CounterDisplayName>
<CounterDisplayName>\PhysicalDisk(1 D:)\% Idle Time</CounterDisplayName>
<CounterDisplayName>\PhysicalDisk(1 D:)\Avg. Disk Queue Length</CounterDisplayName>
<CounterDisplayName>\PhysicalDisk(1 D:)\Avg. Disk sec/Read</CounterDisplayName>
<CounterDisplayName>\PhysicalDisk(1 D:)\Avg. Disk sec/Transfer</CounterDisplayName>
<CounterDisplayName>\PhysicalDisk(1 D:)\Avg. Disk sec/Write</CounterDisplayName>
<CounterDisplayName>\PhysicalDisk(1 D:)\Disk Bytes/sec</CounterDisplayName>
<CounterDisplayName>\PhysicalDisk(1 D:)\Disk Reads/sec</CounterDisplayName>
<CounterDisplayName>\PhysicalDisk(1 D:)\Disk Writes/sec</CounterDisplayName>
<CounterDisplayName>\Process(sqlservr)\% Processor Time</CounterDisplayName>
<CounterDisplayName>\Process(sqlservr)\Private Bytes</CounterDisplayName>
<CounterDisplayName>\Process(sqlservr)\% User Time</CounterDisplayName>
<CounterDisplayName>\Processor(_Total)\% Privileged Time</CounterDisplayName>
<CounterDisplayName>\Processor(_Total)\% Processor Time</CounterDisplayName>
<CounterDisplayName>\Processor(_Total)\% User Time</CounterDisplayName>
<CounterDisplayName>\System\Context Switches/sec</CounterDisplayName>
<CounterDisplayName>\System\Processor Queue Length</CounterDisplayName>
</PerformanceCounterDataCollector>
<Schedule>
<StartDate>5/20/2015</StartDate>
<EndDate>11/14/2015</EndDate>
<StartTime>9:30:00 AM</StartTime>
<Days>127</Days>
</Schedule>
<DataManager>
<Enabled>0</Enabled>
<CheckBeforeRunning>0</CheckBeforeRunning>
<MinFreeDisk>0</MinFreeDisk>
<MaxSize>0</MaxSize>
<MaxFolderCount>0</MaxFolderCount>
<ResourcePolicy>0</ResourcePolicy>
<ReportFileName>report.html</ReportFileName>
<RuleTargetFileName>report.xml</RuleTargetFileName>
<EventsFileName>
</EventsFileName>
</DataManager>
</DataCollectorSet>
注意对象下有多实例的情况,比如<PerfmonObject name="\Processor(*)" enabled="true">
它会收集Processor对象下指定计数器中所有实例的信息(包含_Total);在对象上的enabled="false"并不能禁用其下计数器的收集,必须显示在PerfmonCollector元素层或者底层计数器设置enabled="false"
很难一次将所有计数器调整成PerfmonLine模板所配置的,只有修改后让其收集性能计数器,然后查看收集的数据,如此反复几次。修改后收集的数据如下,图形中可能不会呈现出所有收集的计数器,我们可以右击将其他可用的计数器添加到面板。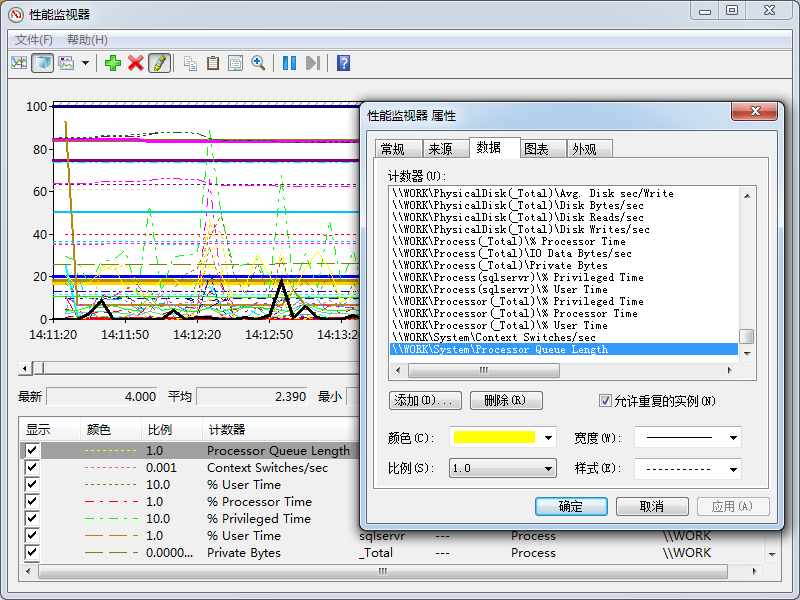
测试禁用对象<PerfmonObject name="\LogicalDisk(*)" enabled="false">,但其下的部分计数器是开启的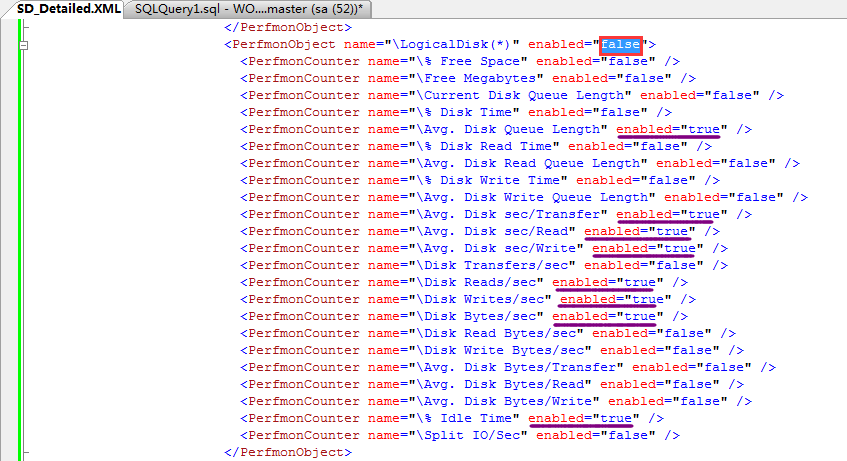
我们查看收集到的数据中还是有对应计数器,难道启用/禁用只有在顶层元素设置才会对其下的对象有影响?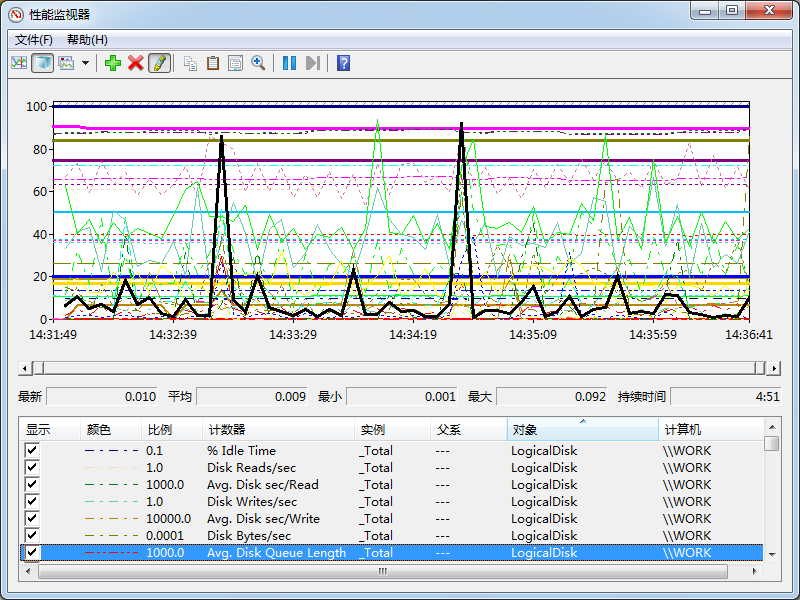
结合SQL Nexus完善PerfmonCollector的收集
我们使用sqlnexus导入收集的SQLdiag数据,我们主要查看Perfmon Summary,点击Perfmon Summary出现的页面几乎没数据!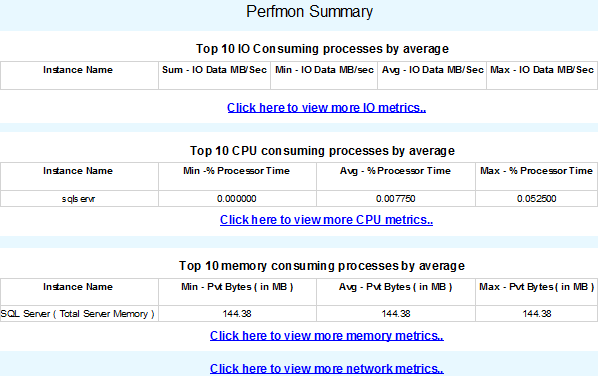
是否还记得我们在RML中有使用Proflier,查看RML所调用的过程/语句。此处我们也利用Proflier监控sqlnexus所调用的过程/语句(跟踪添加筛选器ApplicationName类似于sqlnexus)
我们重新点击Perfmon Summary,在Proflier跟踪下看到如下信息: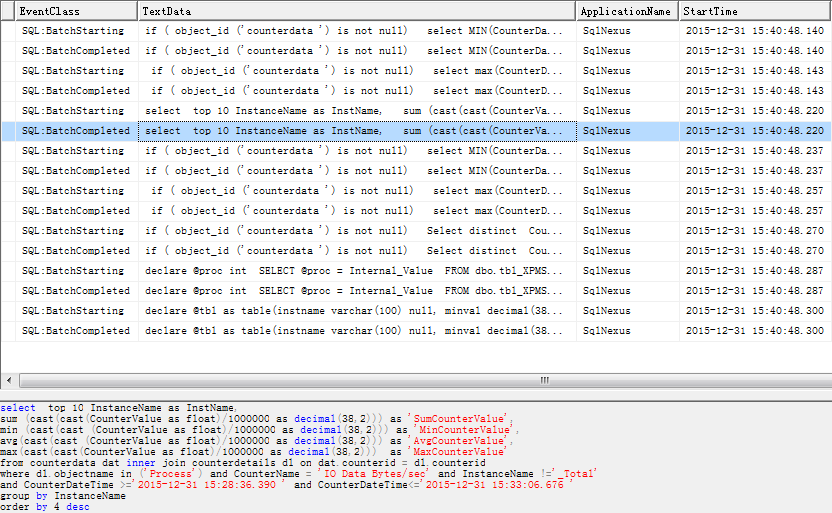
查看详细代码可知IO、CPU、Memory是来自下面计数器
<Counter>\Process(*)\IO Data Bytes/sec</Counter>

<Counter>\Process(*)\% Processor Time</Counter>

<Counter>\Process(*)\Private Bytes</Counter>
而这些计数器刚好没有收集(仅仅收集Process(sqlservr)一个实例)
点击 Click here to view more IO metrics..没有数据: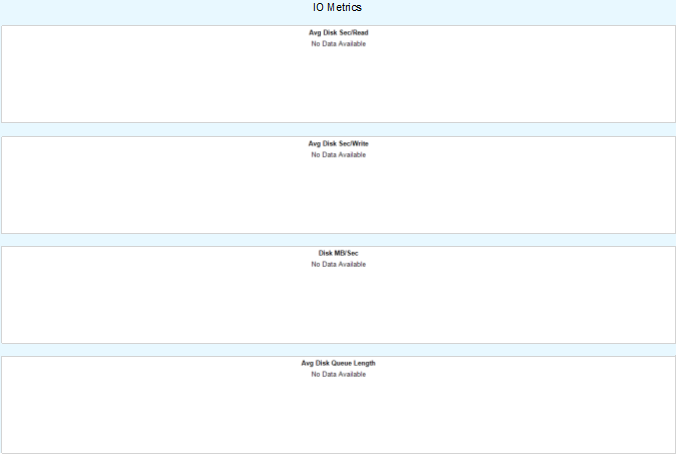
查看Proflier跟踪下看到如下信息: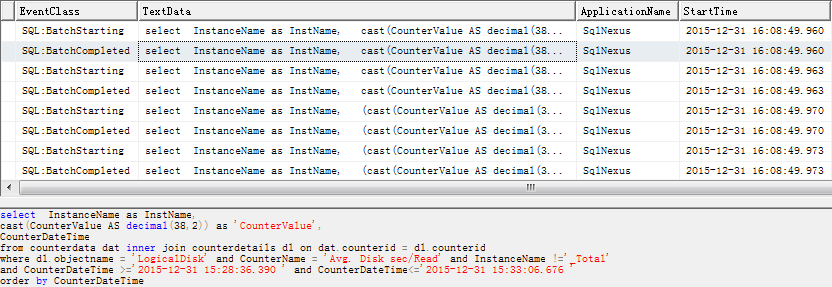
查看详细代码可知IO详细信息是来自下面计数器
<Counter>\LogicalDisk(*)\Avg. Disk sec/Read</Counter>

<Counter>\LogicalDisk(*)\Avg. Disk sec/Write</Counter>

<Counter>\LogicalDisk(*)\Disk Bytes/sec</Counter>

<Counter>\LogicalDisk(*)\Avg. Disk Queue Length</Counter>
点击Click here to view more CPU/Memory metrics..报错
查看Proflier跟踪下看到如下信息: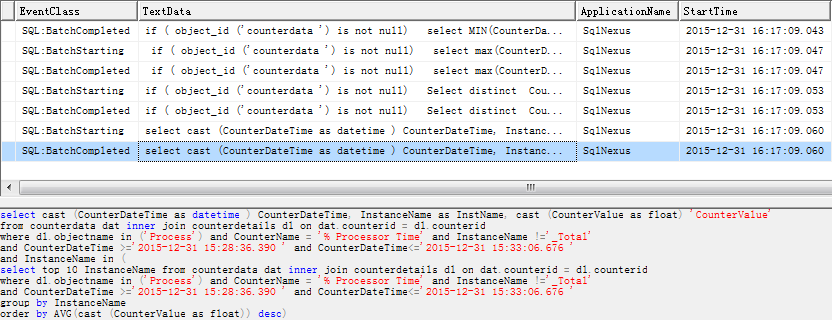
单独取语句到查询窗口执行,报错“从字符串转换日期和/或时间时,转换失败。”但将CounterDateTime截取再转就可以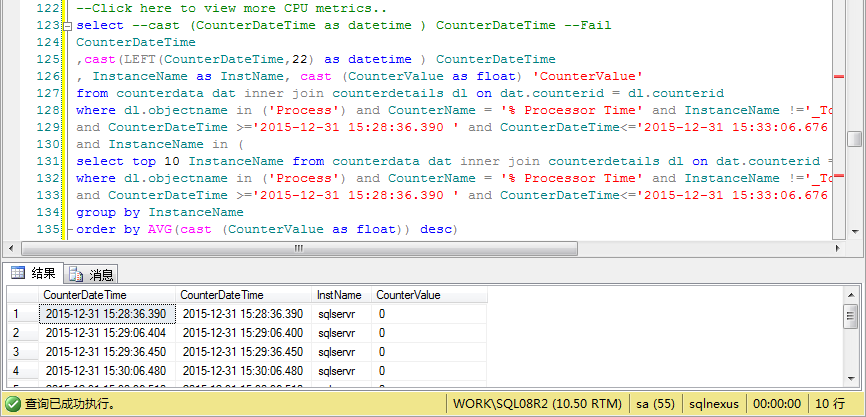
点击 Click here to view more Network metrics..没有数据:
查看Proflier跟踪下看到如下信息: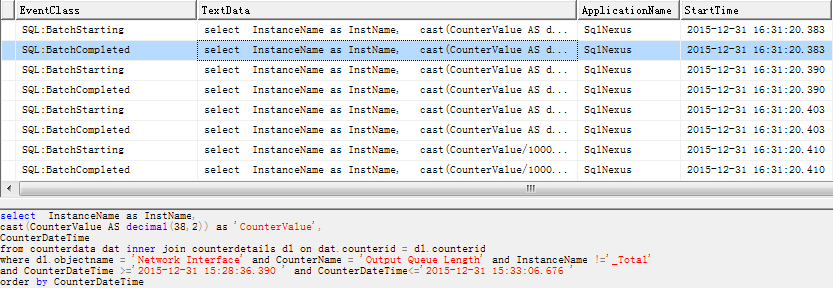
查看详细代码可知NetWork详细信息是来自下面计数器
<Counter>\Network Interface(*)\Output Queue Length</Counter>

<Counter>\Network Interface(*)\Packets Received Discarded</Counter>

<Counter>\Network Interface(*)\Packets Outbound Discarded</Counter>

<Counter>\Network Interface(*)\Bytes Total/Sec</Counter>
针对上面的问题,解决方案如下:
1>将上面列出的Process(*)、LogicalDisk(*)、Network Interface(*)相关计数器启用
2>使用如下语句更新CounterData中的CounterDateTime字段
USE sqlnexus

GO

UPDATE CounterData SET

CounterDateTime=LEFT(CounterDateTime,22)
导入数据时有跟踪到创建counterdata的脚本,但没找到原始建表语句保存在哪。另外在sqlnexus应用程序目录的PerfStatsAnalysis.sql文件中有对CounterData表的alter/update语句...
以上问题修正后,再次收集数据用sqlnexus工具查看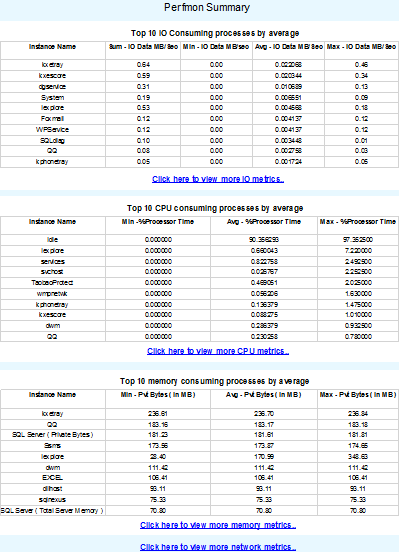
Perfmon Summary总界面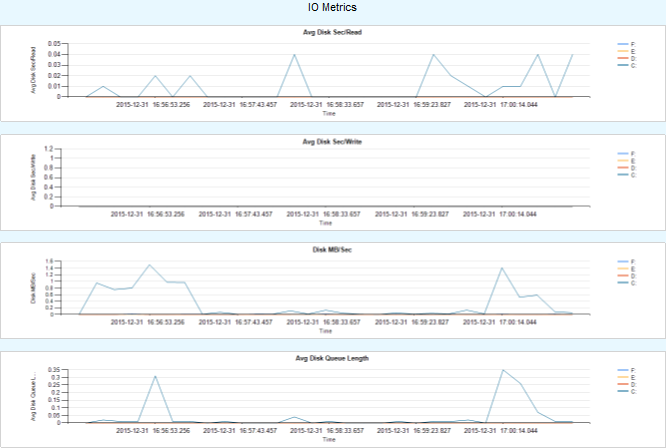
IO metrics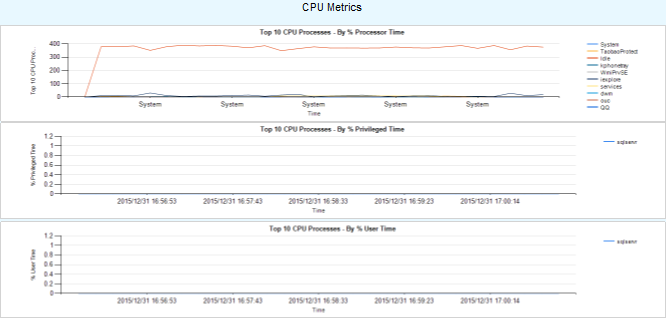
CPU metrics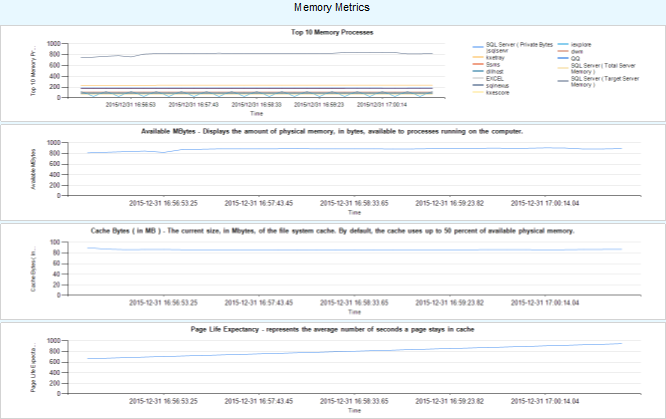
Memory metrics
NetWork metrics
我们可以针对每个图形跟踪其涉及的数据,并最终定位来自哪些计数器。如果已经启用相应的计数器,但是在图形中没有看到,就要查看展现的语句是如何处理的,sqlnexus会对部分数值进行单位换算(类似RML中的Scale)。当前SD_Detailed.XML配置文件的PerfmonCollector元素部分可参考文件链接对应部分。
SQLdiag-配置文件-PerfmonCollector的更多相关文章
- SQLdiag-初识
SQLdiag是一个命令行实用工具,默认情况下,在C:\Program Files\Microsoft SQL Server\100\Tools\Binn目录下可用.首先我们打开SQLdiag.exe ...
- SQLdiag Utility
使用SQLdiag 会进行信息搜集类型 Windows 系统性能日志 Windows 系统日志 SQL Server 性能信息 SQL Server 阻塞信息 SQL Server 配置信息 如何使用 ...
- 使用SQLdiag Utility搜集SQL Server诊断信息
SQLdiag Utility用于搜集诊断信息,给Microsoft技术支持人员做为判断依据. 使用SQLdiag 会进行信息搜集类型 Windows 系统性能日志 Windows 系统日志 SQL ...
- 【监控笔记】【1.4】Pssdiag和Sqldiag管理器
--没有实操过,有点复杂,先写上以后有用到再深入研究 统计与诊断数据是任何 SQL故障修复工作的关键所在. 如果没有掌握这些数据,就无法确定数据性能问题的根源.数据表的瓶颈可能并不是由索引问题造成的: ...
- .Net Core MVC 网站开发(Ninesky) 2.3、项目架构调整(续)-使用配置文件动态注入
上次实现了依赖注入,但是web项目必须要引用业务逻辑层和数据存储层的实现,项目解耦并不完全:另一方面,要同时注入业务逻辑层和数据访问层,注入的服务直接写在Startup中显得非常臃肿.理想的方式是,w ...
- ASP.NET MVC5+EF6+EasyUI 后台管理系统(64)-补充WebApi与Unity注入-配置文件
系列目录 上一篇演示了WebApi利用Unity注入 很多人问我如何用配置文件来配置注入,本节演示如何利用配置文件来注入,道理是一样的,跳转到上一节下载源码一起来动手! 1.打开源码定位到文件Depe ...
- Spring配置文件标签报错:The prefix "XXX" for element "XXX:XXX" is not bound. .
例如:The prefix "context" for element "context:annotation-config" is not bound. 这种 ...
- nginx服务器安装及配置文件详解
nginx在工作中已经有好几个环境在使用了,每次都是重新去网上扒博客,各种编译配置,今天自己也整理一份安装文档和nginx.conf配置选项的说明,留作以后参考.像负载均衡配置(包括健康检查).缓存( ...
- C#开发中使用配置文件对象简化配置的本地保存
C#开发中使用配置文件对象简化配置的本地保存 0x00 起因 程序的核心是数据和逻辑,开发过程中免不了要对操作的数据进行设置,而有些数据在程序执行过程中被用户或程序做出的修改是应该保存下来的,这样程序 ...
随机推荐
- 为什么java里用常量赋值就相等,用字符串就不等?
例一: String s0="HF"; String s1=new String("HF"); System.out.println(s0==s1); 输入为什 ...
- Win2003+Powershell2.0下无权限解锁账号
在GE环境下,我通过图形界面ADUC可以解锁一个员工账号,但是通过powershell命令却提示权限不足,咋回事? PS C:\Users\814072> Unlock-ADAccount ...
- C++四种强转
C++风格的类型转换提供了4种类型转换操作符来应对不同场合的应用. const_cast,字面上理解就是去const属性. static_cast,命名上理解是静态类型转换.如int转换成char. ...
- jquery CDN(内容分发网络)使用
jquery CDN 给开发者提供一种捷径,即不下载jquary 就通过CDN能使用各个版本的jquery. 使用方法很简单,就是在HTML 文档中引用相关版本的jquery. 例如:我用百度的CDN ...
- backtrack5渗透 笔记
目录 1.信息收集 2.扫描工具 3.漏洞发现 4.社会工程学工具 5.运用层攻击msf 6.局域网攻击 ...
- 如何用Apache POI操作Excel文件-----如何用Apache POI 画一个离散图
有的时候,我们需要Excel中的数据,通过一个图画,可视化的表现出来. 那么这个时候,应该如何做呢?现在就借花献佛,以Apache POI自己提供的一个例子为例,给大家演示一下POI的API 如何画图 ...
- MySQL 数据库设计 笔记与总结(1)需求分析
数据库设计的步骤 ① 需求分析 ② 逻辑设计 使用 ER 图对数据库进行逻辑建模 ③ 物理设计 ④ 维护优化 a. 新的需求进行建表 b. 索引优化 c. 大表拆分 [需求分析] ① 了解系统中所要存 ...
- mysql varchar类型使用心得
自己的一个例子,在存储一个email的需求中.mysql定义的字段,类型:varchar 长度:20 当我插入一个email:huangyuande@sailvan.com 发现怎么样都差不进去.. ...
- javascript中的eval()函数应用以及要点
eval是干嘛用的?eval是直接将一段字符串作为参数,交给JS引擎预编译器进行动态分析并执行代码.如下: //调试台输出,你可以理解为console.log,再不理解就理解成alert也没事 var ...
- HTML: 文檔流是什麼?
[作者好人]:http://www.nowamagic.net/librarys/veda/detail/1190 文档流 将窗体自上而下分成一行行, 并在每行中按从左至右的顺序排放元素,即为文档流. ...