OpenLayers多源数据加载
一、实验内容
栅格瓦片数据加载;
矢量数据加载;
矢量瓦片数据加载。
二、实验步骤
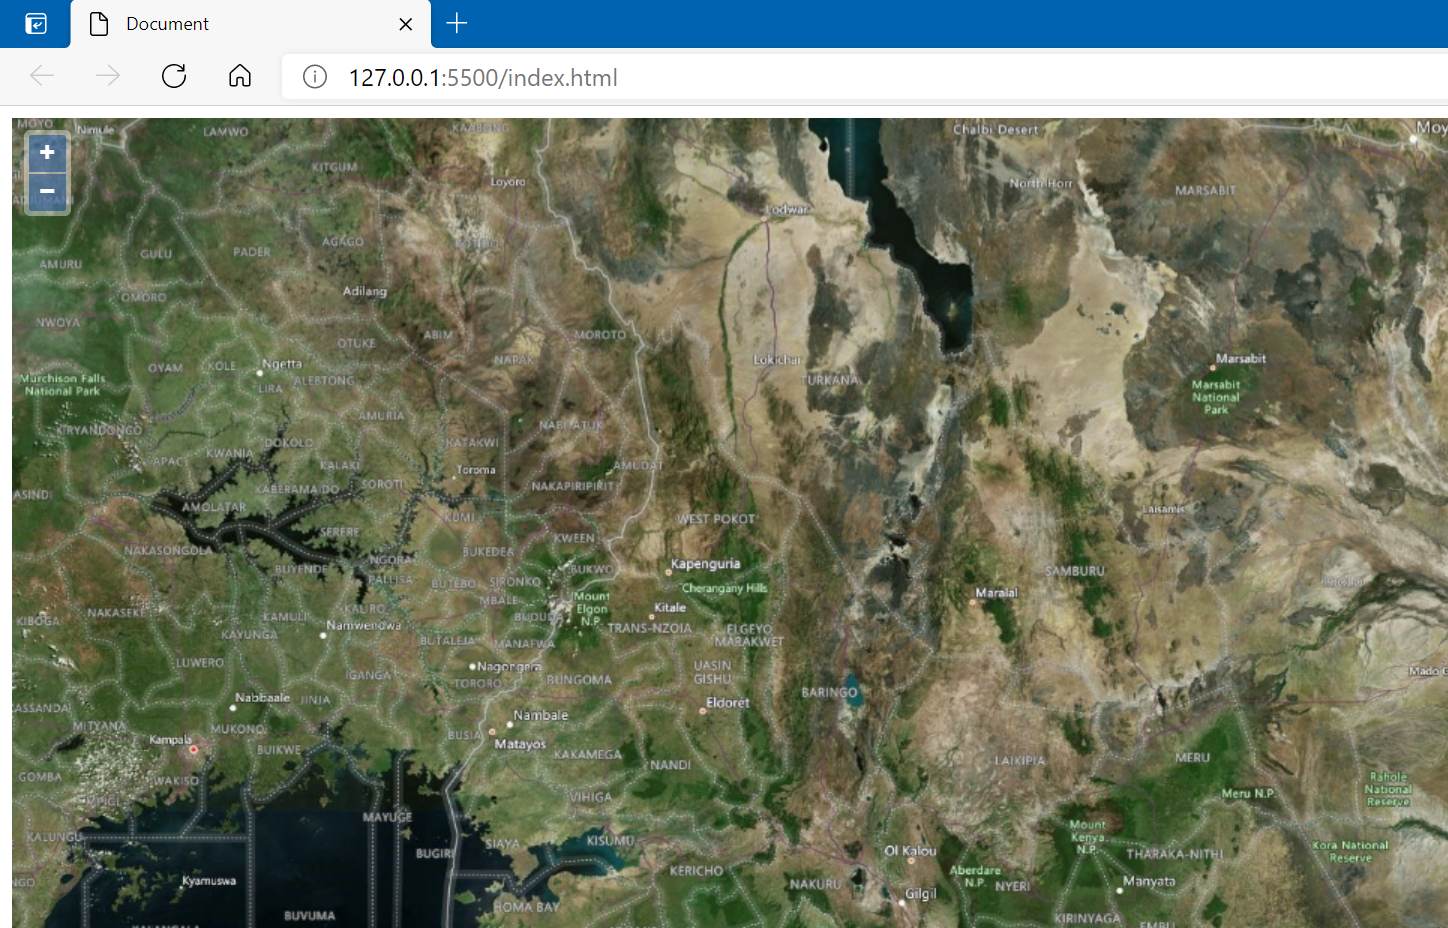
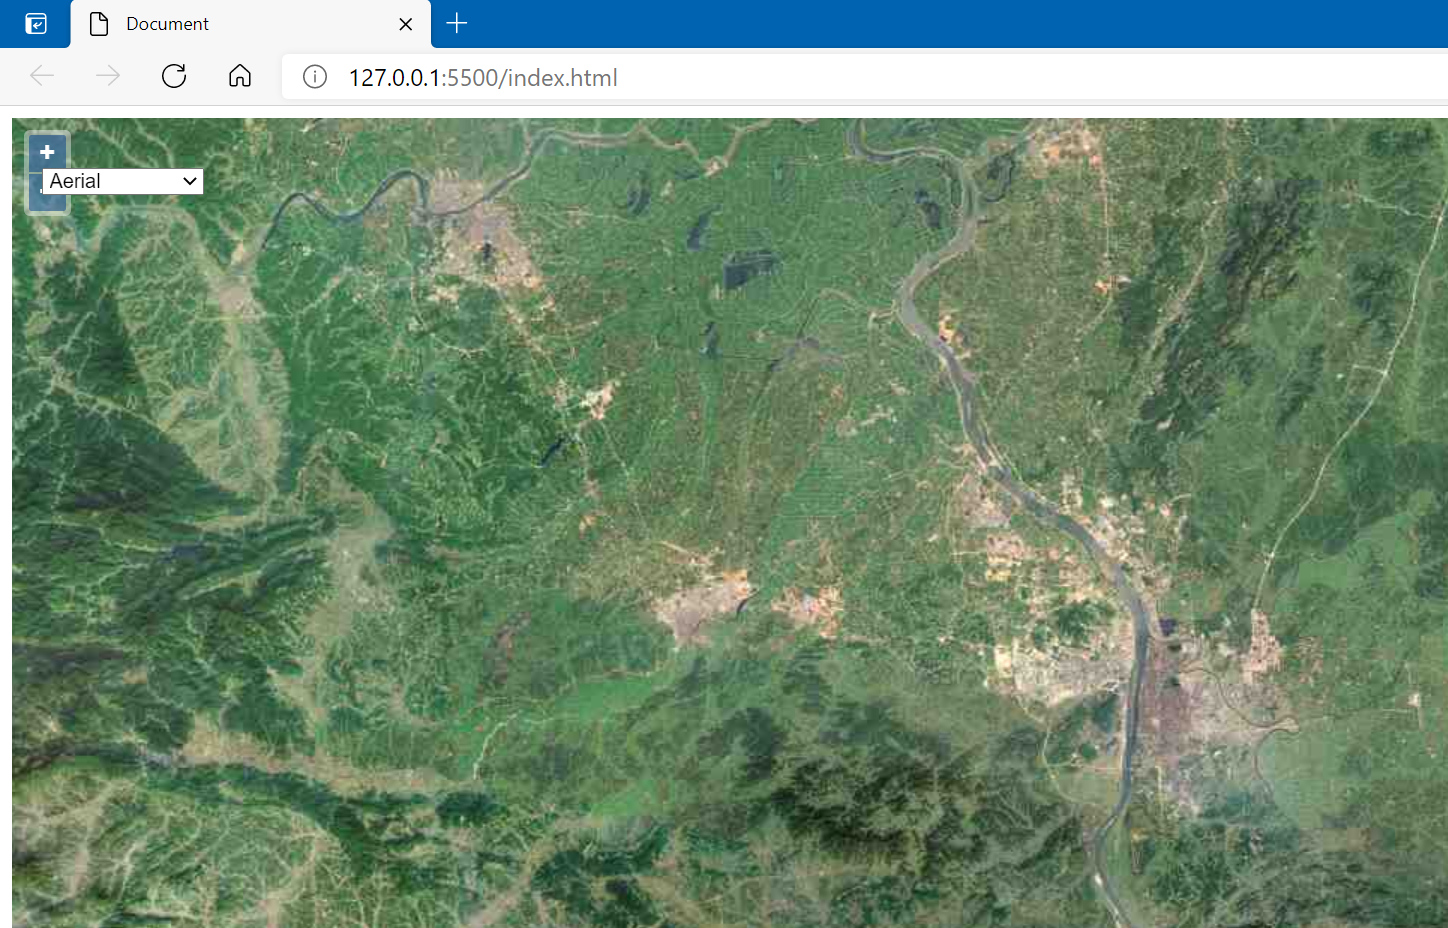
2.1 加载已经封装的在线瓦片地图
<!DOCTYPE html>

<html lang="zh">

<head>

    <meta charset="UTF-8">

    <meta http-equiv="X-UA-Compatible" content="IE=edge">

    <meta name="viewport" content="width=device-width, initial-scale=1.0">

    <title>Document</title>

    <link rel="stylesheet" href="./v6.5.0-dist/ol.css">

    <script src="./v6.5.0-dist/ol.js"></script>

    <style>

        #mymap {

            width:

                100%;

            height: 99%;

            position: absolute;

        }

        #menu {

            position: absolute;

            top: 30px;

            right: 20px;

            z-index: 11;

        }

        #layer-select {

            background-color: rgba(0, 60, 136, .5);

            display: block;

            margin: 1px;

            padding: 0;

            color: #fff;

            font-size: 1. 14em;

            text-decoration: none;

            text-align: center;

            height: 2. 375em;

            width: 8. 375em;

            line-height: .4em;

            border: none;

            border-radius: 0 0 2px 2px;

        }

    </style>

</head>

<body>

    <div id="mymap">

        <div id="menu">

            <select id="layer-select">

                <option value="Aerial">Aerial</option>

                <option value="AerialWithLabelsOnDemand">Aerial with labels</option>

                <option value="RoadOnDemand" selected>Road</option>

                <option value="CanvasDark">Road dark</option>

            </select>

        </div>

    </div>

    <script type="text/javascript">

        var styles = ['RoadOnDemand', 'Aerial',

            'AerialWithLabelsOnDemand', 'CanvasDark'];

        var layers = [];

        var i, ii;

        for (i = 0, ii = styles.length; i < ii; ++i) {

            layers.push(

                new ol.layer.Tile({

                    visible: false,

                    source: new ol.source.BingMaps({

                        key: "ApTJzdkyN1DdFKkRAE6QIDtzihNaf6IWJsT-nQ_2eMoO4PN__0Tzhl2-WgJtXFSp",

                        imagerySet: styles[i],

                    }),

                })

            );

        }

        var map = new ol.Map({

            target: 'mymap',

            layers: layers,

            view: new ol.View({

                center: [0, 0],

                zoom: 2,

                projection: "EPSG:4326"

            })

        });

        var select = document.getElementById('layer-select');

        function onChange() {

            var style = select.value;

            for (var i = 0, ii = layers.length; i < ii; ++i) {

                layers[i].setVisible(styles[i] === style);

            }

        }

        select.addEventListener('change', onChange);

        onChange();

    </script>

</body>

</html>
2.2 利用XYZ加载OSM数据
<!DOCTYPE html>

<html lang="zh">

<head>

    <meta charset="UTF-8">

    <meta http-equiv="X-UA-Compatible" content="IE=edge">

    <meta name="viewport" content="width=device-width, initial-scale=1.0">

    <title>Document</title>

    <link rel="stylesheet" href="./v6.5.0-dist/ol.css">

    <script src="./v6.5.0-dist/ol.js"></script>

    <style>

        #mymap {

            width:

                100%;

            height: 99%;

            position: absolute;

        }

    </style>

</head>

<body>

    <body>

        <div id="mymap"></div>

        <script>

            var openStreetMapLayer = new ol.layer.Tile({

                source: new ol.source.XYZ({

                    url: 'http://{a-c}.tile.openstreetmap.org/{z}/{x}/{y}.png'

                })

            });

            var map = new ol.Map({

                layers: [

                    openStreetMapLayer

                ],

                view: new ol.View({

                    center: [12570904.1896, 3269680.4449],

                    projection: 'EPSG:3857',

                    zoom: 10

                }),

                target: 'mymap'

            });

        </script>

    </body>

</html>
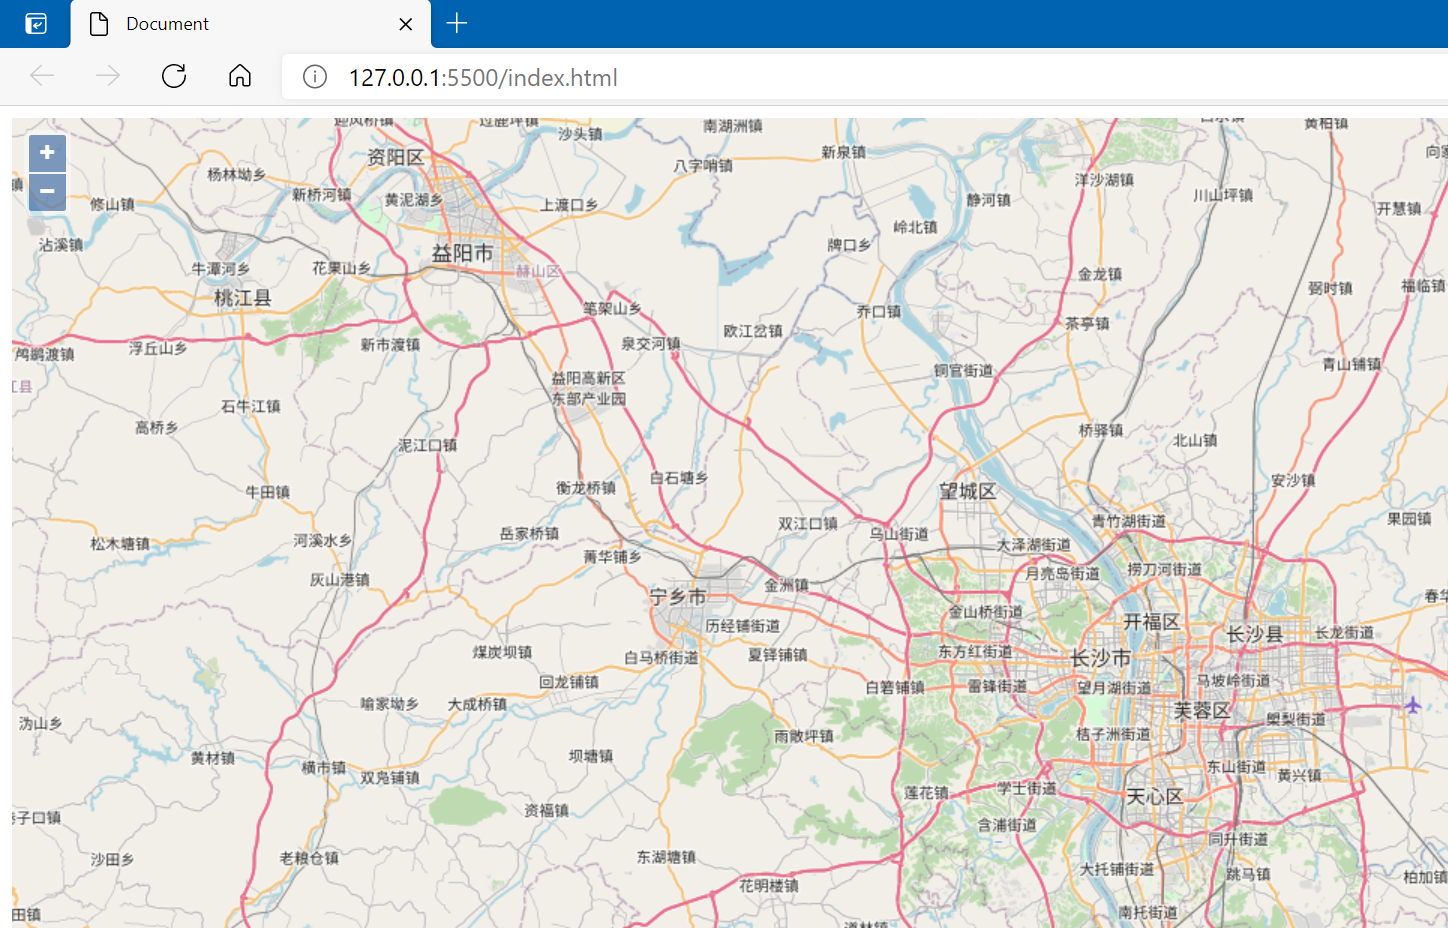
2.3 利用XYZ加载百度地图
<!DOCTYPE html>

<html lang="zh">

<head>

    <meta charset="UTF-8">

    <meta http-equiv="X-UA-Compatible" content="IE=edge">

    <meta name="viewport" content="width=device-width, initial-scale=1.0">

    <title>Document</title>

    <link rel="stylesheet" href="./v6.5.0-dist/ol.css">

    <script src="./v6.5.0-dist/ol.js"></script>

    <style>

        #mymap {

            width:

                100%;

            height: 99%;

            position: absolute;

        }

    </style>

</head>

<body>

    <body>

        <div id="mymap"></div>

        <script type="text/javascript">

            //坐标参考系

            var projection = ol.proj.get("EPSG:3857");

            //分辨率

            var resolutions = [];

            for (var i = 0; i < 19; i++) {

                resolutions[i] = Math.pow(2, 18 - i);

            }

            var tilegrid = new ol.tilegrid.TileGrid({

                origin: [0, 0],

                resolutions: resolutions

            });

            var urlTemplate = "http://online2.map.bdimg.com/tile/?qt=tile&x=" + "{x}"

            + "&y=" + "{y}" + "&z=" + '{z}' + "&styles=pl&udt=20141219&scaler=1"

            //拼接白度地图地址

            var baidu_source = new ol.source.TileImage({

                //设置坐标参考系

                projection: projection,

                //设置分辨率

                tileGrid: tilegrid,

                //出图基地址

                tileUrlFunction: function (tileCoord, pixelRatio, proj) {

                    if (!tileCoord) {

                        return "";

                    }

                    var z = tileCoord[0];

                    var x = tileCoord[1];

                    var y = -tileCoord[2] - 1;

                    if (x < 0) {

                        x = "M" + (-x);

                    }

                    if (y < 0) {

                        y = "M" + (-y);

                    }

                    return urlTemplate.replace('{z}', z.toString())

                        .replace('{y}', y.toString())

                        .replace('{x}', x.toString());

                }

            });

            //百度地图

            var baidu_layer = new

                ol.layer.Tile({

                    source: baidu_source

                });

            //地图容器

            var map = new

                ol.Map({

                    target: 'mymap',

                    layers: [baidu_layer],

                    view: new ol.View({

                        center: [0, 0],

                        zoom: 2

                    })

                });

        </script>

    </body>

</html>
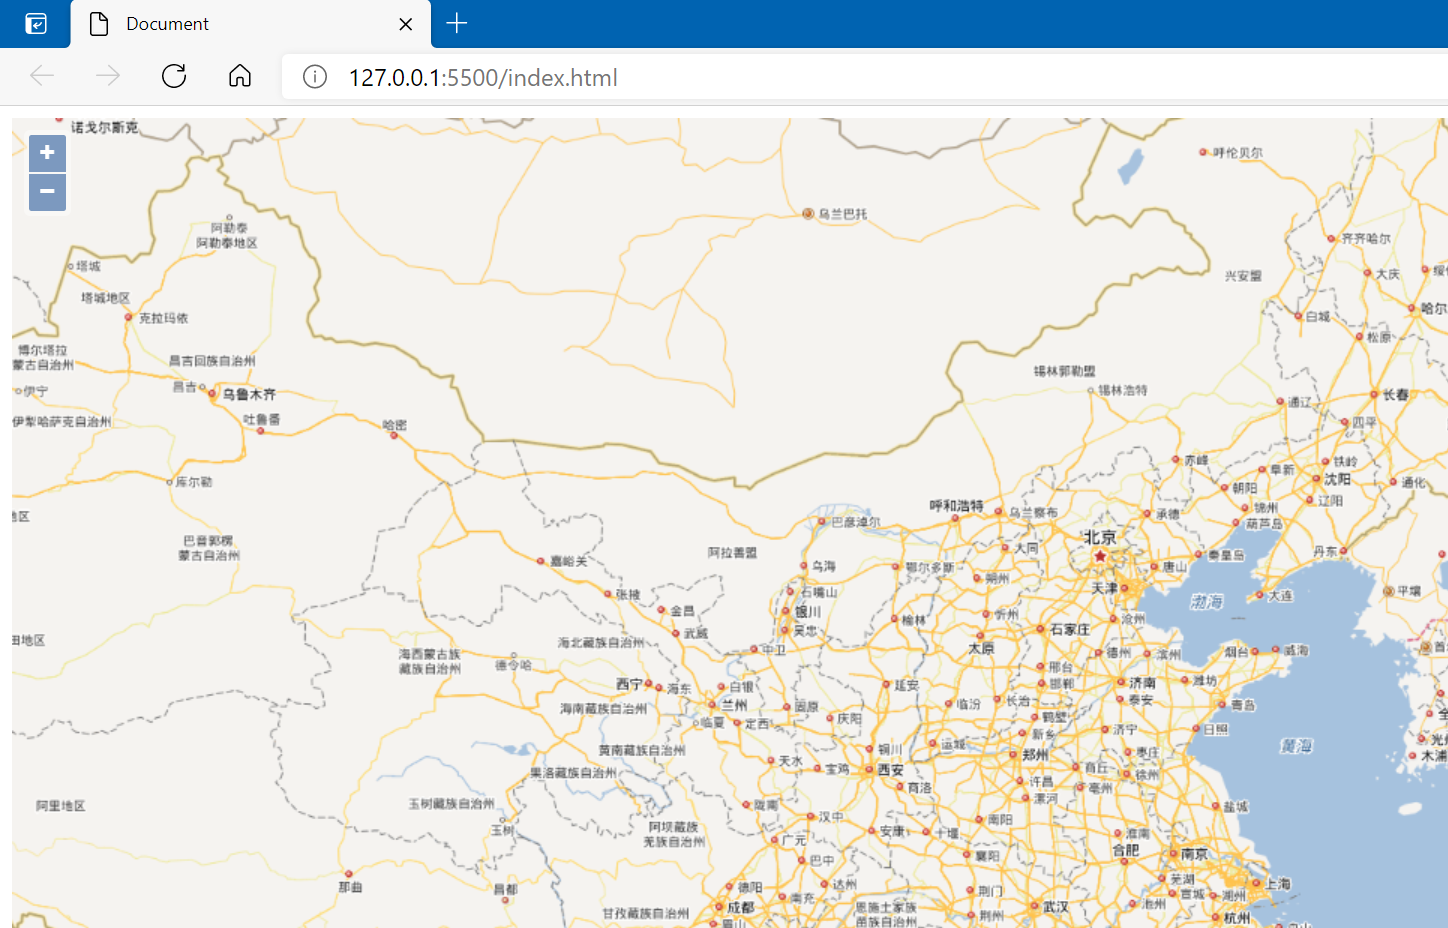
2.4 利用XYZ加载天地图
<!DOCTYPE html>

<html lang="zh">

<head>

    <meta charset="UTF-8">

    <meta http-equiv="X-UA-Compatible" content="IE=edge">

    <meta name="viewport" content="width=device-width, initial-scale=1.0">

    <title>Document</title>

    <link rel="stylesheet" href="./v6.5.0-dist/ol.css">

    <script src="./v6.5.0-dist/ol.js"></script>

    <style>

        #mymap {

            width:

                100%;

            height: 99%;

            position: absolute;

        }

        #menu {

            position: absolute;

            top: 30px;

            left: 20px;

            z-index: 11;

        }

    </style>

</head>

<body>

    <body>

        <div id="mymap">

            <div id="menu">

                <select id="layer-select">

                    <option value="6" selected>Aerial</option>

                    <option value="7">VectorMap</option>

                    <option value="8">Roadwithlable</option>

                </select>

            </div>

        </div>

        <script type="text/javascript">

            var urls = [

                'http://webst0{1-4}.is.autonavi.com/appmaptile?lang=zh_cn&size=1&style=6&x={x}&y={y}&z={z}',

                'http://webst0{1-4}.is.autonavi.com/appmaptile?lang=zh_cn&size=1&style=7&x={x}&y={y}&z={z}',

                'http://webst0{1-4}.is.autonavi.com/appmaptile?lang=zh_cn&size=1&style=8&x={x}&y={y}&z={z}'

            ];

            var layers = [];

            var i, ii;

            for (i = 0, ii = urls.length; i < ii; ++i) {

                layers.push(

                    new ol.layer.Tile({

                        title: "高德地图" + i,

                        source: new ol.source.XYZ({

                            url: urls[i],

                            wrapX: false

                        })

                    })

                );

            }

            var map = new ol.Map({

                target: 'mymap',

                layers: layers,

                view: new ol.View({

                    center: [12570904.1896, 3269680.4449],

                    zoom: 10,

                    minZomm: 1,

                    projection: "EPSG:3857"

                })

            });

            var select = document.getElementById('layer-select');

            function onChange() {

                var style = select.selectedIndex;

                for (var i = 0, ii = layers.length; i < ii; ++i) {

                    layers[i].setVisible(i === style);

                }

            }

            select.addEventListener('change', onChange);

            onChange();

        </script>

    </body>

</html>
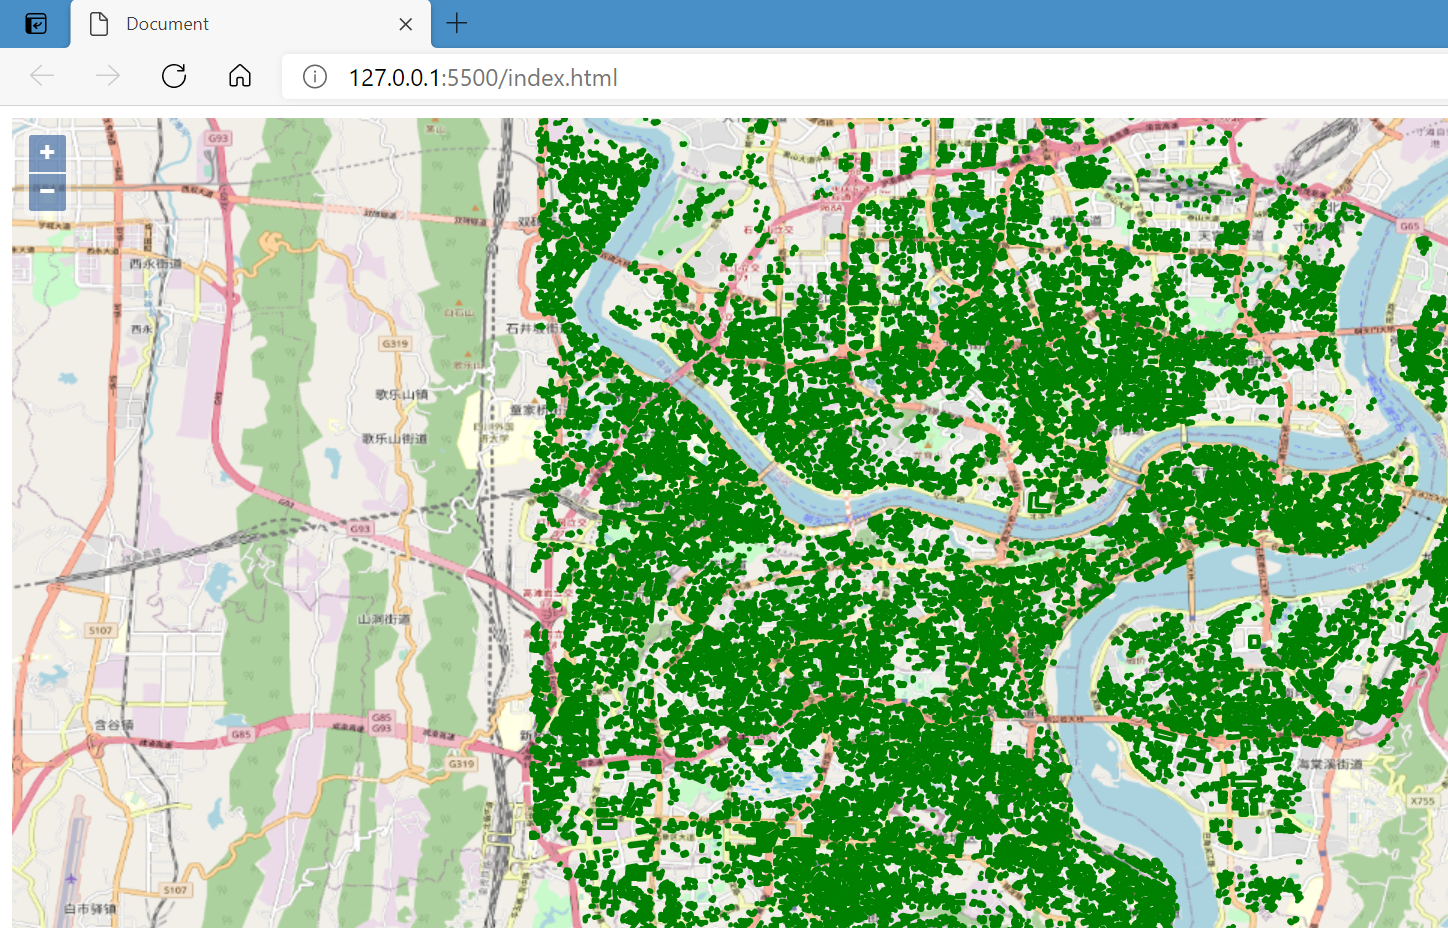
2.5 加载GeoJSON
<!DOCTYPE html>

<html lang="zh">

<head>

    <meta charset="UTF-8">

    <meta http-equiv="X-UA-Compatible" content="IE=edge">

    <meta name="viewport" content="width=device-width, initial-scale=1.0">

    <title>Document</title>

    <link rel="stylesheet" href="./v6.5.0-dist/ol.css">

    <script src="./v6.5.0-dist/ol.js"></script>

    <style>

        #mymap {

            width:

                100%;

            height: 99%;

            position: absolute;

        }

        #menu {

            position: absolute;

            top: 30px;

            left: 20px;

            z-index: 11;

        }

    </style>

</head>

<body>

    <body>

        <div id="mymap"></div>

        <script type="text/javascript">

            var style = new ol.style.Style({

                stroke: new ol.style.Stroke({

                    color: "green",

                    width: 3

                })

            })

            var map = new ol.Map({

                target: "mymap",

                layers: [

                    new ol.layer.Tile({

                        source: new ol.source.OSM()

                    })

                ],

                view: new ol.View({

                    projection: "EPSG:4326",

                    center: [0, 0],

                    zoom: 2

                })

            })

            var vectorSource = new ol.source.Vector({

                url: "./data/data/geojson/buildings.geojson",

                format: new ol.format.GeoJSON()

            })

            var vectorLayer = new ol.layer.Vector({

                style: style,

                source: vectorSource

            })

            map.addLayer(vectorLayer)

        </script>

    </body>

</html>
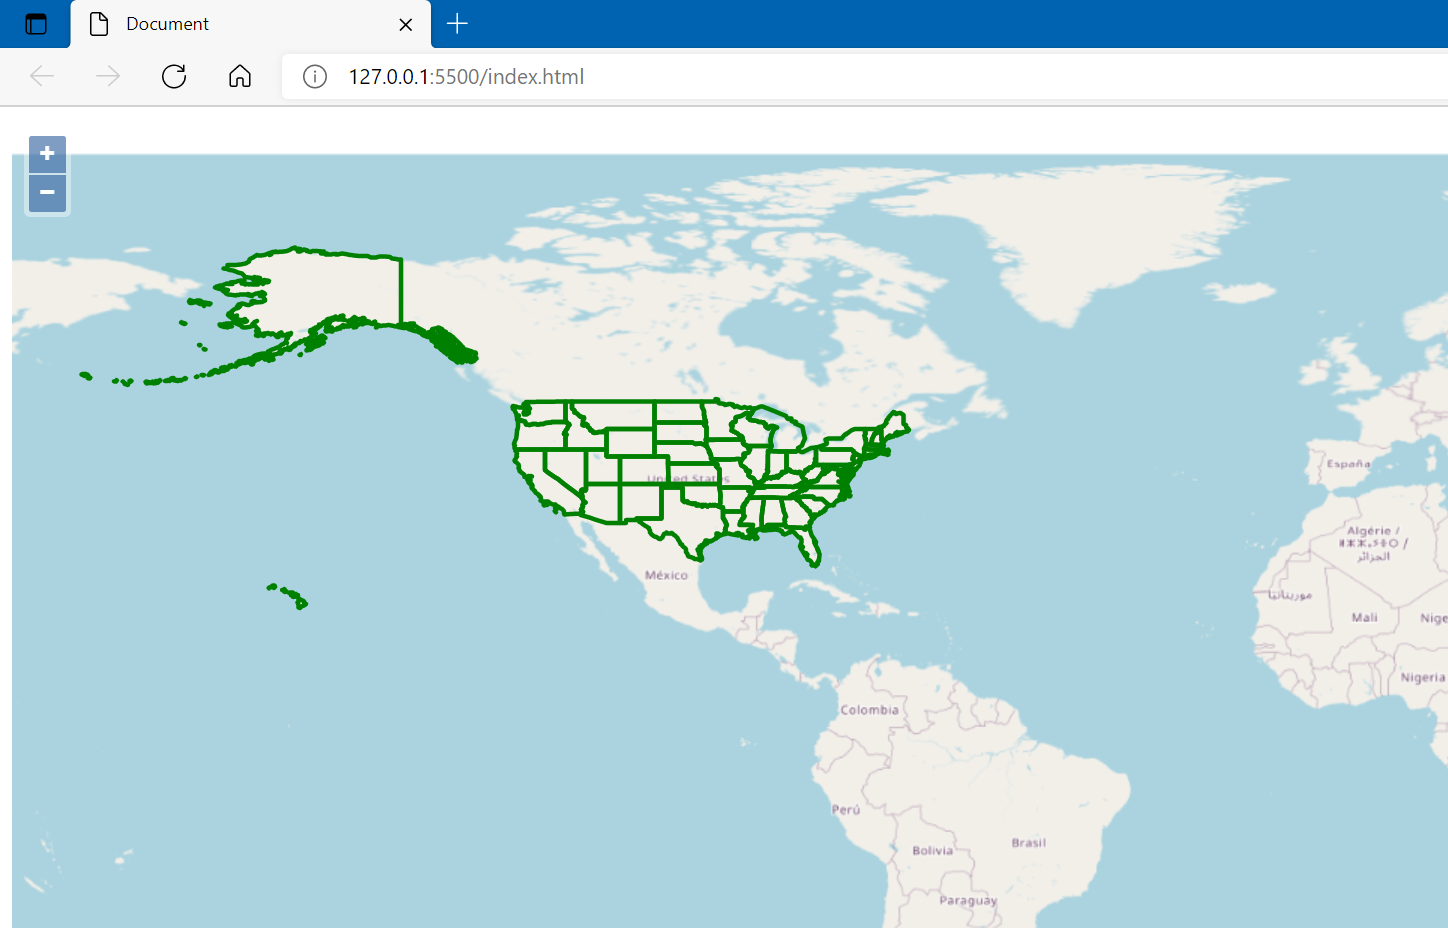
2.6 加载TopoJSON
<!DOCTYPE html>

<html lang="zh">

<head>

    <meta charset="UTF-8">

    <meta http-equiv="X-UA-Compatible" content="IE=edge">

    <meta name="viewport" content="width=device-width, initial-scale=1.0">

    <title>Document</title>

    <link rel="stylesheet" href="./v6.5.0-dist/ol.css">

    <script src="./v6.5.0-dist/ol.js"></script>

    <style>

        #mymap {

            width:

                100%;

            height: 99%;

            position: absolute;

        }

        #menu {

            position: absolute;

            top: 30px;

            left: 20px;

            z-index: 11;

        }

    </style>

</head>

<body>

    <body>

        <div id="mymap"></div>

        <script type="text/javascript">

            var style = new ol.style.Style({

                stroke: new ol.style.Stroke({

                    color: "green",

                    width: 3

                })

            })

            var map = new ol.Map({

                target: "mymap",

                layers: [

                    new ol.layer.Tile({

                        source: new ol.source.OSM()

                    })

                ],

                view: new ol.View({

                    projection: "EPSG:4326",

                    center: [0, 0],

                    zoom: 2

                })

            })

            var vectorSource = new ol.source.Vector({

                url: "./data/data/topojson/ne_10m_us_states.topojson",

                format: new ol.format.TopoJSON()

            })

            var vectorLayer = new ol.layer.Vector({

                style: style,

                source: vectorSource

            })

            map.addLayer(vectorLayer)

        </script>

    </body>

</html>
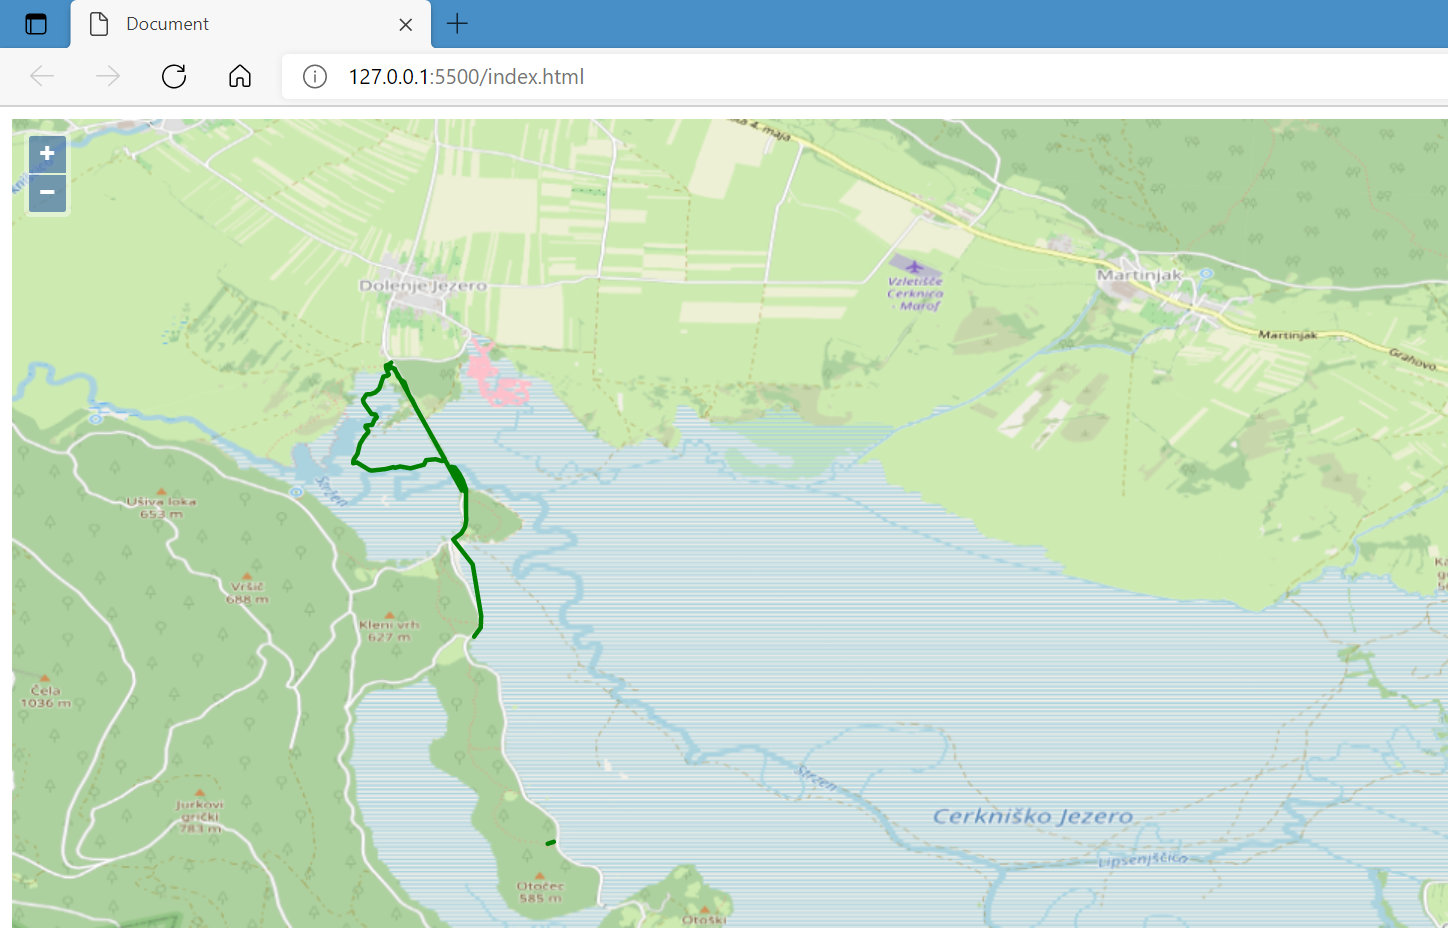
2.7 加载GPX
<!DOCTYPE html>

<html lang="zh">

<head>

    <meta charset="UTF-8">

    <meta http-equiv="X-UA-Compatible" content="IE=edge">

    <meta name="viewport" content="width=device-width, initial-scale=1.0">

    <title>Document</title>

    <link rel="stylesheet" href="./v6.5.0-dist/ol.css">

    <script src="./v6.5.0-dist/ol.js"></script>

    <style>

        #mymap {

            width:

                100%;

            height: 99%;

            position: absolute;

        }

        #menu {

            position: absolute;

            top: 30px;

            left: 20px;

            z-index: 11;

        }

    </style>

</head>

<body>

    <body>

        <div id="mymap"></div>

        <script type="text/javascript">

            var style = new ol.style.Style({

                stroke: new ol.style.Stroke({

                    color: "green",

                    width: 3

                })

            })

            var map = new ol.Map({

                target: "mymap",

                layers: [

                    new ol.layer.Tile({

                        source: new ol.source.OSM()

                    })

                ],

                view: new ol.View({

                    projection: "EPSG:4326",

                    center: [14.357652292, 45.772163216],

                    zoom: 10

                })

            })

            var vectorSource = new ol.source.Vector({

                url: "./data/data/gpx/cerknicko-jezero.gpx",

                format: new ol.format.GPX()

            })

            var vectorLayer = new ol.layer.Vector({

                style: style,

                source: vectorSource

            })

            map.addLayer(vectorLayer)

        </script>

    </body>

</html>
2.8 加载KML
<!DOCTYPE html>

<html lang="zh">

<head>

    <meta charset="UTF-8">

    <meta http-equiv="X-UA-Compatible" content="IE=edge">

    <meta name="viewport" content="width=device-width, initial-scale=1.0">

    <title>Document</title>

    <link rel="stylesheet" href="./v6.5.0-dist/ol.css">

    <script src="./v6.5.0-dist/ol.js"></script>

    <style>

        #mymap {

            width:

                100%;

            height: 99%;

            position: absolute;

        }

        #menu {

            position: absolute;

            top: 30px;

            left: 20px;

            z-index: 11;

        }

    </style>

</head>

<body>

    <body>

        <div id="mymap"></div>

        <script type="text/javascript">

            var style = new ol.style.Style({

                stroke: new ol.style.Stroke({

                    color: "green",

                    width: 3

                })

            })

            var map = new ol.Map({

                target: "mymap",

                layers: [

                    new ol.layer.Tile({

                        source: new ol.source.OSM()

                    })

                ],

                view: new ol.View({

                    projection: "EPSG:4326",

                    center: [7.5083945,46.4586075],

                    zoom: 14

                })

            })

            var vectorSource = new ol.source.Vector({

                url: "./data/data/kml/2012-02-10.kml",

                format: new ol.format.KML()

            })

            var vectorLayer = new ol.layer.Vector({

                style: style,

                source: vectorSource

            })

            map.addLayer(vectorLayer)

        </script>

    </body>

</html>
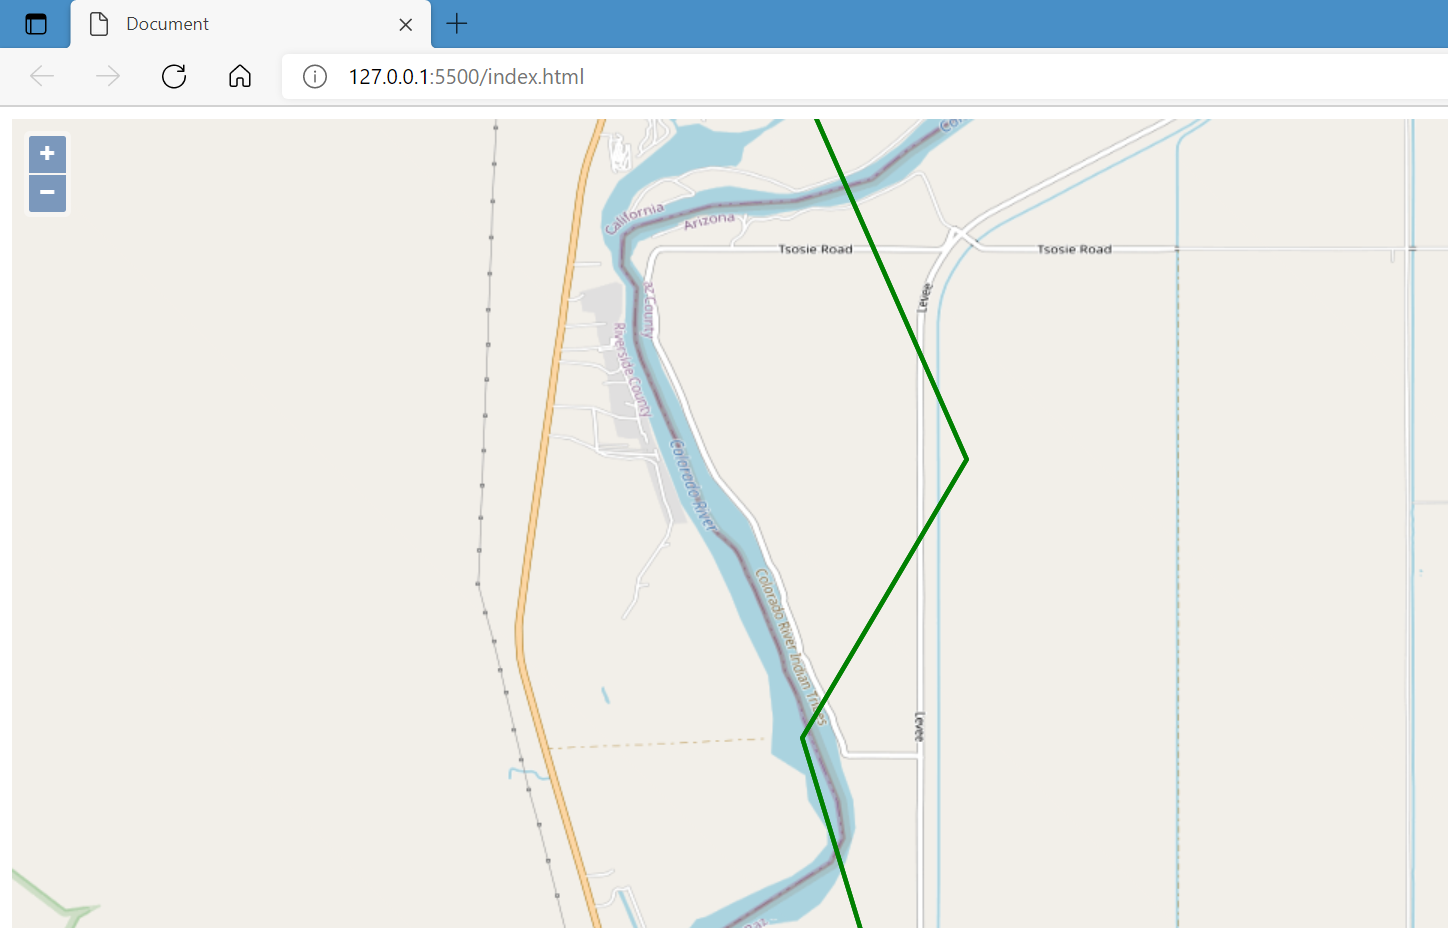
2.9 加载GML
<!DOCTYPE html>

<html lang="zh">

<head>

    <meta charset="UTF-8">

    <meta http-equiv="X-UA-Compatible" content="IE=edge">

    <meta name="viewport" content="width=device-width, initial-scale=1.0">

    <title>Document</title>

    <link rel="stylesheet" href="./v6.5.0-dist/ol.css">

    <script src="./v6.5.0-dist/ol.js"></script>

    <style>

        #mymap {

            width:

                100%;

            height: 99%;

            position: absolute;

        }

        #menu {

            position: absolute;

            top: 30px;

            left: 20px;

            z-index: 11;

        }

    </style>

</head>

<body>

    <body>

        <div id="mymap"></div>

        <script type="text/javascript">

            var style = new ol.style.Style({

                stroke: new ol.style.Stroke({

                    color: "green",

                    width: 3

                })

            })

            var map = new ol.Map({

                target: "mymap",

                layers: [

                    new ol.layer.Tile({

                        source: new ol.source.OSM()

                    })

                ],

                view: new ol.View({

                    projection: "EPSG:4326",

                    center: [-114.50376, 33.826012000000006],

                    zoom: 14

                })

            })

            var vectorSource = new ol.source.Vector({

                url: "./data/data/gml/topp-states-wfs.xml",

                format: new ol.format.GML3()

            })

            var vectorLayer = new ol.layer.Vector({

                style: style,

                source: vectorSource

            })

            map.addLayer(vectorLayer)

            let mousePosition = new ol.control.MousePosition()

            map.addControl(mousePosition)

        </script>

    </body>

</html>
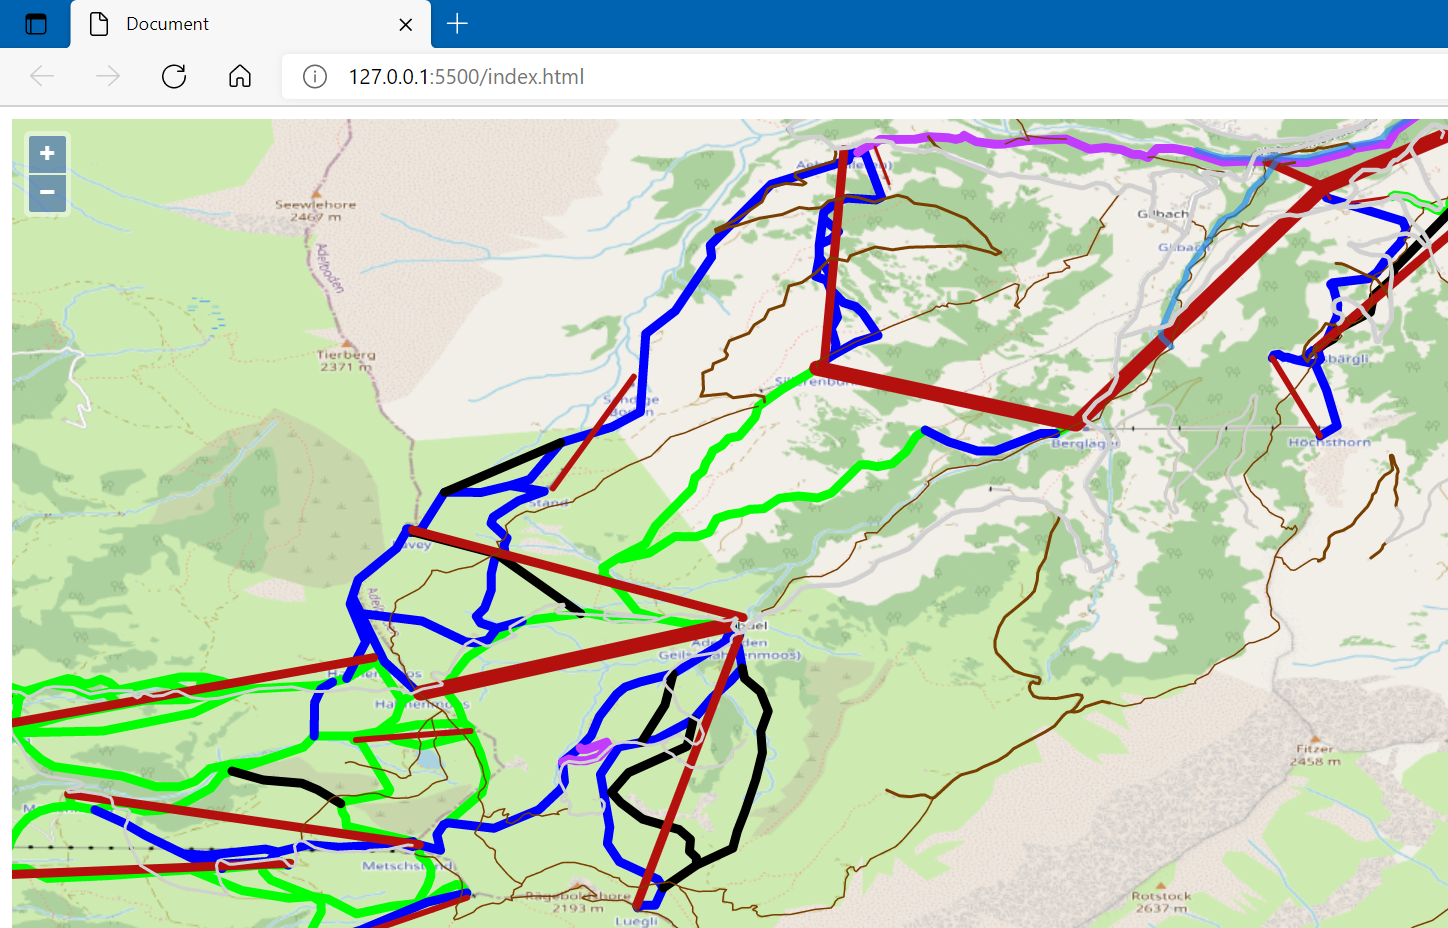
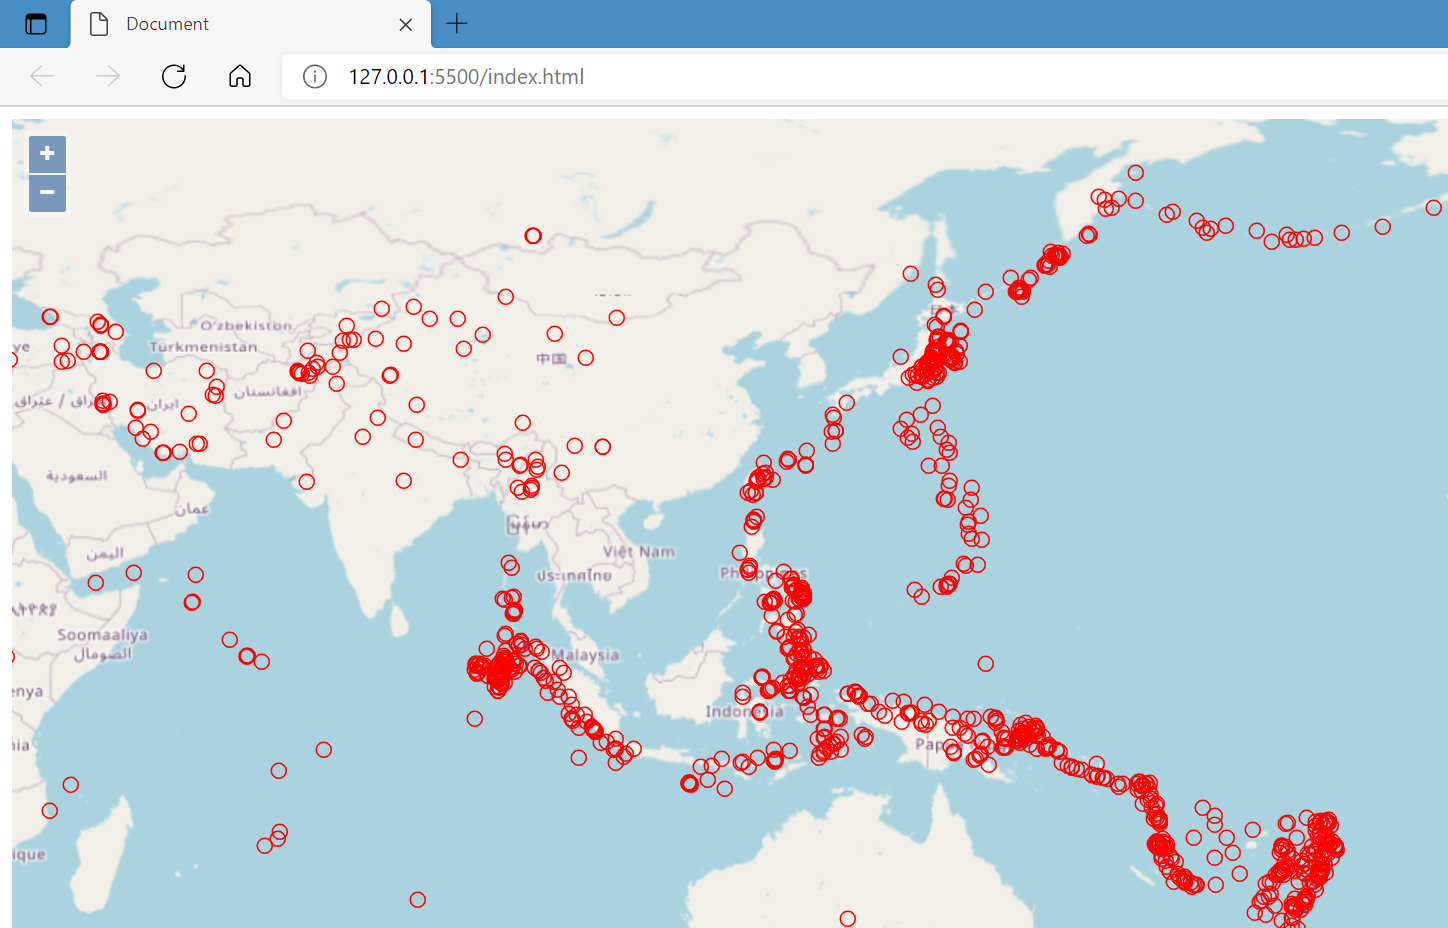
2.10 矢量数据样式练习一
<!DOCTYPE html>

<html lang="zh">

<head>

    <meta charset="UTF-8">

    <meta http-equiv="X-UA-Compatible" content="IE=edge">

    <meta name="viewport" content="width=device-width, initial-scale=1.0">

    <title>Document</title>

    <link rel="stylesheet" href="./v6.5.0-dist/ol.css">

    <script src="./v6.5.0-dist/ol.js"></script>

    <style>

        #mymap {

            width:

                100%;

            height: 99%;

            position: absolute;

        }

        #menu {

            position: absolute;

            top: 30px;

            left: 20px;

            z-index: 11;

        }

    </style>

</head>

<body>

    <body>

        <div id="mymap"></div>

        <script type="text/javascript">

            var projection = ol.proj.get('EPSG:4326')

            var image = new ol.style.Circle({

                radius: 5,

                fill: null,

                stroke: new ol.style.Stroke({

                    color: 'red',

                    width: 1

                })

            })

            var styles = {

                'Point': [new ol.style.Style({

                    image: image

                })],

                'LineString': [new ol.style.Style({

                    stroke: new ol.style.Stroke({

                        color: "green",

                        width: 1

                    })

                })],

                'MultiLineString': [new ol.style.Style({

                    stroke: new ol.style.Stroke({

                        color: 'green',

                        width: 1

                    })

                })],

                'MultiPoint':[new ol.style.Style({

                    image:image

                })],

                'MultiPolygon':[new ol.style.Style({

                    stroke:new ol.style.Stroke({

                        color:'yellow',

                        width:1

                    }),

                    fill:new ol.style.Fill({

                        color:'rgba(255,255,0,0.1)'

                    })

                })],

                'Polygon':[new ol.style.Style({

                    stroke:new ol.style.Stroke({

                        color:'blue',

                        lineDash:[4],

                        width:3

                    }),

                    fill:new ol.style.Fill({

                        color:'rgba(0,0,255,0.1)'

                    })

                })],

                'GeometryCollection':[new ol.style.Style({

                    stroke:new ol.style.Stroke({

                        color:'magenta',

                        width:2

                    }),

                    fill:new ol.style.Fill({

                        color:'magenta'

                    }),

                    image:new ol.style.Circle({

                        radius:10,

                        fill:null,

                        stroke:new ol.style.Stroke({

                            color:'magenta'

                        })

                    })

                })],

                'Circle':[new ol.style.Style({

                    stroke:new ol.style.Stroke({

                        color:'red',

                        width:2

                    }),

                    fill:new ol.style.Fill({

                        color:'rgba(255,0,0,0.2)'

                    })

                })]

            }

            var styleFunction=function (feature,resolution){

                return styles[feature.getGeometry().getType()]

            }

            var map = new ol.Map({

                target: "mymap",

                layers: [

                    new ol.layer.Tile({

                        source: new ol.source.OSM()

                    })

                ],

                view: new ol.View({

                    projection: "EPSG:4326",

                    center: [7.5083945, 46.4586075],

                    zoom: 8

                })

            })

            var vectorSource = new ol.source.Vector({

                url: "./data/data/kml/2012_Earthquakes_Mag5.kml",

                format: new ol.format.KML({

                    extractStyles:false

                })

            })

            var vectorLayer = new ol.layer.Vector({

                style: styleFunction,

                source: vectorSource

            })

            map.addLayer(vectorLayer)

            let mousePosition = new ol.control.MousePosition()

            map.addControl(mousePosition)

        </script>

    </body>

</html>
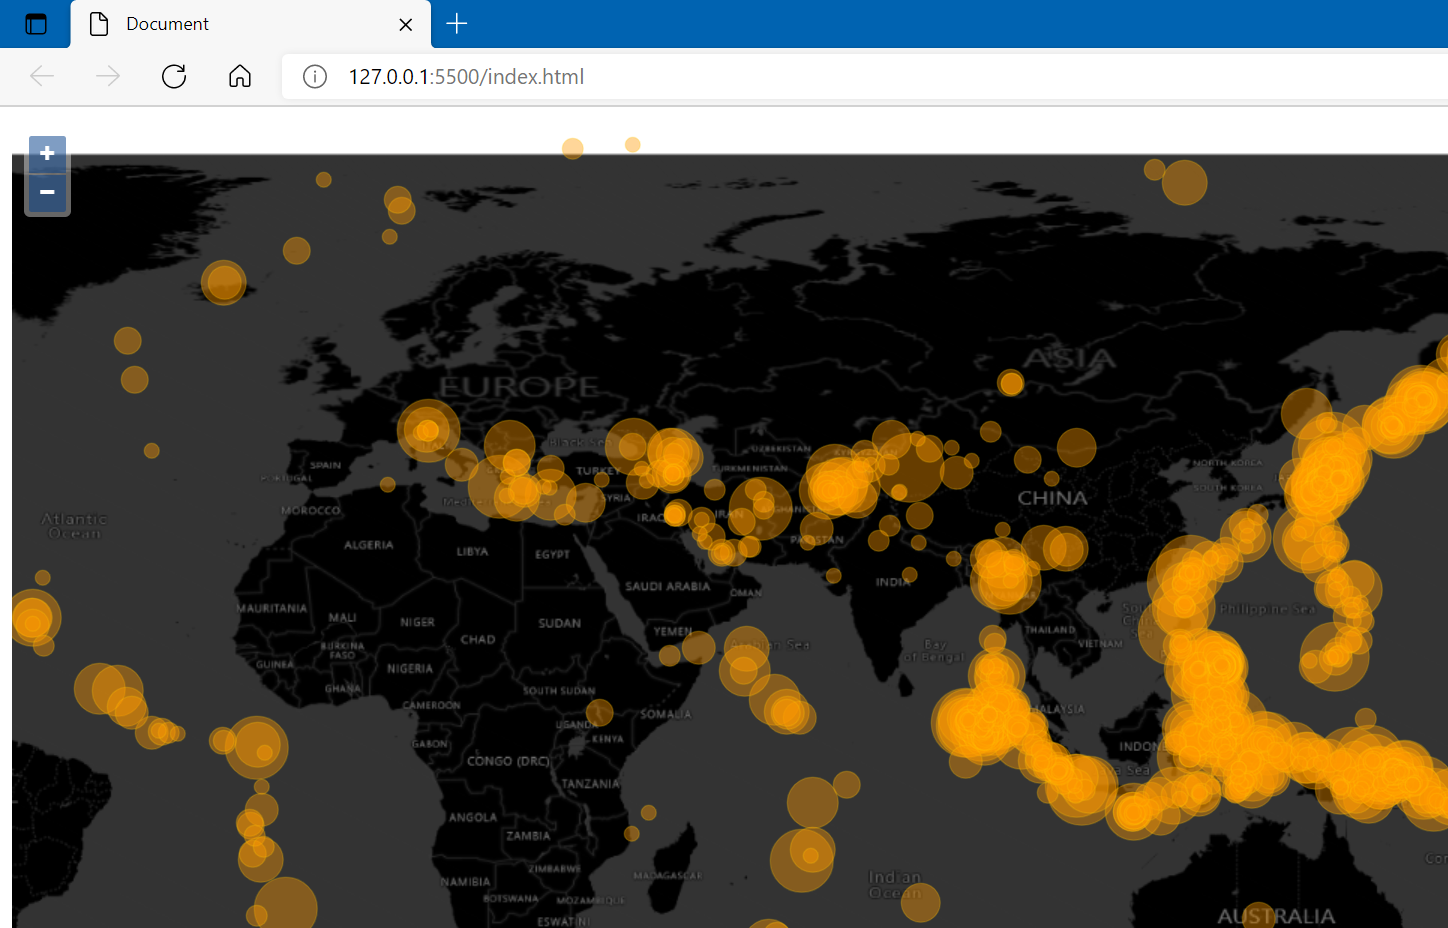
2.11 矢量数据样式练习二
<!DOCTYPE html>

<html lang="zh">

<head>

    <meta charset="UTF-8">

    <meta http-equiv="X-UA-Compatible" content="IE=edge">

    <meta name="viewport" content="width=device-width, initial-scale=1.0">

    <title>Document</title>

    <link rel="stylesheet" href="./v6.5.0-dist/ol.css">

    <script src="./v6.5.0-dist/ol.js"></script>

    <style>

        #mymap {

            width:

                100%;

            height: 99%;

            position: absolute;

        }

        #menu {

            position: absolute;

            top: 30px;

            left: 20px;

            z-index: 11;

        }

    </style>

</head>

<body>

    <body>

        <div id="mymap"></div>

        <script type="text/javascript">

            var projection = ol.proj.get('EPSG:4326')

            var styleCache = {}

            var styleFunction = function (feature, resolution) {

                var name = feature.get('name')

                var magnitude = parseFloat(name.substr(2))

                var radius = 5 + 20 * (magnitude - 5)

                var style = styleCache[radius]

                console.log(feature)

                if (!style) {

                    style = new ol.style.Style({

                        image: new ol.style.Circle({

                            radius: radius,

                            fill: new ol.style.Fill({

                                color: 'rgba(255, 153, 0,0.4)',

                            }),

                            stroke: new ol.style.Stroke({

                                color: 'rgba(255, 204, 0,0.2)',

                                width: 1,

                            }),

                        }),

                    });

                    styleCache[radius] = style;

                }

                return style;

            }

            var map = new ol.Map({

                target: "mymap",

                layers: [

                    new ol.layer.Tile({

                        source: new ol.source.BingMaps({

                            key: 'ApTJzdkyN1DdFKkRAE6QIDtzihNaf6IWJsT-nQ_2eMoO4PN__0Tzhl2-WgJtXFSp',

                            imagerySet: 'CanvasDark'

                        })

                    })

                ],

                view: new ol.View({

                    projection: "EPSG:4326",

                    center: [7.5083945, 46.4586075],

                    zoom: 2

                })

            })

            var vectorSource = new ol.source.Vector({

                url: "./data/data/kml/2012_Earthquakes_Mag5.kml",

                format: new ol.format.KML({

                    extractStyles: false

                })

            })

            var vectorLayer = new ol.layer.Vector({

                style: styleFunction,

                source: vectorSource

            })

            map.addLayer(vectorLayer)

            let mousePosition = new ol.control.MousePosition()

            map.addControl(mousePosition)

        </script>

    </body>

</html>
2.12 矢量瓦片数据加载
<!DOCTYPE html>

<html lang="zh">

<head>

    <meta charset="UTF-8">

    <meta http-equiv="X-UA-Compatible" content="IE=edge">

    <meta name="viewport" content="width=device-width, initial-scale=1.0">

    <title>Document</title>

    <link rel="stylesheet" href="./v6.5.0-dist/ol.css">

    <script src="./v6.5.0-dist/ol.js"></script>

    <style>

        #mymap {

            width: 100%;

            height: 99%;

            position: absolute;

        }

    </style>

</head>

<body>

    <body>

        <div id="mymap"></div>

        <script type="text/javascript">

            var map = new ol.Map({

                target: "mymap",

                layers: [

                    new ol.layer.Tile({

                        source: new ol.source.BingMaps({

                            key: 'ApTJzdkyN1DdFKkRAE6QIDtzihNaf6IWJsT-nQ_2eMoO4PN__0Tzhl2-WgJtXFSp',

                            imagerySet: 'AerialWithLabelsOnDemand'

                        })

                    })

                ],

                view: new ol.View({

                    center: [0, 0],

                    zoom: 2

                })

            })

            var tileLayer = new ol.layer.VectorTile({

                source: new ol.source.VectorTile({

                    format: new ol.format.MVT(),

                    url:

                        'https://ahocevar.com/geoserver/gwc/service/tms/1.0.0/' +

                        'ne:ne_10m_admin_0_countries@EPSG%3A900913@pbf/{z}/{x}/{-y}.pbf'

                })

            })

            var wmsLayer = new ol.layer.Image({

                source: new ol.source.ImageWMS({

                    url: 'https://ahocevar.com/geoserver/wms',

                    params: { 'LAYERS': 'topp:states' },

                    ratio: 1,

                    serverType: 'geoserver',

                })

            });

            map.addLayer(wmsLayer)

            map.addLayer(tileLayer)

            let mousePosition = new ol.control.MousePosition()

            map.addControl(mousePosition)

        </script>

    </body>

</html>
OpenLayers多源数据加载的更多相关文章
- 使用openlayers 3 在线加载天地图及GeoServer发布的地图
使用openlayers3来加载天地图卫星图和标注图层,GeoServer发布地图,一并用openlayers测试加载出来,顺便实现了7种地图控件.下面直接贴代码: <!DOCTYPE html ...
- (转)Openlayers 2.X加载天地图
http://blog.csdn.net/gisshixisheng/article/details/44621923 概述: 在前面的章节,讲到了Arcgis for js加载天地图,在本节讲述如何 ...
- (转)Openlayers 2.X加载高德地图
http://blog.csdn.net/gisshixisheng/article/details/44853881 概述: 前面的有篇文章介绍了Openlayers 2.X下加载天地图,本节介绍O ...
- OpenLayers加载QQ地图(转)
OpenLayers加载QQ地图 http://www.openlayers.cn/portal.php?mod=view&aid=4 2012-10-21 17:22| 发布者: admin ...
- openlayers的loaders方式加载
openlayers loaders方式加载 let layerVector = new ol.layer.Vector({ source : new ol.source.Vector({ loade ...
- 通过openlayers加载dwg格式的CAD图并与互联网地图叠加
Openlayers介绍 Openlayers是一个基于Javacript开发,免费.开源的前端地图开发库,使用它,可以很容易的开发出WebGIS系统.目前Openlayers支持地图瓦片.矢量数 ...
- OpenLayers 3加载本地Google切片地图
OpenLayers 提供了ol.source.XYZ 接口用以加载切片地图. 本地切片地图是用地图切片下载器下载的Google道路图层,由于软件未激活,所以每张切片地图上都有软件作者的联系方式,请 ...
- openlayers 加载瓦片详解 一
在这先说点题外话,本人在研究webgl 三维球过程中惊人发现,openlayers 的开发人员也在研究webgl并经证实他们也正在研发基于 webgl的三维gis开源平台,这可能是首个开源的三维平台, ...
- OpenLayers学习笔记(十)— 动态加载JSON数据模拟航迹线
在openlayers 3 上,加载本地json数据,动态绘制航迹线,以飞机当前位置为地图中心,此例子是模拟DEMO 本文链接:动态加载JSON数据模拟航迹线 作者:狐狸家的鱼 GitHub:八至 前 ...
- OpenLayers学习笔记(一)—在线加载谷歌影像地图&离线加载本地瓦片地图
实现根据在线离线判断加载地图, 在线加载谷歌影响地图, 离线加载本地瓦片地图 作者: 狐狸家的鱼 Github: 八至 html代码 <div id="map" tabind ...
随机推荐
- 【每日一题】【回溯】【StringBuilder】2021年12月7日-17. 电话号码的字母组合
给定一个仅包含数字 2-9 的字符串,返回所有它能表示的字母组合.答案可以按 任意顺序 返回. 给出数字到字母的映射如下(与电话按键相同).注意 1 不对应任何字母. 来源:力扣(LeetCode)链 ...
- loadrunner11汉化时提示模块插件无法注册的解决方法
安装汉化程序时,关闭杀毒软件.
- 时隔3个月,Uber 再遭数据泄露...
在今年9月,Uber 就发生过一起数据泄露事件,尽管黑客并无意发动大规模攻击或以此来获取巨额利益,但其成功获取对 Uber 所有敏感服务的完全管理员访问权限仍令人后怕.而在上周,名为"Ube ...
- ClickHouse MergeTree引擎
Clickhouse 中最强大的表引擎当属 MergeTree (合并树)引擎及该系列(*MergeTree)中的其他引擎. MergeTree 系列的引擎被设计用于插入极大量的数据到一张表当中.数据 ...
- MyBatis四大参数两种写法
MyBatis四大参数两种写法 1.在主配置文件中,直接写到value值里面 2.四大参数写入单独配置文件 开始是 为了避免以后其他框架冲突 都加个前缀 jdbc. 主要是红色框里的三个部分 自己定义 ...
- YMOI 2019.6.29
题解 YMOI 2019.6.29 放弃FAIOJ,用cena考了一次试.被全方位吊打.. T1 开灯 题面: 在一条无限长的路上,有一排无限长的路灯,编号为1,2,3,4,--. 每一盏灯只有两种可 ...
- .NetCore下基于FreeRedis实现的Redis6.0客户端缓存之缓存键条件优雅过滤
前言 众所周知内存缓存(MemoryCache)数据是从内存中获取,性能表现上是最优的,但是内存缓存有一个缺点就是不支持分布式,数据在各个部署节点上各存一份,每份缓存的过期时间不一致,会导致幻读等各种 ...
- P1278 单词游戏【题解】(状压dp)
单词游戏 题目描述 Io和Ao在玩一个单词游戏. 他们轮流说出一个仅包含元音字母的单词,并且后一个单词的第一个字母必须与前一个单词的最后一个字母一致. 游戏可以从任何一个单词开始. 任何单词禁止说两遍 ...
- Python 内置界面开发框架 Tkinter入门篇 乙
本文大概 1685 个字,阅读需花 6 分钟内容不多, 但也花了一些精力如要交流, 欢迎关注我然后评论区留言 谢谢你的点赞收藏分享 这篇文章属于系列文章<Python 内置界面开发框架 Tkin ...
- 电脑本地安装不同版本MySQL
本地已经安装了mysql5.7版本,想测试mysql8版本的用法,想在一台电脑同时配置不同版本的mysql在不同端口号,看起来简单,实现起来其实挺多坑的,总结下实战经验和大家分享下 一.下载安装 下载 ...