Prometheus 集成 Node Exporter
文章首发于公众号《程序员果果》
地址:https://mp.weixin.qq.com/s/40ULB9UWbXVA21MxqnjBxw
简介
Prometheus 官方和一些第三方,已经把一些常用数据库、系统、中间件等的指标数据的采集做成了一个个 exporter,在生产环境中,直接导入使用就可以。 这一节,我们就用 Prometheus 官方提供的 Node Exporter 来完成对Linux系统运行数据的采集 。
实验
Node Exporter 安装及运行
在一台 Linux 机器上安装并运行 Node Exporter,我使用的是一台 ip 为 172.16.2.101 的Linux 虚拟机。
下载地址:https://github.com/prometheus/node_exporter/releases
下载并解压:
wget https://github.com/prometheus/node_exporter/releases/download/v0.18.1/node_exporter-0.18.1.linux-amd64.tar.gz

tar zxvf node_exporter-0.18.1.linux-amd64.tar.gz
进入 node_exporter-0.18.1.linux-amd64 文件夹 启动node_exporter:
./node_exporter
Prometheus 配置
在 prometheus.yml 中配置 node_exporter 的metrics 端点,内容如下:
global:

  scrape_interval: 5s

  evaluation_interval: 5s

  scrape_timeout: 5s

scrape_configs:

  - job_name: 'prometheus'

    static_configs:

    - targets: ['localhost:9090']

  - job_name: 'linux-exporter'

    metrics_path: /metrics

    static_configs:

    - targets: ['172.16.2.101:9100']
启动 prometheus:
docker run --name prometheus -d -p 9090:9090 -v /root/prometheus-data:/prometheus-data \

       prom/prometheus --web.enable-lifecycle --config.file=/prometheus-data/prometheus.yml
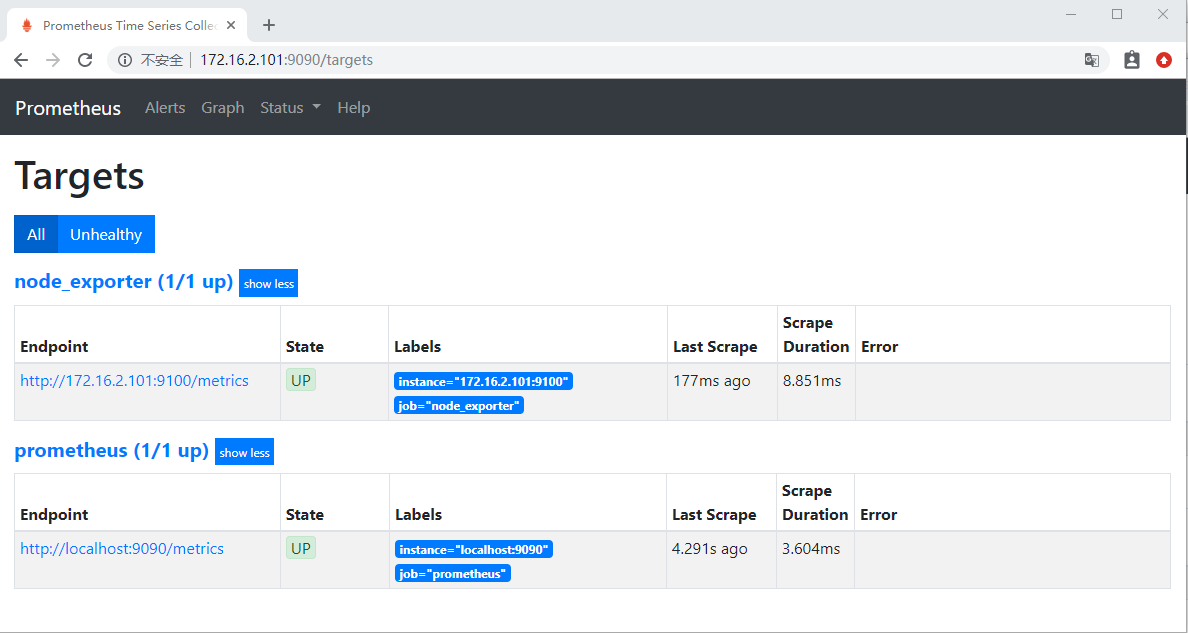
访问 http://172.16.2.101:9090/targets 发现已经出现了 target “node_exporter” ,并且为UP状态。
Grafana 导入 DashBoard
Grafana 官方和社区对已经做好了常用的 DashBoard,可以访问 https://grafana.com/grafana/dashboards 进行查询:
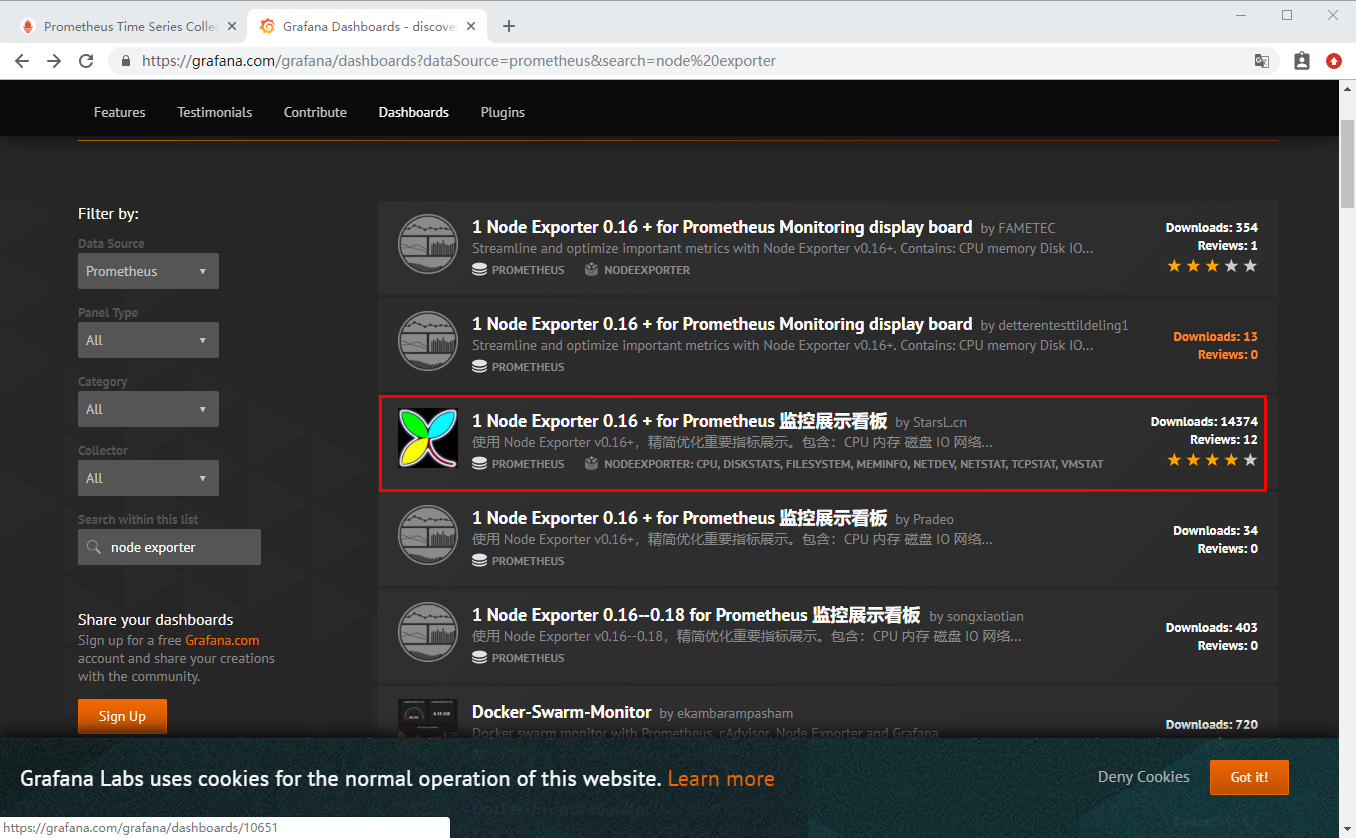
选择下载最多的,点击进去:
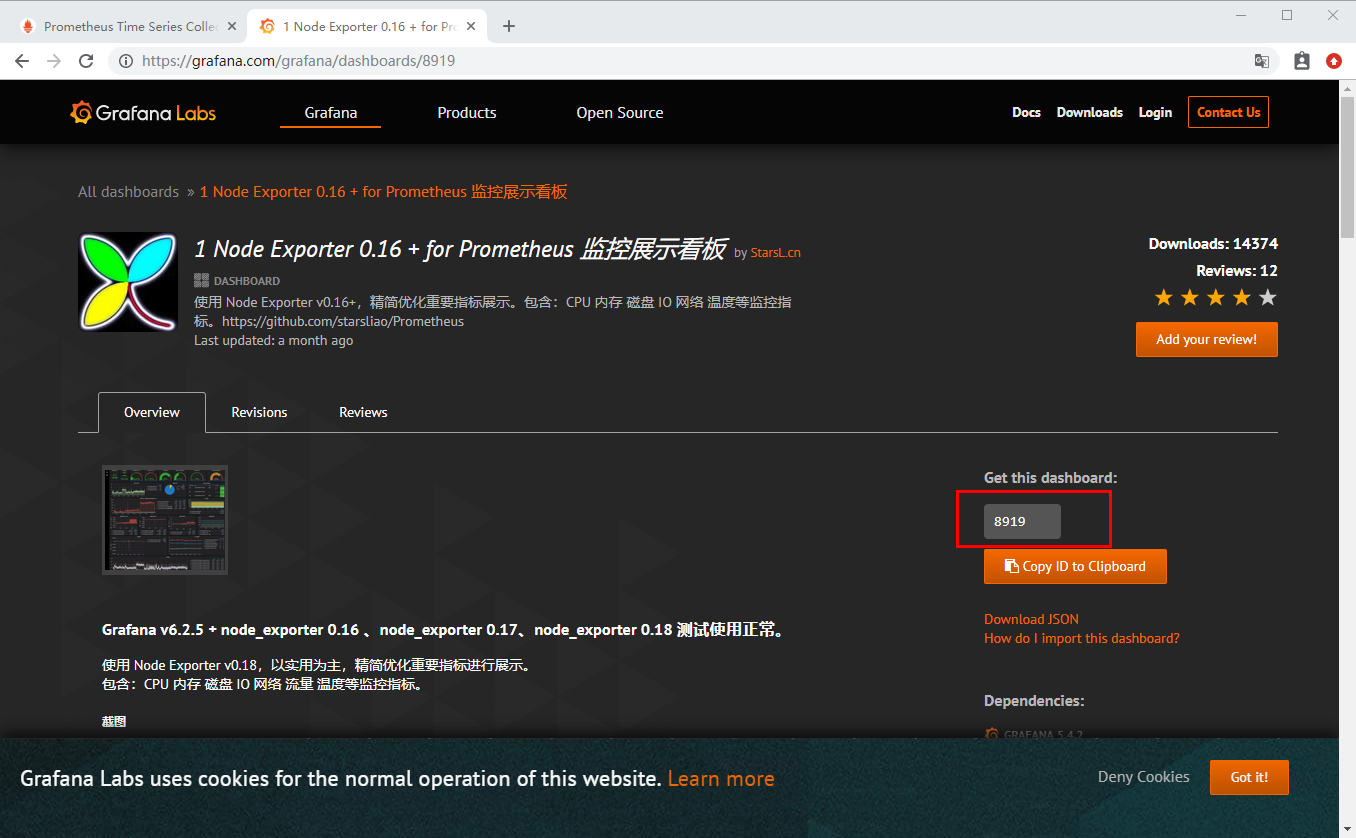
DashBoard 的 id 为 8919,后面要用到。
启动 Grafana
docker start grafana
通过Grafana的 + 图标导入(Import) Node Exporter dashboard:
- grafana id = 8919
- 注意选中prometheus数据源

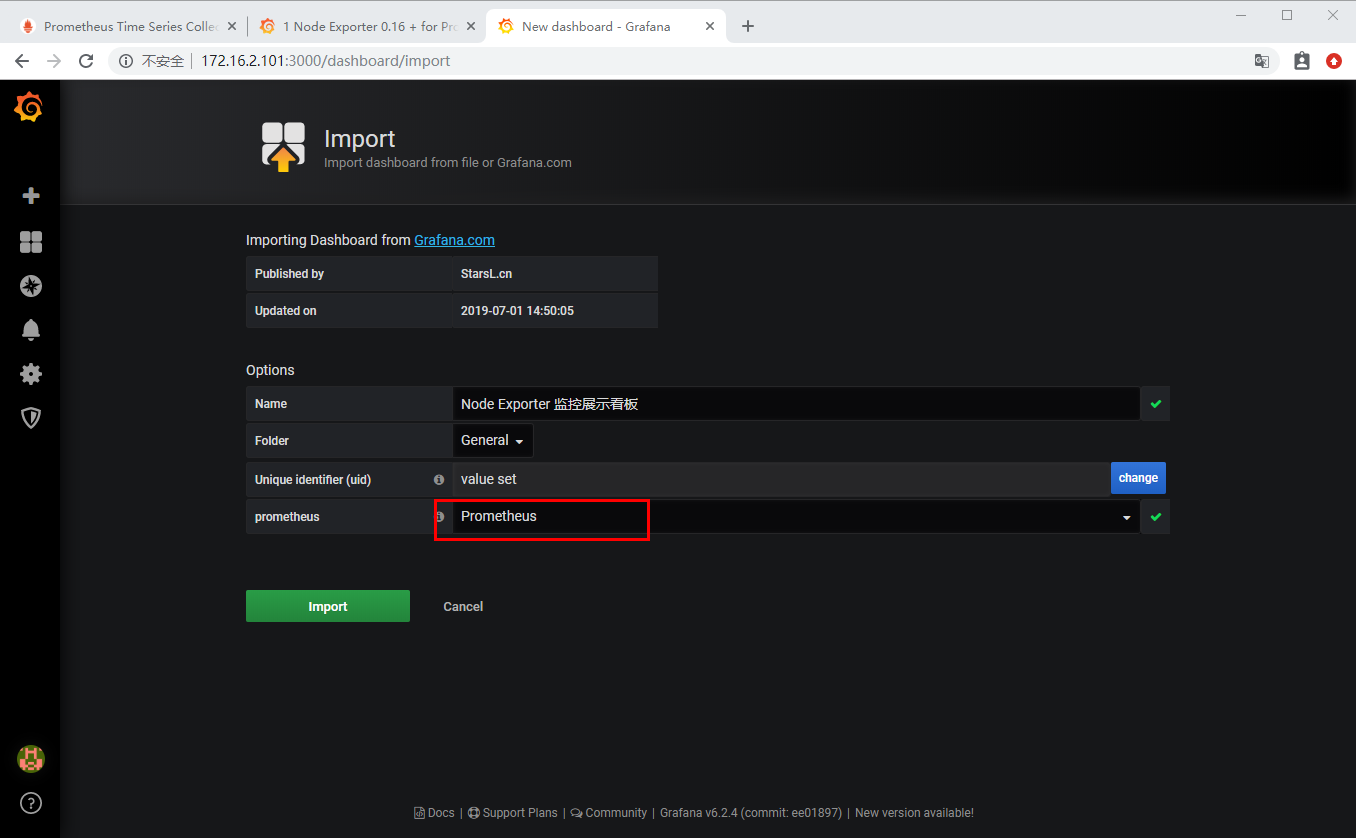
点击 "Import" 会跳转到 监控界面:
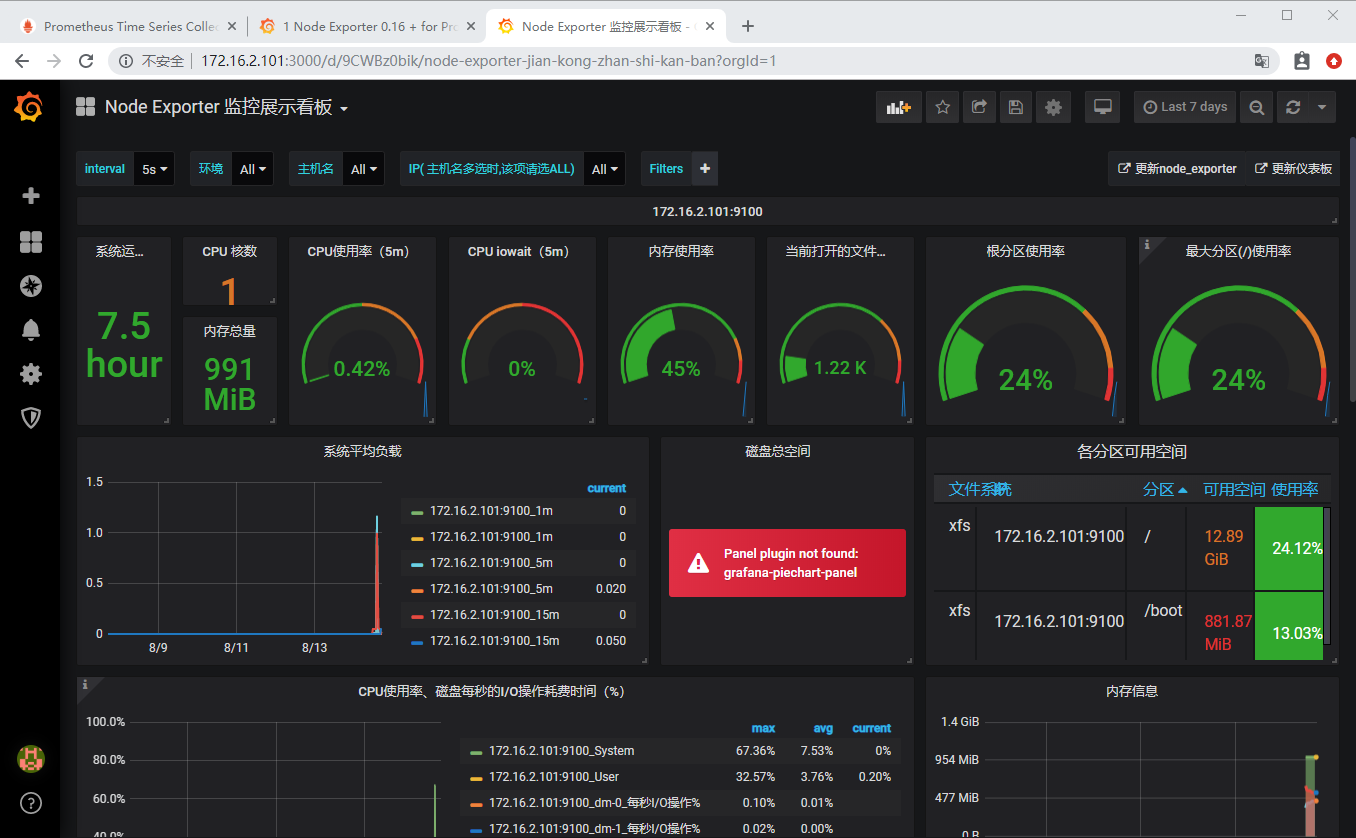
通过界面可以直观的看到 主机cpu占用率 、负载、磁盘空间、内存等信息。
总结
这一节 ,通过集成 Node Exporter 来演示了 exporter 的使用。之后你可以利用Prometheus 官方提供的其他 exporter 应用到你的学习或工作中,例如 MySQL Server Exporter 、Redis exporter 等等。
往期内容
欢迎扫码或微信搜索公众号《程序员果果》关注我,关注有惊喜~

Prometheus 集成 Node Exporter的更多相关文章
- Prometheus exporter的Node exporter是可以独立安装,用来测试的
现在慢慢在把prometheus operator的一些概念组织完整. https://github.com/coreos/prometheus-operator/tree/master/contri ...
- 【开源监控】Prometheus+Node Exporter+Grafana监控linux服务器
Prometheus Prometheus介绍 Prometheus新一代开源监控解决方案.github地址 Prometheus主要功能 多维 数据模型(时序由 metric 名字和 k/v 的 l ...
- Prometheus + Node Exporter + Grafana 监控主机运行信息
上一篇文章中讲了如何利用Prometheus和Grafana监控SpringBoot应用的JVM信息,这次就来看看如何监控 服务器运行状态,先列出用到的工具: Prometheus node_ex ...
- Prometheus 使用之 node exporter
本文使用的 Prometheus 版本为 2.22.0,node exporter 版本为 1.0.1:部署在 Linux 服务器Prometheus 是开源的监控报警系统和时序列数据库 (TSDB) ...
- Prometheus Node_exporter 之 Node Exporter
Node Exporter 1. Node Exporter Scrape Time type: GraphUnit: secondsLabel: Seconds{{collector}} - 各个收 ...
- Prometheus 安装Grafana与Prometheus集成
Prometheus 安装Grafana与Prometheus集成 Grafana是一个开源的度量分析和可视化系统. 下载地址:https://grafana.com/grafana/download ...
- Node Exporter监控指标
访问http://localhost:9100/metrics,可以看到当前node exporter获取到的当前主机的所有监控数据,如下所示: 每一个监控指标之前都会有一段类似于如下形式的信息: # ...
- node exporter
在prometheus中负责数据汇报的程序统一叫做exporter; 负责主机信息收集的node_exporter 可以利用prometheus的static_configs来拉取node_expor ...
- zeebe 集成elasticsearch exporter
zeebe 目前还在一直的开发中,同时一些变动还是挺大的,比如simple monitor 的以前是不需要配置HazelcastExporter的 估计是为了进行集群功能处理,新添加的,以前写的配置基 ...
随机推荐
- JAVA超级简单的爬虫例子(1)
爬取整个页面的数据,并进行有效的提取信息,注释都有就不废话了: public class Reptile { public static void main(String[] args) { Stri ...
- pdfminer获取整页文本
#! python2 # coding: utf-8 import sys from cStringIO import StringIO from pdfminer import pdfinterp ...
- 移动端APP热更新方案(iOS+Android)
出自:http://www.cnblogs.com/Creator/p/7007694.html 为什么要做热更新 当一个App发布之后,突然发现了一个严重bug需要进行紧急修复,这时候公司各方就会忙 ...
- 关于爬虫平台的架构实现和框架的选型(二)--scrapy的内部实现以及实时爬虫的实现
我们接着关于爬虫平台的架构实现和框架的选型(一)继续来讲爬虫框架的架构实现和狂阶的选型. 前面介绍了scrapy的基本操作,下面介绍下scrapy爬虫的内部实现架构如下图 1.Spiders(爬虫): ...
- Greenplum主备节点切换
1. 场景描述 Greenplum主节点出现故障,需要将standby节点手动切换为master节点,当master节点修复完成后,再将新修复的master节点设置为standyb节点加入到集群中. ...
- Noip 2016 愤怒的小鸟 题解
[NOIP2016]愤怒的小鸟 时间限制:1 s 内存限制:256 MB [题目描述] Kiana最近沉迷于一款神奇的游戏无法自拔. 简单来说,这款游戏是在一个平面上进行的. 有一架弹弓位于(0, ...
- UVA10071 Back to High School Physics:题解
题目链接:https://www.luogu.org/problemnew/show/UVA10071 题意简叙: 粒子从0速度提速到t时速度为v,求出2*t时所运动的距离 分析: 这道题是一道物理题 ...
- 个人永久性免费-Excel催化剂功能第48波-拆分工作薄内工作表,堪称Excel界的单反
一个工作薄有多个相同类型的工作表,然后想通过批量操作,把每个工作表都另存为一个工作薄文件,这个批量拆分工作薄,绝大多数插件都有此功能,就如懂点VBA的高级用户也常常有点不屑于用插件来完成,自己写向行V ...
- 数据库---T-SQL语句:查询语句(二)
>查询: 一.查询所有数据: select * from Info ---查询所有数据(行) select Name from Info ---查询特定列(Name列) select N ...
- jquery 操作HTML data全局属性缓存的坑
data-* 全局属性 是一类被称为自定义数据属性的属性,它赋予我们在所有 HTML 元素上嵌入自定义数据属性的能力,并可以通过脚本(一般指JavaScript) 与 HTML 之间进行专有数据的交换 ...