Prometheus入门到放弃(2)之Node_export安装部署
1、下载安装
node_exporter服务需要在三台机器都安装,这里我们以一台机器为例:
地址:https://prometheus.io/download/
### 另外两个节点部署时,需要先创建脚本中运行用户prometheus
[root@prometheus-server ~]# wget https://github.com/prometheus/node_exporter/releases/download/v0.18.1/node_exporter-0.18.1.linux-amd64.tar.gz
[root@prometheus-server ~]# tar -xf node_exporter-0.18.1.linux-amd64.tar.gz
[root@prometheus-server ~]# cp node_exporter-0.18.1.linux-amd64/node_exporter /usr/local/bin/
## 编辑启动脚本
[root@prometheus-server ~]# vim /usr/lib/systemd/system/node_exporter.service
[Unit]
Description=node_export
Documentation=https://github.com/prometheus/node_exporter
After=network.target

[Service]
Type=simple
User=prometheus
ExecStart=/usr/local/bin/node_exporter
Restart=on-failure
[Install]
WantedBy=multi-user.target

## 启动
[root@prometheus-server ~]# systemctl enable node_exporter
Created symlink from /etc/systemd/system/multi-user.target.wants/node_exporter.service to /usr/lib/systemd/system/node_exporter.service.
[root@prometheus-server ~]# systemctl start node_exporter
## 监题9100端口
[root@prometheus-server ~]# netstat -anlptu|grep 9100
tcp6       0      0 :::9100                 :::*                    LISTEN      5216/node_exporter
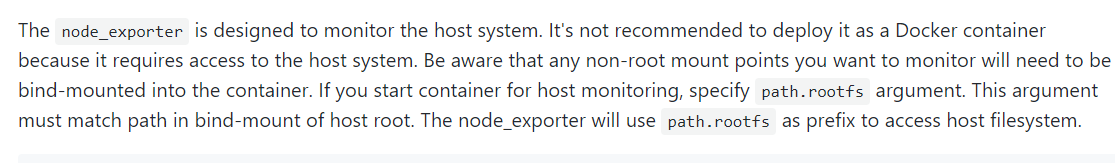
Node_exporter安装非常简单,下载解压启动就可以,node_exporter只是收集操作系统的一些指标,如果想要进行其它服务的监控收集,需要额外安装对应的exporter服务。这里之所以没有采用docker方式部署,原因如下:
官方说明:https://github.com/prometheus/node_exporter
2、配置prometheus监控目标
Node_export 相当于一个客户端一样,运行在各个节点进行机器数据的收集。
[root@prometheus-server ~]# vim /etc/prometheus/prometheus.yml
# The job name is added as a label `job=<job_name>` to any timeseries scraped from this config.
- job_name: 'prometheus'
# scheme defaults to 'http'.
- targets: ['localhost:9090']
- job_name: 'node' ### 新增加job
static_configs:
- targets: ['10.10.0.11:9100','10.10.0.12:9100','10.10.0.13:9100'] ### 主机列表
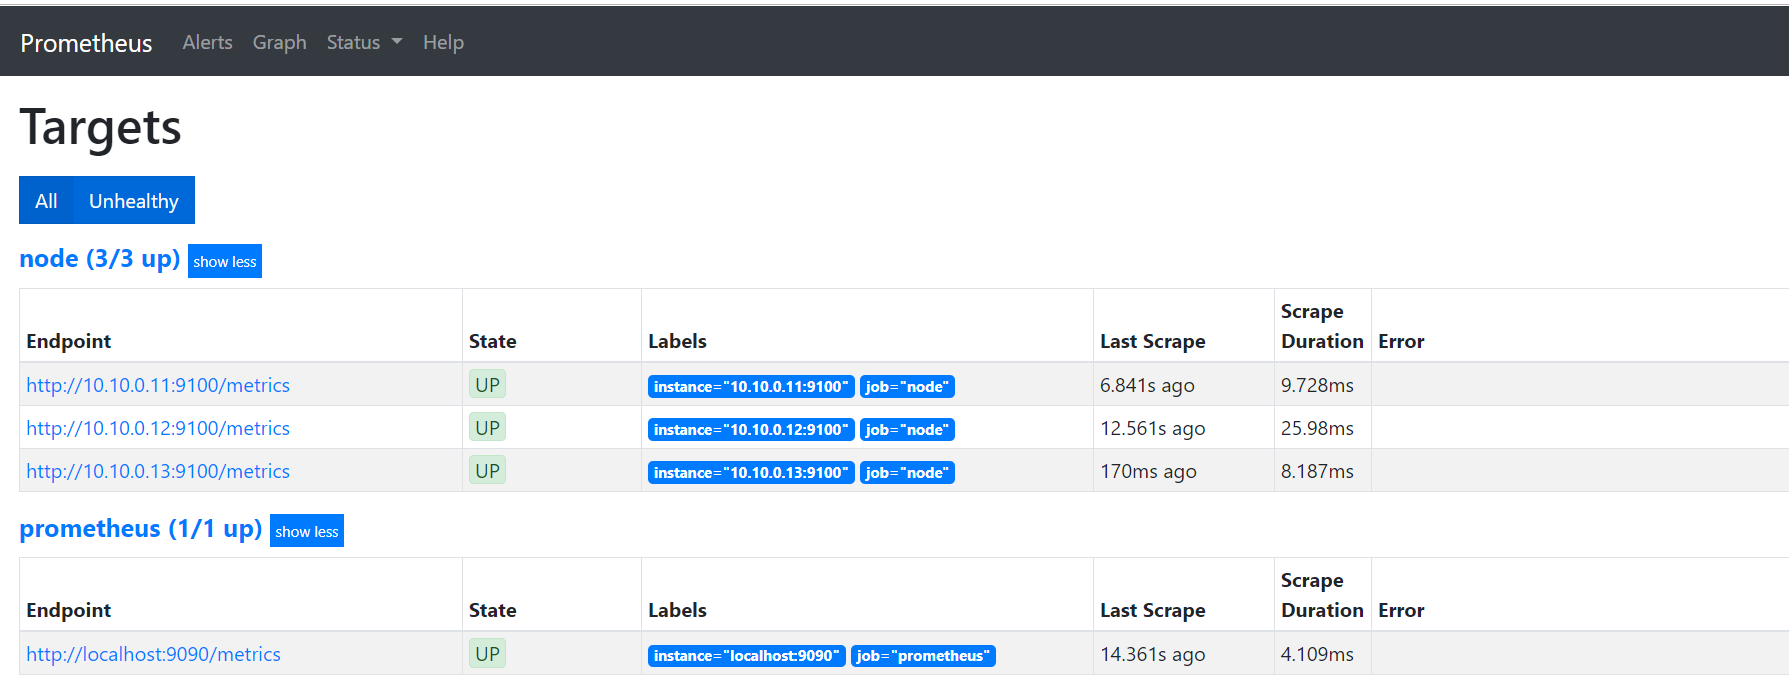
3、访问prometheus
Status >> targets,可以看到新增加的节点已经成功连接prometheus服务
4、收集系统CPU监控信息
4.1 CPU使用率
公式:100 - (avg by (instance) (irate(node_cpu_seconds_total{mode="idle"}[5m])) * 100)
4.2 CPU负载
公式:
node_load1 ## 1分钟负载
node_load5 ##5分钟负载
node_load15 ##15分钟负载
5、收集系统内存监控信息
5.1 内存使用率
公式:(1 - (node_memory_MemAvailable_bytes / node_memory_MemTotal_bytes ))* 100
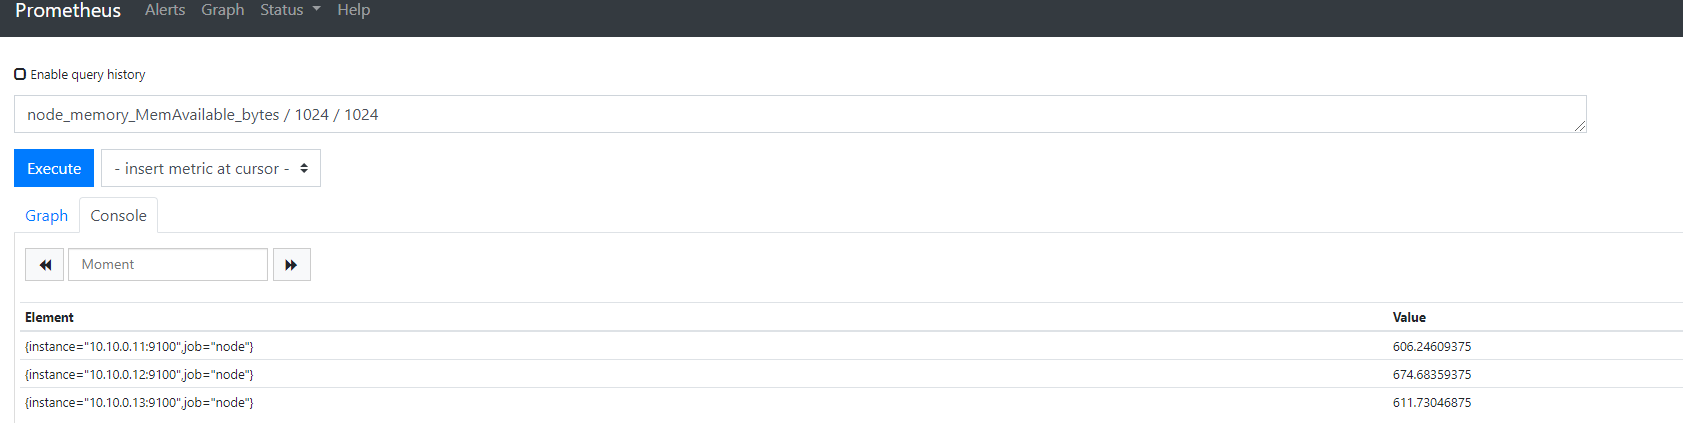
5.2 可用内存(单位:M)
公式:node_memory_MemAvailable_bytes / 1024 / 1024
6、收集系统磁盘监控信息
6.1 磁盘总大小(单位: G)
公式:node_filesystem_size_bytes {fstype=~"ext4|xfs"} / 1024 / 1024 / 1024
6.2 磁盘剩余大小(单位: G)
公式:node_filesystem_avail_bytes {fstype=~"ext4|xfs"} / 1024 / 1024 / 1024
6.3 磁盘使用率
公式:(1-(node_filesystem_free_bytes{fstype=~"ext4|xfs"} / node_filesystem_size_bytes{fstype=~"ext4|xfs"})) * 100
7、收集系统网络监控信息
7.1 网卡入网流量 (指定某一个网卡)
公式:irate(node_network_receive_bytes_total{device='ens32'}[5m])
7.2 网卡出网流量(指定某一个网卡)
公式:irate(node_network_transmit_bytes_total{device='ens32'}[5m])
说明:以上收集系统各信息,都是通过node_exporter服务进行数据的收集,然后通过prometheus内置的PromQL语句进行组合查询,对于每一个公式,都可以在prometheus WEB界面测试查询。
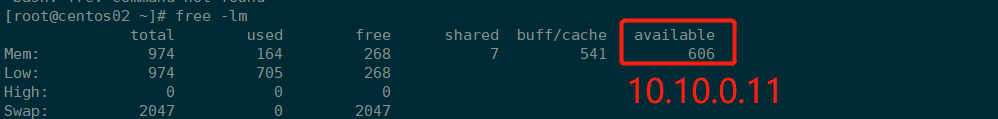
比如,查看系统可用内存,第一张图是通过prometheus界面promsql语句查询,第二幅图是在机器上通过free -lm命令查出:
注意:新版本node_exporter中一些PromQL查询指标值与旧版本不一致,使用时注意区分。
关于具体的PromQL语句以及公式中函数的使用参考:https://prometheus.io/docs/prometheus/latest/querying/functions/
Prometheus入门到放弃(2)之Node_export安装部署的更多相关文章
- 《区块链:从入门到放弃》之obc安装步骤
obc安装步骤 朋友们可能会好奇,厨师不研究菜谱怎么改研究兵法了,哈哈,我原本是app出身,最近被安排去预研区块链和比特币技术,2个月下来,颇有斩获.期间得到IBM的CC同学指导我一步一步安装obc的 ...
- Kubernetes入门(一)——Kubernetes v1.18.5 安装部署
Kubernetes的安装有两种方式:一是使用各个厂商封装的Kubernetes发行版,优点是可以一键安装部署,操作简单,缺点也很明显,若安装过程中某一步骤出现问题,很难定位处理:二是使用官方提供的k ...
- Hadoop入门进阶课程13--Chukwa介绍与安装部署
本文版权归作者和博客园共有,欢迎转载,但未经作者同意必须保留此段声明,且在文章页面明显位置给出原文连接,博主为石山园,博客地址为 http://www.cnblogs.com/shishanyuan ...
- Apache入门篇(一)之安装部署apache
一.HTTPD特性 (1)高度模块化:core(核心) + modules(模块) = apache(2)动态模块加载DSO机制: Dynamic Shared Object(动态共享对象)(3)MP ...
- Prometheus入门到放弃(1)之Prometheus安装部署
规划: IP 角色 版本 10.10.0.13 prometheus-server 2.10 10.10.0.11 node_exporter 0.18.1 10.10.0.12 node_expor ...
- Docker 从入门到放弃(一)安装
前言 Docker 是一个开源的应用容器引擎,让开发者可以打包他们的应用以及依赖包到一个可移植的容器中,然后发布到任何流行的Linux机器上,也可以实现虚拟化,容器是完全使用沙箱机制,相互之间不会有任 ...
- Prometheus入门到放弃(7)之redis_exporter部署
redis监控,prometheus需要使用redis_exporter客户端. 这里我们采用docker方式部署,既可以部署在redis所在服务器,也可以部署在其他机器: docker镜像地址:ht ...
- Prometheus入门到放弃(6)之AlertManager进阶
前面几个篇幅,我们介绍了alertmanger报警配置,在实际运维过程中,我们都会遇到,报警的重复发送,以及报警信息关联性报警.接下来我们就介绍下通过alertmanger对告警信息的收敛.一.告警分 ...
- Prometheus入门到放弃(5)之AlertManager部署
alertmanager与exporters.cadvisor一样,都是独立于prometheus项目,这里我们也使用docker方式部署alertmanager. 1.下载镜像 镜像地址:https ...
随机推荐
- OpenFOAM在原有算例上新建算例(只拷贝0,system,constant)
原视频下载地址: https://yunpan.cn/cMpyBHSEvC7T4 (提取码:dca4)
- 关于密码重用参数PASSWORD_REUSE_TIME,PASSWORD_REUSE_MAX之间的关系及其演示
转自: https://blog.51cto.com/carefree/1382811 测试环境:10.2.0.2.0测试用户:SCOTT测试用的三组密码:oracle1 oracle2 oracle ...
- 记一次有惊无险的 JVM 优化经历
转载:https://my.oschina.net/u/3627055/blog/2995973 背景 生产环境有二台阿里云服务器,均为同一时期购买的,CPU.内存.硬盘等配置相同.具体配置如下: 节 ...
- CentOS下载与服务器版安装(VMware)
1. 下载 首先需要选择一个版本,因为华为云最新只提供了CentOS 7.6,所以要选择CentOS 7版本的. 官网只提供了最新的版本,而且服务器在国外,下载速度贼慢. 不过官方提供了分布在各个地区 ...
- Jenkins入门【转】
一.Jenkins概述 二.安装Jenkins https://pkg.jenkins.io/redhat-stable/ sudo wget -O /etc/yum.repos.d/jenkins. ...
- 新概念英语第二册Lesson5:No wrong numbers
Lesson 5 No wrong numbers 无错号之虞 First listen and then answer the question. 听录音,然后回答以下问题. What does ' ...
- fastjson字段顺序问题
构造函数中指定使用有序 public JSONObject(boolean ordered) { this(16, ordered);} 示例: JSONObject fastJson = new J ...
- 【转载】 tf.train.slice_input_producer()和tf.train.batch()
原文地址: https://www.jianshu.com/p/8ba9cfc738c2 ------------------------------------------------------- ...
- 如何发布H5界面可以让公网访问
本文链接:https://blog.csdn.net/u013310119/article/details/81233560问题背景:手机APP里的H5界面要发布到公网,提供给第三方APP调用. 解决 ...
- VMWare-Linux NAT模式联网配置
VMWare-Linux NAT模式联网配置 摘自:https://blog.csdn.net/a56112777/article/details/83053566 (注意使用root用户) 1. ...