LaTeX插入图片方法 Inserting Images
Inserting Images
Images are essential elements in most of the scientific documents. LATEX provides several options to handle images and make them look exactly what you need. In this article is explained how to include images in the most common formats, how to shrink, enlarge and rotate them, and how to reference them within your document.
Contents |
Introduction
Below is a example on how to import a picture.
\documentclass{article}

\usepackage{graphicx}

\graphicspath{ {images/} }


\begin{document}

The universe is immense and it seems to be homogeneous,

in a large scale, everywhere we look at.


\includegraphics{universe}


There's a picture of a galaxy above

\end{document}
Latex can not manage images by itself, so we need to use the graphicx package. To use it, we include the following line in the preamble: \usepackage{graphicx}
The command \graphicspath{ {images/} } tells LATEX that the images are kept in a folder named imagesunder the current directory.
The \includegraphics{universe} command is the one that actually included the image in the document. Here universe is the name of the file containing the image without the extension, then universe.PNGbecomes universe. The file name of the image should not contain white spaces nor multiple dots.
Note: The file extension is allowed to be included, but it's a good idea to omit it. If the file extension is omitted it will prompt LaTeX to search for all the supported formats. For more details see the section about generating high resolution and low resolution images.
The folder path to images
When working on a document which includes several images it's possible to keep those images in one or more separated folders so that your project is more organised.
In the example at the introduction the command \graphicspath{ {images/} } tells LATEX to look in theimages folder. The path is relative to the current working directory.
The path to the folder can be relative (recommended) if it is in the same location as the main .tex file or in one of the sub-folders, or absolute if you have to specify the exact path. For example:
%Path in Windows format:

\graphicspath{ {c:/user/images/} }


%Path in Unix-like (Linux, OsX) format

\graphicspath{ {/home/user/images/} }
Notice that this command requires a trailing slash / and that the path is in between double braces.
You can also set multiple paths if the images are saved in more than one folder. For instance, if there are two folders named images1 and images2, use the command.
\graphicspath{ {images1/}{images2/} }</code>
If no path is set LATEX will look for pictures in the folder where the .tex file is saved.
Changing the image size and rotating the picture
If we want to further specify how LATEX should include our image in the document (length, height, etc), we can pass those settings in the following format:
ShareLaTeX is a great professional tool to edit online,

share and backup your \LaTeX projects. Also offers a

rather large help documentation.


\includegraphics[scale=1.5]{lion-logo}
The command \includegraphics[scale=1.5]{lion-logo} will include the image lion-logo in the document, the extra parameter scale=1.5 will do exactly that, scale the image 1.5 of its real size.
You can also scale the image to a some specific width and height.
ShareLaTeX is a great professional tool to edit online,

share and backup your \LaTeX projects. Also offers a

rather large help documentation.


\includegraphics[width=3cm, height=4cm]{lion-logo}

As you probably have guessed, the parameters inside the brackets [width=3cm, height=4cm] define the width and the height of the picture. You can use different units for these parameters. If only the widthparameter is passed, the height will be scaled to keep the aspect ratio.
The length units can also be relative to some elements in document. If you want, for instance, make a picture the same width as the text:
ShareLaTeX is a great professional tool to edit online,

share and backup your \LaTeX projects. Also offers a

rather large help documentation.


\includegraphics[width=\textwidth]{universe}
Instead of \textwidth you can use any other default LATEX lenght: \columnsep, \linewidht, \textheight, \paperheight, etc. See the reference guide for a further description of these units.
There is another common option when including a picture within your document, to rotate it. This can easily accomplished in LATEX:
ShareLaTeX is a great professional tool to edit online,

share and backup your \LaTeX projects. Also offers a

rather large help documentation.


\includegraphics[scale=1.2, angle=45]{lion-logo}
The parameter angle=45 rotates the picture 45 degrees counter-clockwise. To rotate the picture clockwise use a negative number.
Positioning
In the previous section was explained how to include images in your document, but the combination of text and images may not look as we expected. To change this we need to introduce a new environment.
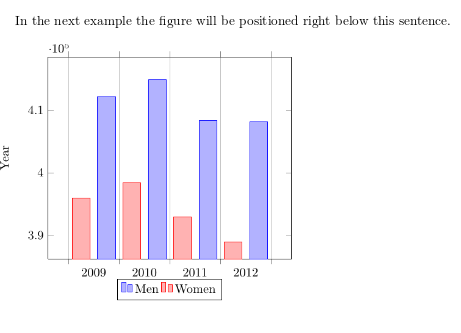
In the next example the figure will be positioned

right below this sentence.


\begin{figure}[h]

\includegraphics[width=8cm]{Plot}

\end{figure}
The figure environment is used to display pictures as floating elements within the document. This means you include the picture inside the figure environment and you don't have to worry about it's placement,LATEX will position it in a such way that it fits the flow of the document.
Anyway, sometimes we need to have more control on the way the figures are displayed. An additional parameter can be passed to determine the figure positioning. In the example, begin{figure}[h], the parameter inside the brackets set the position of the figure to here. Below a table to list the possible positioning values.
| Parameter | Position |
|---|---|
| h | Place the float here, i.e., approximately at the same point it occurs in the source text (however, not exactly at the spot) |
| t | Position at the top of the page. |
| b | Position at the bottom of the page. |
| p | Put on a special page for floats only. |
| ! | Override internal parameters LaTeX uses for determining "good" float positions. |
| H | Places the float at precisely the location in the LATEX code. Requires the float package. This is somewhat equivalent to h!. |
In the next example you can see a picture at the top of the document, despite being declared below the text.
In this picture you can see a bar graph that shows

the results of a survey which involved some important

data studied as time passed.


\begin{figure}[t]

\includegraphics[width=8cm]{Plot}

\centering

\end{figure}
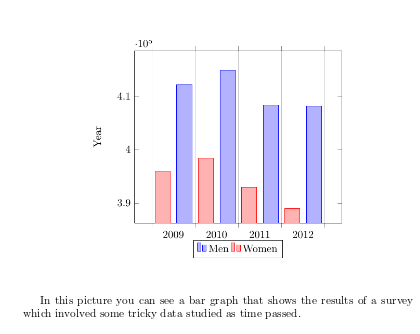
The additional command \centering will centre the picture. The default alignment is left.
It's also possible to wrap the text around a figure. When the document contains small pictures this makes it look better.
\begin{wrapfigure}{r}{0.25\textwidth} %this figure will be at the right
\centering
\includegraphics[width=0.25\textwidth]{mesh}
\end{wrapfigure}
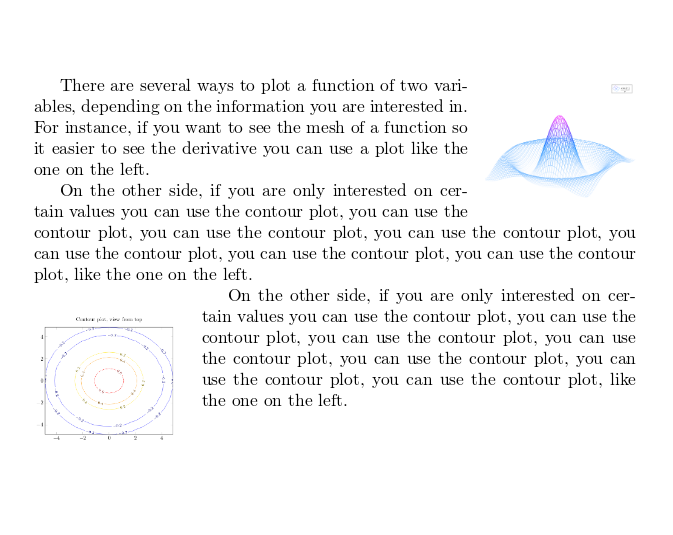
There are several ways to plot a function of two variables,
depending on the information you are interested in. For
instance, if you want to see the mesh of a function so it
easier to see the derivative you can use a plot like the
one on the left.
\begin{wrapfigure}{l}{0.25\textwidth}
\centering
\includegraphics[width=0.25\textwidth]{contour}
\end{wrapfigure}
On the other side, if you are only interested on
certain values you can use the contour plot, you
can use the contour plot, you can use the contour
plot, you can use the contour plot, you can use
the contour plot, you can use the contour plot,
you can use the contour plot, like the one on the left.
On the other side, if you are only interested on
certain values you can use the contour plot, you
can use the contour plot, you can use the contour
plot, you can use the contour plot, you can use the
contour plot, you can use the contour plot,
you can use the contour plot,
like the one on the left.
For the commands in the example to work, you have to import the package wrapfig. Add to the preamble the line \usepackage{wrapfig}.
Now you can define the wrapfigure environment by means of the commands \begin{wrapfigure}{l}{0.25\textwidth} \end{wrapfigure}. Notice that the environment has two additional parameters enclosed in braces. Below the code is explained with more detail:
{l}- This defines the alignment of the figure. Set l for left and r for right. Furthermore, if you are using a book or any similar format, use instead o for the outer edge and i for the inner edge of the page.
{0.25\textwidth}- This is the width of figure box. It's not the width of the image itself, that must be set in the includegraphicscommand. Notice that the length is relative to the text width, but normal units can also be used (cm, in, mm, etc). See the reference guide for a list of units.
\centering- This was already explained, but in this example the image will be centred by using its container as reference, instead of the whole text.
For a more complete article about image positioning see Positioning images and tables
Captioning, labelling and referencing
Captioning images to add a brief description and labelling them for further reference are two important tools when working on a lengthy text.
Captions
Let's start with a caption example:
\begin{figure}[h]

\caption{Example of a parametric plot ($\sin (x), \cos(x), x$)}

\centering

\includegraphics[width=0.5\textwidth]{spiral}

\end{figure}
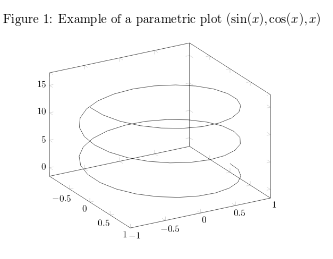
It's really easy, just add the \caption{Some caption} and inside the braces write the text to be shown. The placement of the caption depends on where you place the command; if it'a above the includegraphics then the caption will be on top of it, if it's below then the caption will also be set below the figure.
Captions can also be placed right after the figures. The sidecap package uses similar code to the one in the previous example to accomplish this.
\documentclass{article}
\usepackage[rightcaption]{sidecap}
\usepackage{graphicx} %package to manage images
\graphicspath{ {images/} }
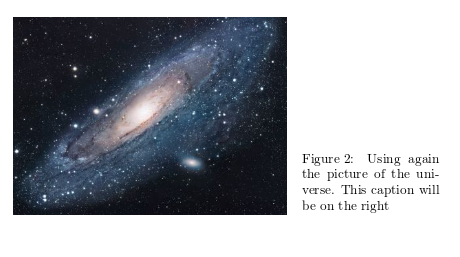
\begin{SCfigure}[0.5][h]
\caption{Example of a parametric plot.
This caption will be on the right}
\includegraphics[width=0.6\textwidth]{spiral}
\end{SCfigure}
There are two new commands
\usepackage[rightcaption]{sidecap}- As you may expect this line will import a package named sidecap, but there is an additional parameter:
rightcaption. This parameter establishes the placement of the caption at the right of the picture, you can also use leftcaption. In book-like documents outercaption and innercaption are also available. The names of these are self-descriptive.
\begin{SCfigure}[0.5][h] \end{SCfigure}- Defines an environment similar to figure. The first parameter is the width of the caption relative to the size of the image, as declared in includegraphics. The second parameter
hworks exactly as in the figureenvironment. See the placement section for more information.
You can do a more advanced management of the caption formatting. Check the further reading section for references.
Labels and cross-references
Figures, just as many other elements in a LATEX document (equations, tables, plots, etc) can be referenced within the text. This is very easy, just add a label to the figure or SCfigure environment, then later use that label to refer the picture.
\begin{figure}[h]
\centering
\includegraphics[width=0.25\textwidth]{mesh}
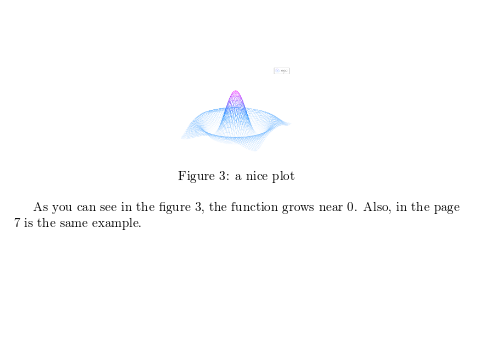
\caption{a nice plot}
\label{fig:mesh1}
\end{figure}
As you can see in the figure \ref{fig:mesh1}, the
function grows near 0. Also, in the page \pageref{fig:mesh1}
is the same example.
There are three commands that generate cross-references in this example.
\label{fig:mesh1}- This will set a label for this figure. Since labels can be used in several types of elements within the document, it's a good practice to use a prefix, such as fig: in the example.
\ref{fig:mesh1}- This command will insert the number assigned to the figure. It's automatically generated and will be updated if insert some other figure before the referenced one.
\pageref{fig:mesh1}- This prints out the page number where the referenced image appears.
The \caption is mandatory to reference a figure.
Another great characteristic in a LATEX document is the ability to automatically generate a list of figures. This is straightforward.
\listoffigures
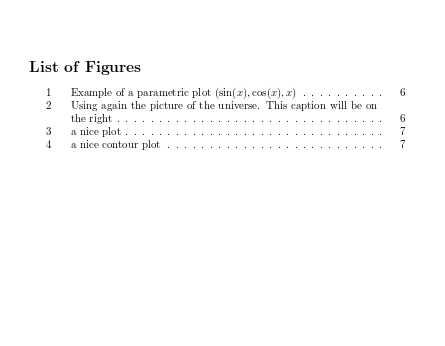
This command only works on captioned figures, since it uses the caption in the table. The example above lists the images in this article.
Important Note: When using cross-references your LATEX project must be compiled twice, otherwise the references, the page references and the table of figures won't work.
Generating high-res and low-res images
So far while specifying the image file name in the \includegraphics command we have omitted file extensions. However, that is not necessary, though it is often useful. If the file extension is omitted, LaTeX will search for any supported image format in that directory, and will search for various extensions in the default order (which can be modified).
This is useful in switching between development and production environments. In a development environment (when the article/report/book is still in progress), it is desirable to use low-resolution versions of images (typically in .png format) for fast compilation of the preview. In the production environment (when the final version of the article/report/book is produced), it is desirable to include the high-resolution version of the images.
This is accomplished by
- Not specifying the file extension in the \includegraphics command, and
- Specifying the desired extension in the preamble.
Thus, if we have two versions of an image, venndiagram.pdf (high-resolution) and venndiagram.png (low-resolution), then we can include the following line in the preamble to use the .png version while developing the report -
\DeclareGraphicsExtensions{.png,.pdf}
The command above will ensure that if two files are encountered with the same base name but different extensions (for example venndiagram.pdf and venndiagram.png), then the .png version will be used first, and in its absence the .pdf version will be used, this is also a good ideas if some low-resolution versions are not available.
Once the report has been developed, to use the high-resolution .pdf version, we can change the line in the preamble specifying the extension search order to
\DeclareGraphicsExtensions{.pdf,.png}
Improving on the technique described in the previous paragraphs, we can also instruct LATEX to generate low-resolution .png versions of images on the fly while compiling the document if there is a PDF that has not been converted to PNG yet. To achieve that, we can include the following in the preamble after\usepackage{graphicx}
  \usepackage{epstopdf}

  \epstopdfDeclareGraphicsRule{.pdf}{png}{.png}{convert #1 \OutputFile}

  \DeclareGraphicsExtensions{.png,.pdf}
If venndiagram2.pdf exists but not venndiagram2.png, the file venndiagram2-pdf-converted-to.png will be created and loaded in its place. The command convert #1 is responsible for the conversion and additional parameters may be passed between convert and #1. For example - convert -density 100 #1.
There are some important things to have in mind though:
- For the automatic conversion to work, we need to call pdflatex with the
--shell-escapeoption. - For the final production version, we must comment out the
\epstopdfDeclareGraphicsRule, so that only high-resolution PDF files are loaded. We'll also need to change the order of precedence.
Reference guide
LATEX units and legths
| Abbreviation | Definition |
|---|---|
| pt | A point, is the default length unit. About 0.3515mm |
| mm | a millimetre |
| cm | a centimetre |
| in | an inch |
| ex | the height of an x in the current font |
| em | the width of an m in the current font |
| \columnsep | distance between columns |
| \columnwidth | width of the column |
| \linewidth | width of the line in the current environment |
| \paperwidth | width of the page |
| \paperheight | height of the page |
| \textwidth | width of the text |
| \textheight | height of the text |
| \unitleght | units of length in the picture environment. |
About image types in LATEX
- latex
- When compiling with latex, we can only use EPS images, which is a vector format.
- pdflatex
- If we are compiling using "pdflatex" to produce a PDF, then we can use a number of image formats -
   JPG: Best choice if we want to insert photos

   PNG: Best choice if we want to insert diagrams (if a vector version could not be generated) and screenshots

   PDF: Even though we are used to seeing PDF documents, a PDF can also store images

   EPS: EPS images can be included using the epstopdf package (we just need to install the package, we

        don't need to use \usepackage{} to include it in our document.)
- Vector format or Bit-map format?
- Images can be of either vector format of bit-map format. Generally we don't need to worry about it, but if we do happen to know the format the image is in, we can use that information to choose an appropriate image format to include in our latex document. If we have an image in vector format, we should go for PDF or EPS. If we have it in bit-map format, we should go for JPG or PNG, as storing bit-map pictures in PDF or EPS takes a lot of disk space.
Open an example of the pgfplots package in ShareLaTeX
from: https://www.sharelatex.com/learn/Inserting_Images
LaTeX插入图片方法 Inserting Images的更多相关文章
- Latex插入图片 分类: LaTex 2014-11-18 20:07 261人阅读 评论(0) 收藏
在Latex中插入图片的方式很多,我这里只介绍自己常用的一种方式,欢迎大家指导. 我习惯于使用graphicx宏包来插入图片,有时候会配合上subfigure宏包来同时插入多幅图片组合. 首先,需要在 ...
- LaTex 插入图片
\usepackage{mathrsfs} \usepackage{amsmath} \usepackage{graphicx} 宏包 \includegraphics{graph01.eps} %插 ...
- LaTeX插入图表方法 Lists of tables and figures
Lists of tables and figures A list of the tables and figures keep the information organized and prov ...
- LaTeX的图片插入及排版
LaTeX中一般只直接支持插入eps(Encapsulated PostScript)格式的图形文件, 因此在图片插入latex文档之前应先设法得到图片的eps格式的文件. UNIX下的各种应用软件都 ...
- LaTeX的图片插入及排版[转]
LaTeX中一般只直接支持插入eps(Encapsulated PostScript)格式的图形文件, 因此在图片插入latex文档之前应先设法得到图片的eps格式的文件. UNIX下的各种应用软件都 ...
- NX二次开发-OLE/COM向EXCEL表格中插入图片
今晚有一个兄弟问我怎么往EXCEL里插入图片(加工程序单中需要插入图片),这个我之前也没弄过,回复了他一句不知道,后来刚刚干完游戏吃完鸡,就去VC++的书上翻了翻,还真的被我翻到了.VC++的方法往E ...
- 在LaTeX文档中插入图片的几种常用的方法
LaTeX中一般只直接支持插入eps(Encapsulated PostScript)格式的图形文件, 因此在图片插入latex文档之前应先设法得到图片的eps格式的文件. 在LaTeX文档中插入图片 ...
- Latex 中插入图片no bounding box 解决方案
在windows下,用latex插入格式为jpg,png等图片会出现no bounding box 的编译错误,此时有两个解决办法: 1.将图片转换为eps格式的图片 \usepackage{grap ...
- LaTeX 中插入图片使其紧跟插入的文字之后
LaTeX 中插入图片使其不跑到每页的开头而紧跟插入的文字之后. 此次建模过程中,遇到的一个比较棘手的问题是: 当插入图片时,图片的位置总是会自动跑到当页(或下一页)的最上方,而不是紧跟在其对应的说明 ...
随机推荐
- URAL 1635. Mnemonics and Palindromes(DP)
题目链接 本来用区间DP,3次方的复杂度,T了,看了看题解,降维,直接二次方的复杂度可以解.然后折腾一下输出路径..终于过了. #include <cstring> #include &l ...
- Rational Rose 2007 破解版安装过程
Rational Rose 2007 破解版安装过程 首先通过网站将软件下载,然后依照以下步骤进行: 选择第二项,下一步 一直点击next,出现如下,可以修改安装的目的文件夹 设置完路径之后出现如下, ...
- 纪念逝去的岁月——C++实现一个栈(使用类模板)
这个版本是上个版本的加强版,上个版本的代码:http://www.cnblogs.com/fengbohello/p/4542912.html 目录 1.代码 2.运行结果 1.代码 1.1 调试信息 ...
- nodeJS代码实现计算交社保是否合适
本文通过nodejs的一个具体示例来对比分析现阶段我们交社保合不合适, 主要是对nodejs的一个小的应用,当然大家也可以改成其他语言的,程序猿们,来算算吧. 按一个普通程序员8000的月收入算就是1 ...
- asp.net分割字符串的几种方法
在编写程序中,经常要用到分割的方法来处理一些字符串.这里总结了几种常用的分割方法: 1.最简单最常用的方法,以一个指定的字符进行的分割 string s="abcdeabcdeabcde& ...
- java输入一个字符串,打印出该字符串中字符的所有排列,随机打乱排序
import java.util.ArrayList;import java.util.Collections;import java.util.List; public class Test7{ ...
- JAVA集合迭代遍历和特性介绍
数组.集合:都是一种容器,用一个对象管理多个对象:数组不能自动增长:只能存放同类型的元素 集合能自动扩容:部分集合允许存放不同类型的元素: 1.List: 有顺序的,允许存放重复的元素: 遍历:for ...
- css3很酷的加载动画多款
在线实例:http://www.admin10000.com/document/3601.html 源码:https://github.com/tobiasahlin/SpinKit
- HDU3874 /HDU3333 树状数组 区间求不重复数和
Necklace Time Limit: 15000/5000 MS (Java/Others) Memory Limit: 65536/32768 K (Java/Others)Total S ...
- IntelliJ 有的时候移动滚动条后会自动回到光标所在位置的解决方法
关闭有道词典的取词.划词功能.