istio收集Metrics和日志信息
1.切换到istio根目录
cd /data/istio/istio-0.7.1
2.安装prometheus
kubectl apply -f install/kubernetes/addons/prometheus.yaml
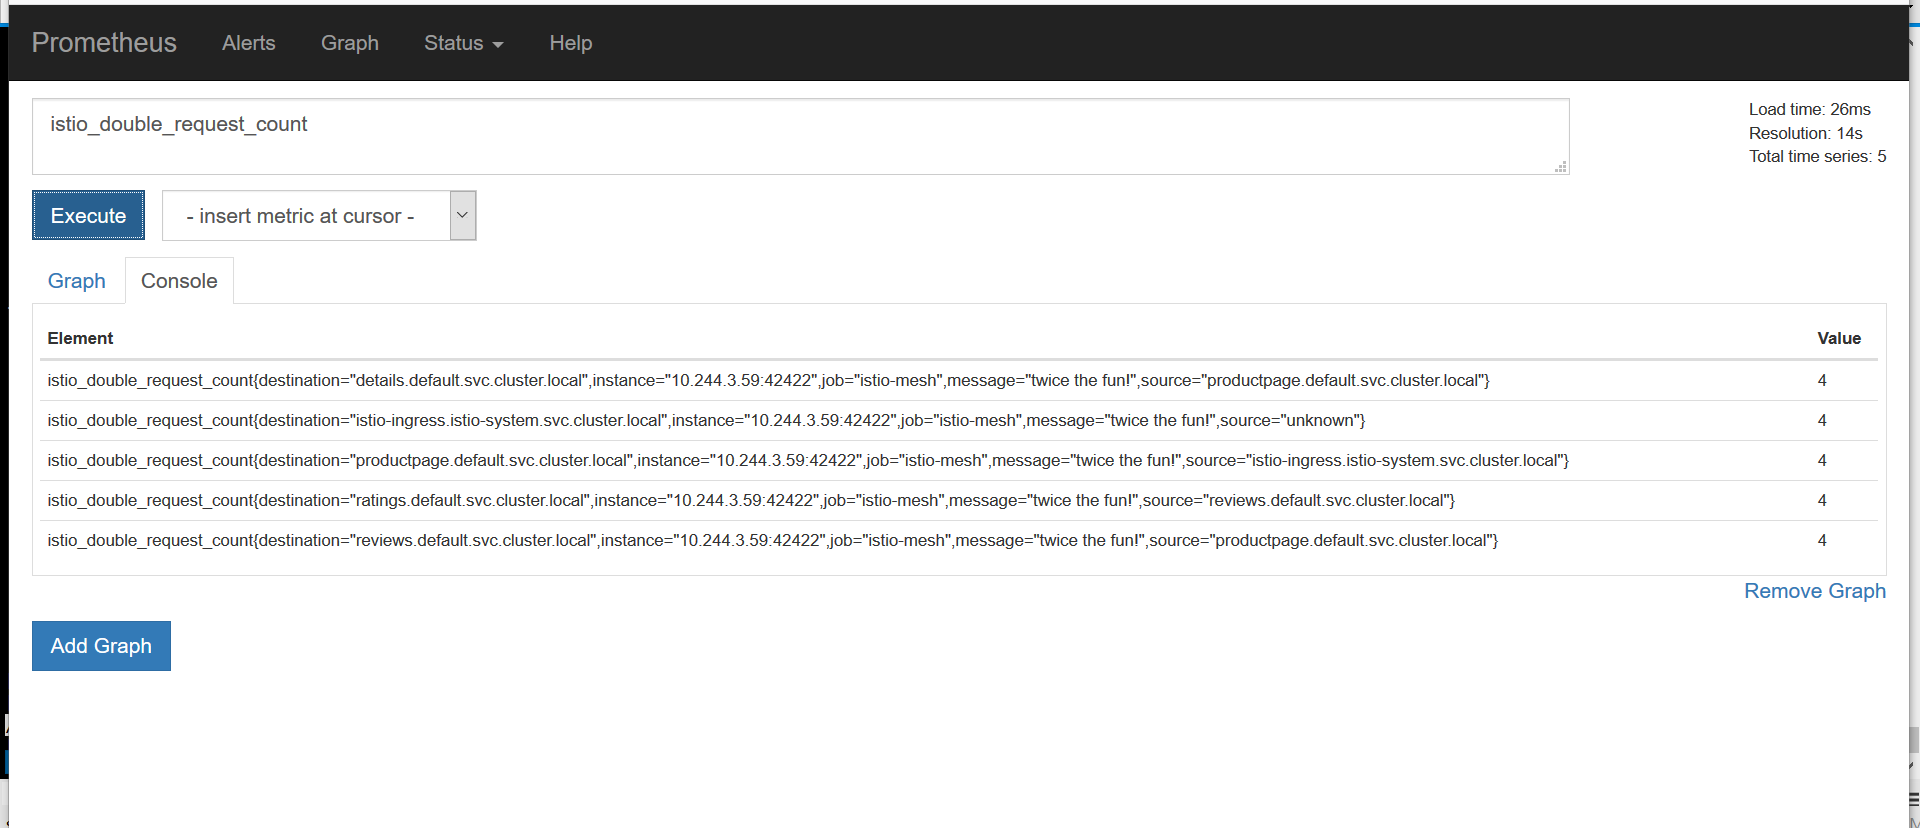
3.创建收集数据的模板
# Configuration for metric instances

apiVersion: "config.istio.io/v1alpha2"

kind: metric

metadata:

  name: doublerequestcount

  namespace: istio-system

spec:

  value: "2" # count each request twice

  dimensions:

    source: source.service | "unknown"

    destination: destination.service | "unknown"

    message: '"twice the fun!"'

  monitored_resource_type: '"UNSPECIFIED"'

---

# Configuration for a Prometheus handler

apiVersion: "config.istio.io/v1alpha2"

kind: prometheus

metadata:

  name: doublehandler

  namespace: istio-system

spec:

  metrics:

  - name: double_request_count # Prometheus metric name

    instance_name: doublerequestcount.metric.istio-system # Mixer instance name (fully-qualified)

    kind: COUNTER

    label_names:

    - source

    - destination

    - message

---

# Rule to send metric instances to a Prometheus handler

apiVersion: "config.istio.io/v1alpha2"

kind: rule

metadata:

  name: doubleprom

  namespace: istio-system

spec:

  actions:

  - handler: doublehandler.prometheus

    instances:

    - doublerequestcount.metric

---

# Configuration for logentry instances

apiVersion: "config.istio.io/v1alpha2"

kind: logentry

metadata:

  name: newlog

  namespace: istio-system

spec:

  severity: '"warning"'

  timestamp: request.time

  variables:

    source: source.labels["app"] | source.service | "unknown"

    user: source.user | "unknown"

    destination: destination.labels["app"] | destination.service | "unknown"

    responseCode: response.code | 0

    responseSize: response.size | 0

    latency: response.duration | "0ms"

  monitored_resource_type: '"UNSPECIFIED"'

---

# Configuration for a stdio handler

apiVersion: "config.istio.io/v1alpha2"

kind: stdio

metadata:

  name: newhandler

  namespace: istio-system

spec:

 severity_levels:

   warning: 1 # Params.Level.WARNING

 outputAsJson: true

---

# Rule to send logentry instances to a stdio handler

apiVersion: "config.istio.io/v1alpha2"

kind: rule

metadata:

  name: newlogstdio

  namespace: istio-system

spec:

  match: "true" # match for all requests

  actions:

   - handler: newhandler.stdio

     instances:

     - newlog.logentry

---
# Configuration for a metric measuring bytes sent from a server
# to a client
apiVersion: "config.istio.io/v1alpha2"
kind: metric
metadata:
name: mongosentbytes
namespace: default
spec:
value: connection.sent.bytes | 0 # uses a TCP-specific attribute
dimensions:
source_service: source.service | "unknown"
source_version: source.labels["version"] | "unknown"
destination_version: destination.labels["version"] | "unknown"
monitoredResourceType: '"UNSPECIFIED"'
---
# Configuration for a metric measuring bytes sent from a client
# to a server
apiVersion: "config.istio.io/v1alpha2"
kind: metric
metadata:
name: mongoreceivedbytes
namespace: default
spec:
value: connection.received.bytes | 0 # uses a TCP-specific attribute
dimensions:
source_service: source.service | "unknown"
source_version: source.labels["version"] | "unknown"
destination_version: destination.labels["version"] | "unknown"
monitoredResourceType: '"UNSPECIFIED"'
---
# Configuration for a Prometheus handler
apiVersion: "config.istio.io/v1alpha2"
kind: prometheus
metadata:
name: mongohandler
namespace: default
spec:
metrics:
- name: mongo_sent_bytes # Prometheus metric name
instance_name: mongosentbytes.metric.default # Mixer instance name (fully-qualified)
kind: COUNTER
label_names:
- source_service
- source_version
- destination_version
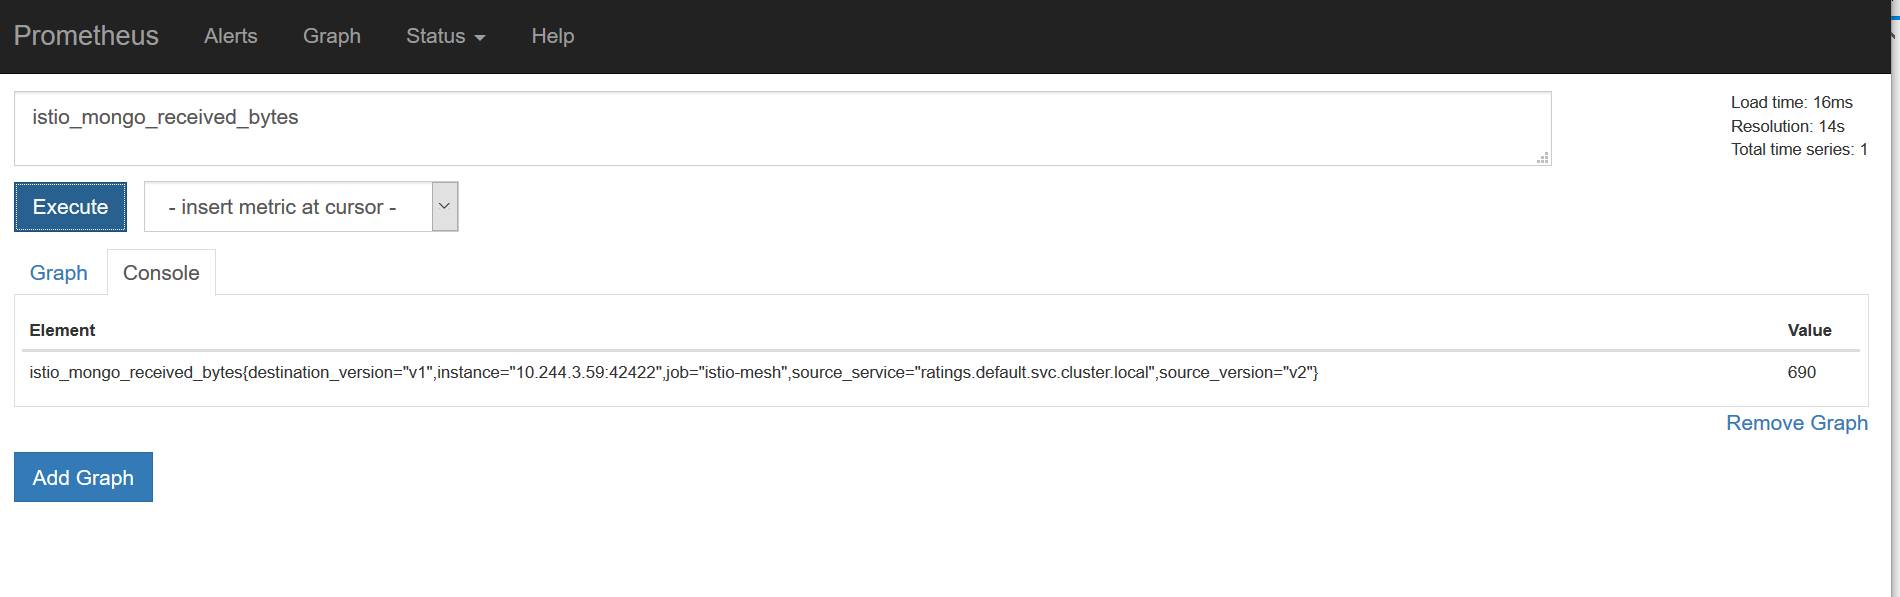
- name: mongo_received_bytes # Prometheus metric name
instance_name: mongoreceivedbytes.metric.default # Mixer instance name (fully-qualified)
kind: COUNTER
label_names:
- source_service
- source_version
- destination_version
---
# Rule to send metric instances to a Prometheus handler
apiVersion: "config.istio.io/v1alpha2"
kind: rule
metadata:
name: mongoprom
namespace: default
spec:
match: context.protocol == "tcp"
&& destination.service == "mongodb.default.svc.cluster.local"
actions:
- handler: mongohandler.prometheus
instances:
- mongoreceivedbytes.metric
- mongosentbytes.metric
执行命令:
istioctl create -f new_telemetry.yamlistioctl create -f tcp_telemetry.yaml为了测试支持收集tcp metric数据:
kubectl apply -f <(istioctl kube-inject -f samples/bookinfo/kube/bookinfo-ratings-v2.yaml)
kubectl apply -f <(istioctl kube-inject -f samples/bookinfo/kube/bookinfo-db.yaml)
istioctl create -f samples/bookinfo/kube/route-rule-ratings-db.yaml
4.测试
1)访问bookinfo事例
http://192.168.181.99:32693/productpage
2)查看prometheus ui
istio收集Metrics和日志信息的更多相关文章
- 【MySQL】关于MySQL错误日志信息的收集
为方便维护MySQL,写了个脚本用以提供收集错误信息的接口.这些错误信息来自与MySQL错误日志,而 通过grep mysql可以获取error-log的路径. #!/usr/bin/env pyth ...
- idou老师教你学Istio :如何用istio实现监控和日志采集
大家都知道istio可以帮助我们实现灰度发布.流量监控.流量治理等功能.每一个功能都帮助我们在不同场景中实现不同的业务.那Istio是如何帮助我们实现监控和日志采集的呢? 这里我们依然以Bookinf ...
- idou老师教你学Istio 25:如何用istio实现监控和日志采集
大家都知道istio可以帮助我们实现灰度发布.流量监控.流量治理等功能.每一个功能都帮助我们在不同场景中实现不同的业务.那Istio是如何帮助我们实现监控和日志采集的呢? 这里我们依然以Bookinf ...
- ASP.NET Core 实战:使用 NLog 将日志信息记录到 MongoDB
一.前言 在项目开发中,日志系统是系统的一个重要组成模块,通过在程序中记录运行日志.错误日志,可以让我们对于系统的运行情况做到很好的掌控.同时,收集日志不仅仅可以用于诊断排查错误,由于日志同样也是大量 ...
- 带你了解zabbix整合ELK收集系统异常日志触发告警~
今天来了解一下关于ELK的“L”-Logstash,没错,就是这个神奇小组件,我们都知道,它是ELK不可缺少的组件,完成了输入(input),过滤(fileter),output(输出)工作量,也是我 ...
- ELK收集Nginx自定义日志格式输出
1.ELK收集日志的有两种常用的方式: 1.1:不修改源日志格式,简单的说就是在logstash中转通过 grok方式进行过滤处理,将原始无规则的日志转换为规则日志(Logstash自定义日志格式) ...
- Flume 概述+环境配置+监听Hive日志信息并写入到hdfs
Flume介绍Flume是Apache基金会组织的一个提供的高可用的,高可靠的,分布式的海量日志采集.聚合和传输的系统,Flume支持在日志系统中定制各类数据发送方,用于收集数据:同时,Flume提供 ...
- svn log — 显示提交日志信息
http://www.cnblogs.com/eoiioe/archive/2009/01/06/1370580.html 概要svn log [PATH]svn log URL [PATH...]描 ...
- Android将日志信息自动发送到指定的邮箱中 邮件的内容以附件形式发送
今日整合了网上一些大神的例子(具体看了那些大神的?这个真不好意思我忘记了.下次再整合一定给大家补上,这次也只有默默的给那几个大神说声抱歉了.)做了一个“记录android项目中的日志信息,并将日志信息 ...
随机推荐
- python 操作mysql数据库demo
sudo apt-get install python-mysqldb #!/usr/bin/env python #encoding=utf-8 import sys import MySQLdb ...
- javascript之JSON小案例,实现添加数据与清楚数据
对json应用给出一个小案例,加深一些理解: <!DOCTYPE html PUBLIC "-//W3C//DTD HTML 4.01 Transitional//EN" & ...
- Spring AOP 初探
本文可作为北京尚学堂spring课程的学习笔记 首先谈谈什么是AOP 它能干什么 AOP Aspect Oriented Programming(面向切面的编程) 什么叫面向切面? 就是我们可以动态的 ...
- Java实现简易的文件的迁移器
Java作为世界上最受欢迎的一门编程语言,自然是有原因的.比如说我们可以直接的方便的调用其中的函数来实现我们想要的功能. 一个偶然的机会,我浏览API文档时发现了一个名为FileDialog的类,然后 ...
- C++ Primer 有感(标准库类型)
1.当进行string对象和字符串字面值混合连接操作时,+操作符的左右操作数必须至少有一个是string类型的: string s1= "hello"; sring s2=&quo ...
- shell sed过滤器详解
1. Sed简介sed 是一种在线编辑器,它一次处理一行内容.处理时,把当前处理的行存储在临时缓冲区中,称为"模式空间"(pattern space),接着用sed命令处理缓冲区中 ...
- 网站开发进阶(二十八)初探localStorage
初探localStorage 注: localStorage经典项目应用案例 HTML5中提供了localStorage对象可以将数据长期保存在客户端,直到人为清除. localStora ...
- Mahout系列之----共轭梯度预处理
对于大型矩阵,预处理是很重要的.常用的预处理方法有: (1) 雅克比预处理 (2)块状雅克比预处理 (3)半LU 分解 (4)超松弛法
- MacBook 最近发现的一些问题和技巧
本猫的mba最近键盘莫名会失灵,但用鼠标切换其他用户时时好的,切换回来又不行,体现如下: 1.Spotlight里可以输入,其他不可以 2.cmd+tab可以切换进程 现在只有重启后才可以恢复. 网上 ...
- spring揭秘 读书笔记 二 BeanFactory的对象注册与依赖绑定
本文是王福强所著<<spring揭秘>>一书的读书笔记 我们前面就说过,Spring的IoC容器时一个IoC Service Provider,而且IoC Service Pr ...