Benchmarking Apache Kafka: 2 Million Writes Per Second (On Three Cheap Machines)
I wrote a blog post about how LinkedIn uses Apache Kafka as a central publish-subscribe log for integrating data between applications, stream processing, and Hadoop data ingestion.

To actually make this work, though, this "universal log" has to be a cheap abstraction. If you want to use a system as a central data hub it has to be fast, predictable, and easy to scale so you can dump all your data onto it. My experience has been that systems that are fragile or expensive inevitably develop a wall of protective process to prevent people from using them; a system that scales easily often ends up as a key architectural building block just because using it is the easiest way to get things built.
I've always liked the benchmarks of Cassandra that show it doing a million writes per second on three hundred machines on EC2 and Google Compute Engine. I'm not sure why, maybe it is a Dr. Evil thing, but doing a million of anything per second is fun.
In any case, one of the nice things about a Kafka log is that, as we'll see, it is cheap. A million writes per second isn't a particularly big thing. This is because a log is a much simpler thing than a database or key-value store. Indeed our production clusters take tens of millions of reads and writes per second all day long and they do so on pretty modest hardware.
But let's do some benchmarking and take a look.
Kafka in 30 seconds
To help understand the benchmark, let me give a quick review of what Kafka is and a few details about how it works. Kafka is a distributed messaging system originally built at LinkedIn and now part of the Apache Software Foundation and used by a variety of companies.
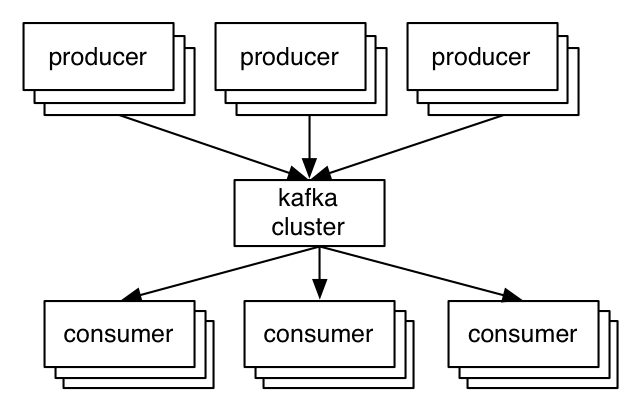
The general setup is quite simple. Producers send records to the cluster which holds on to these records and hands them out to consumers:

The key abstraction in Kafka is the topic. Producers publish their records to a topic, and consumers subscribe to one or more topics. A Kafka topic is just a sharded write-ahead log. Producers append records to these logs and consumers subscribe to changes. Each record is a key/value pair. The key is used for assigning the record to a log partition (unless the publisher specifies the partition directly).
Here is a simple example of a single producer and consumer reading and writing from a two-partition topic.

This picture shows a producer process appending to the logs for the two partitions, and a consumer reading from the same logs. Each record in the log has an associated entry number that we call the offset. This offset is used by the consumer to describe it's position in each of the logs.
These partitions are spread across a cluster of machines, allowing a topic to hold more data than can fit on any one machine.
Note that unlike most messaging systems the log is always persistent. Messages are immediately written to the filesystem when they are received. Messages are not deleted when they are read but retained with some configurable SLA (say a few days or a week). This allows usage in situations where the consumer of data may need to reload data. It also makes it possible to support space-efficient publish-subscribe as there is a single shared log no matter how many consumers; in traditional messaging systems there is usually a queue per consumer, so adding a consumer doubles your data size. This makes Kafka a good fit for things outside the bounds of normal messaging systems such as acting as a pipeline for offline data systems such as Hadoop. These offline systems may load only at intervals as part of a periodic ETL cycle, or may go down for several hours for maintenance, during which time Kafka is able to buffer even TBs of unconsumed data if needed.
Kafka also replicates its logs over multiple servers for fault-tolerance. One important architectural aspect of our replication implementation, in contrast to other messaging systems, is that replication is not an exotic bolt-on that requires complex configuration, only to be used in very specialized cases. Instead replication is assumed to be the default: we treat un-replicated data as a special case where the replication factor happens to be one.
Producers get an acknowledgement back when they publish a message containing the record's offset. The first record published to a partition is given the offset 0, the second record 1, and so on in an ever-increasing sequence. Consumers consume data from a position specified by an offset, and they save their position in a log by committing periodically: saving this offset in case that consumer instance crashes and another instance needs to resume from it's position.
Okay, hopefully that all made sense (if not, you can read a more complete introduction to Kafka here).
This Benchmark
This test is against trunk, as I made some improvements to the performance tests for this benchmark. But nothing too substantial has changed since the last full release, so you should see similar results with 0.8.1. I am also using our newly re-written Java producer, which offers much improved throughput over the previous producer client.
I've followed the basic template of this very nice RabbitMQ benchmark, but I covered scenarios and options that were more relevant to Kafka.
One quick philosophical note on this benchmark. For benchmarks that are going to be publicly reported, I like to follow a style I call "lazy benchmarking". When you work on a system, you generally have the know-how to tune it to perfection for any particular use case. This leads to a kind of benchmarketing where you heavily tune your configuration to your benchmark or worse have a different tuning for each scenario you test. I think the real test of a system is not how it performs when perfectly tuned, but rather how it performs "off the shelf". This is particularly true for systems that run in a multi-tenant setup with dozens or hundreds of use cases where tuning for each use case would be not only impractical but impossible. As a result, I have pretty much stuck with default settings, both for the server and the clients. I will point out areas where I suspect the result could be improved with a little tuning, but I have tried to resist the temptation to do any fiddling myself to improve the results.
I have posted my exact configurations and commands, so it should be possible to replicate results on your own gear if you are interested.
The Setup
For these tests, I had six machines each has the following specs
- Intel Xeon 2.5 GHz processor with six cores
- Six 7200 RPM SATA drives
- 32GB of RAM
- 1Gb Ethernet
The Kafka cluster is set up on three of the machines. The six drives are directly mounted with no RAID (JBOD style). The remaining three machines I use for Zookeeper and for generating load.
A three machine cluster isn't very big, but since we will only be testing up to a replication factor of three, it is all we need. As should be obvious, we can always add more partitions and spread data onto more machines to scale our cluster horizontally.
This hardware is actually not LinkedIn's normal Kafka hardware. Our Kafka machines are more closely tuned to running Kafka, but are less in the spirit of "off-the-shelf" I was aiming for with these tests. Instead, I borrowed these from one of our Hadoop clusters, which runs on probably the cheapest gear of any of our persistent systems. Hadoop usage patterns are pretty similar to Kafka's, so this is a reasonable thing to do.
Okay, without further ado, the results!
Producer Throughput
These tests will stress the throughput of the producer. No consumers are run during these tests, so all messages are persisted but not read (we'll test cases with both producer and consumer in a bit). Since we have recently rewritten our producer, I am testing this new code.
Single producer thread, no replication
| 821,557 records/sec |
| (78.3 MB/sec) |
For this first test I create a topic with six partitions and no replication. Then I produce 50 million small (100 byte) records as quickly as possible from a single thread.
The reason for focusing on small records in these tests is that it is the harder case for a messaging system (generally). It is easy to get good throughput in MB/sec if the messages are large, but much harder to get good throughput when the messages are small, as the overhead of processing each message dominates.
Throughout this benchmark, when I am reporting MB/sec, I am reporting just the value size of the record times the request per second, none of the other overhead of the request is included. So the actually network usage is higher than what is reported. For example with a 100 byte message we would also transmit about 22 bytes of overhead per message (for an optional key, size delimiting, a message CRC, the record offset, and attributes flag), as well as some overhead for the request (including the topic, partition, required acknowledgements, etc). This makes it a little harder to see where we hit the limits of the NIC, but this seems a little more reasonable then including our own overhead bytes in throughput numbers. So, in the above result, we are likely saturating the 1 gigabit NIC on the client machine.
One immediate observation is that the raw numbers here are much higher than people expect, especially for a persistent storage system. If you are used to random-access data systems, like a database or key-value store, you will generally expect maximum throughput around 5,000 to 50,000 queries-per-second, as this is close to the speed that a good RPC layer can do remote requests. We exceed this due to two key design principles:
- We work hard to ensure we do linear disk I/O. The six cheap disks these servers have gives an aggregate throughput of 822 MB/sec of linear disk I/O. This is actually well beyond what we can make use of with only a 1 gigabit network card. Many messaging systems treat persistence as an expensive add-on that decimates performance and should be used only sparingly, but this is because they are not able to do linear I/O.
- At each stage we work on batching together small bits of data into larger network and disk I/O operations. For example, in the new producer we use a "group commit"-like mechanism to ensure that any record sends initiated while another I/O is in progress get grouped together. For more on understanding the importance of batching, check out this presentation by David Patterson on why "Latency Lags Bandwidth".
If you are interested in the details you can read a little more about this in our design documents.
Single producer thread, 3x asynchronous replication
| 786,980 records/sec |
| (75.1 MB/sec) |
This test is exactly the same as the previous one except that now each partition has three replicas (so the total data written to network or disk is three times higher). Each server is doing both writes from the producer for the partitions for which it is a master, as well as fetching and writing data for the partitions for which it is a follower.
Replication in this test is asynchronous. That is, the server acknowledges the write as soon as it has written it to its local log without waiting for the other replicas to also acknowledge it. This means, if the master were to crash, it would likely lose the last few messages that had been written but not yet replicated. This makes the message acknowledgement latency a little better at the cost of some risk in the case of server failure.
The key take away I would like people to have from this is that replication can be fast. The total cluster write capacity is, of course, 3x less with 3x replication (since each write is done three times), but the throughput is still quite good per client. High performance replication comes in large part from the efficiency of our consumer (the replicas are really nothing more than a specialized consumer) which I will discuss in the consumer section.
Single producer thread, 3x synchronous replication
| 421,823 records/sec |
| (40.2 MB/sec) |
This test is the same as above except that now the master for a partition waits for acknowledgement from the full set of in-sync replicas before acknowledging back to the producer. In this mode, we guarantee that messages will not be lost as long as one in-sync replica remains.
Synchronous replication in Kafka is not fundamentally very different from asynchronous replication. The leader for a partition always tracks the progress of the follower replicas to monitor their liveness, and we never give out messages to consumers until they are fully acknowledged by replicas. With synchronous replication we just wait to respond to the producer request until the followers have replicated it.
This additional latency does seem to affect our throughput. Since the code path on the server is very similar, we could probably ameliorate this impact by tuning the batching to be a bit more aggressive and allowing the client to buffer more outstanding requests. However, in spirit of avoiding special case tuning, I have avoided this.
Three producers, 3x async replication
| 2,024,032 records/sec |
| (193.0 MB/sec) |
Our single producer process is clearly not stressing our three node cluster. To add a little more load, I'll now repeat the previous async replication test, but now use three producer load generators running on three different machines (running more processes on the same machine won't help as we are saturating the NIC). Then we can look at the aggregate throughput across these three producers to get a better feel for the cluster's aggregate capacity.
Producer Throughput Versus Stored Data
One of the hidden dangers of many messaging systems is that they work well only as long as the data they retain fits in memory. Their throughput falls by an order of magnitude (or more) when data backs up and isn't consumed (and hence needs to be stored on disk). This means things may be running fine as long as your consumers keep up and the queue is empty, but as soon as they lag, the whole messaging layer backs up with unconsumed data. The backup causes data to go to disk which in turns causes performance to drop to a rate that means messaging system can no longer keep up with incoming data and either backs up or falls over. This is pretty terrible, as in many cases the whole purpose of the queue was to handle such a case gracefully.
Since Kafka always persists messages the performance is O(1) with respect to unconsumed data volume.
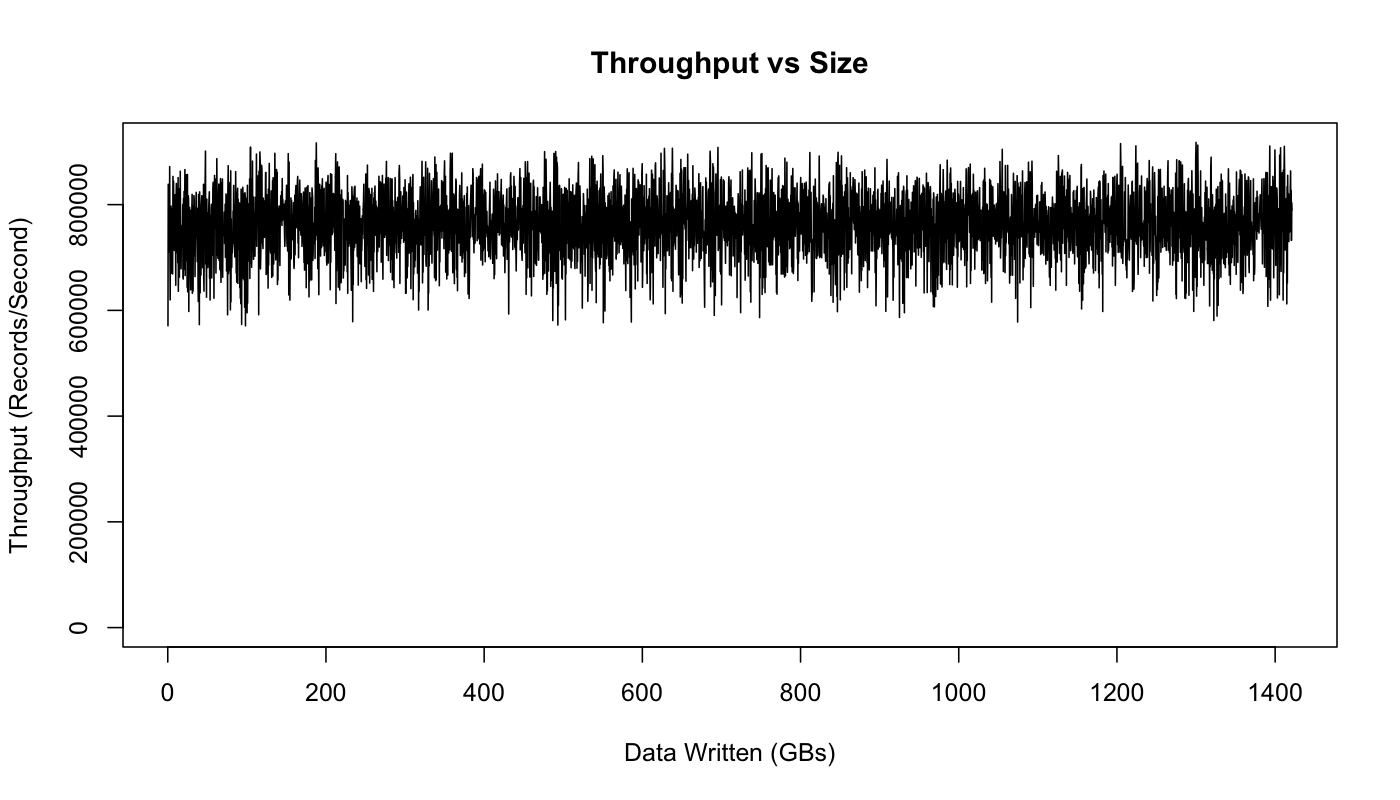
To test this experimentally, let's run our throughput test over an extended period of time and graph the results as the stored dataset grows:

This graph actually does show some variance in performance, but no impact due to data size: we perform just as well after writing a TB of data, as we do for the first few hundred MBs.
The variance seems to be due to Linux's I/O management facilities that batch data and then flush it periodically. This is something we have tuned for a little better on our production Kafka setup. Some notes on tuning I/O are available here.
Consumer Throughput
Okay now let's turn our attention to consumer throughput.
Note that the replication factor will not effect the outcome of this test as the consumer only reads from one replica regardless of the replication factor. Likewise, the acknowledgement level of the producer also doesn't matter as the consumer only ever reads fully acknowledged messages, (even if the producer doesn't wait for full acknowledgement). This is to ensure that any message the consumer sees will always be present after a leadership handoff (if the current leader fails).
Single Consumer
| 940,521 records/sec |
| (89.7 MB/sec) |
For the first test, we will consume 50 million messages in a single thread from our 6 partition 3x replicated topic.
Kafka's consumer is very efficient. It works by fetching chunks of log directly from the filesystem. It uses the sendfile API to transfer this directly through the operating system without the overhead of copying this data through the application. This test actually starts at the beginning of the log, so it is doing real read I/O. In a production setting, though, the consumer reads almost exclusively out of the OS pagecache, since it is reading data that was just written by some producer (so it is still cached). In fact, if you run I/O stat on a production server you actually see that there are no physical reads at all even though a great deal of data is being consumed.
Making consumers cheap is important for what we want Kafka to do. For one thing, the replicas are themselves consumers, so making the consumer cheap makes replication cheap. In addition, this makes handling out data an inexpensive operation, and hence not something we need to tightly control for scalability reasons.
Three Consumers
| 2,615,968 records/sec |
| (249.5 MB/sec) |
Let's repeat the same test, but run three parallel consumer processes, each on a different machine, and all consuming the same topic.
As expected, we see near linear scaling (not surprising because consumption in our model is so simple).
Producer and Consumer
| 795,064 records/sec |
| (75.8 MB/sec) |
The above tests covered just the producer and the consumer running in isolation. Now let's do the natural thing and run them together. Actually, we have technically already been doing this, since our replication works by having the servers themselves act as consumers.
All the same, let's run the test. For this test we'll run one producer and one consumer on a six partition 3x replicated topic that begins empty. The producer is again using async replication. The throughput reported is the consumer throughput (which is, obviously, an upper bound on the producer throughput).
As we would expect, the results we get are basically the same as we saw in the producer only case—the consumer is fairly cheap.
Effect of Message Size
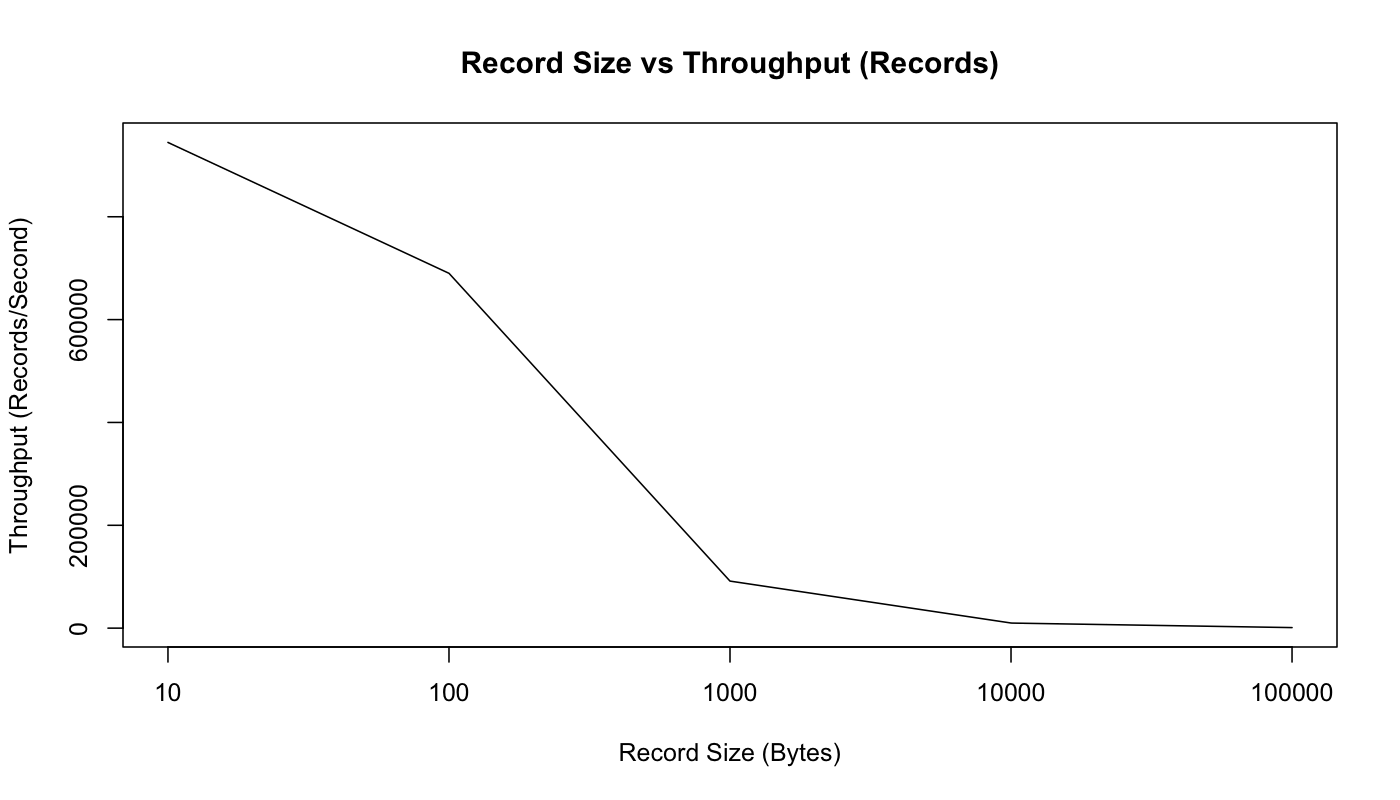
I have mostly shown performance on small 100 byte messages. Smaller messages are the harder problem for a messaging system as they magnify the overhead of the bookkeeping the system does. We can show this by just graphing throughput in both records/second and MB/second as we vary the record size.

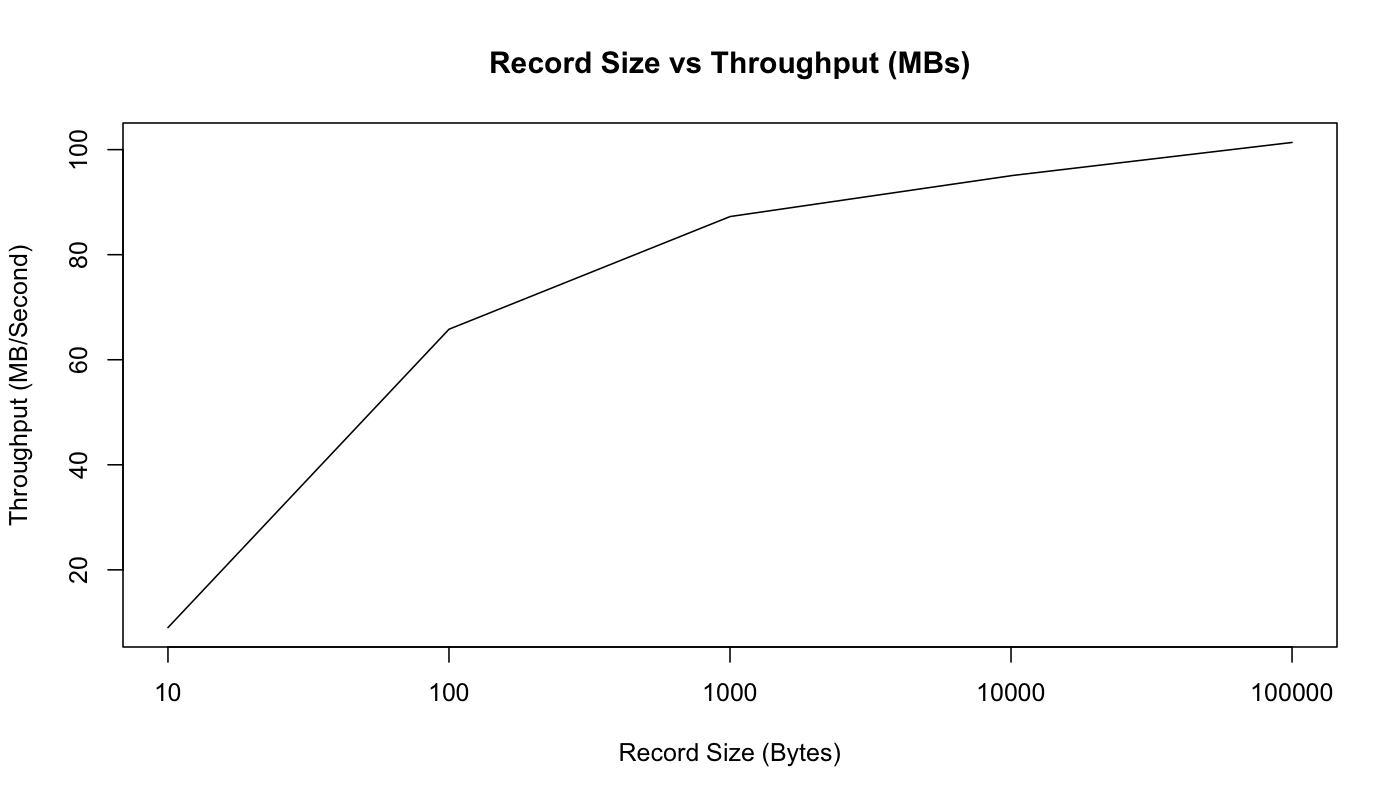
So, as we would expect, this graph shows that the raw count of records we can send per second decreases as the records get bigger. But if we look at MB/second, we see that the total byte throughput of real user data increases as messages get bigger:

We can see that with the 10 byte messages we are actually CPU bound by just acquiring the lock and enqueuing the message for sending—we are not able to actually max out the network. However, starting with 100 bytes, we are actually seeing network saturation (though the MB/sec continues to increase as our fixed-size bookkeeping bytes become an increasingly small percentage of the total bytes sent).
End-to-end Latency
| 2 ms (median) |
| 3 ms (99th percentile) |
| 14 ms (99.9th percentile) |
We have talked a lot about throughput, but what is the latency of message delivery? That is, how long does it take a message we send to be delivered to the consumer? For this test, we will create producer and consumer and repeatedly time how long it takes for a producer to send a message to the kafka cluster and then be received by our consumer.
Note that, Kafka only gives out messages to consumers when they are acknowledged by the full in-sync set of replicas. So this test will give the same results regardless of whether we use sync or async replication, as that setting only affects the acknowledgement to the producer.
Replicating this test
If you want to try out these benchmarks on your own machines, you can. As I said, I mostly just used our pre-packaged performance testing tools that ship with Kafka and mostly stuck with the default configs both for the server and for the clients. However, you can see more details of the configuration and commands here.
Benchmarking Apache Kafka: 2 Million Writes Per Second (On Three Cheap Machines)的更多相关文章
- Apache Kafka: 优化部署的10个最佳实践
原文作者:Ben Bromhead 译者:江玮 原文地址:https://www.infoq.com/articles/apache-kafka-best-practices-to-opti ...
- Apache Kafka: Next Generation Distributed Messaging System---reference
Introduction Apache Kafka is a distributed publish-subscribe messaging system. It was originally dev ...
- An Overview of End-to-End Exactly-Once Processing in Apache Flink (with Apache Kafka, too!)
01 Mar 2018 Piotr Nowojski (@PiotrNowojski) & Mike Winters (@wints) This post is an adaptation o ...
- How Cigna Tuned Its Spark Streaming App for Real-time Processing with Apache Kafka
Explore the configuration changes that Cigna’s Big Data Analytics team has made to optimize the perf ...
- Configuring High Availability and Consistency for Apache Kafka
To achieve high availability and consistency targets, adjust the following parameters to meet your r ...
- How-to: Do Real-Time Log Analytics with Apache Kafka, Cloudera Search, and Hue
Cloudera recently announced formal support for Apache Kafka. This simple use case illustrates how to ...
- Understanding When to use RabbitMQ or Apache Kafka
https://content.pivotal.io/rabbitmq/understanding-when-to-use-rabbitmq-or-apache-kafka How do humans ...
- Understanding When to use RabbitMQ or Apache Kafka Kafka RabbitMQ 性能对比
Understanding When to use RabbitMQ or Apache Kafka https://content.pivotal.io/rabbitmq/understanding ...
- Apache Kafka - How to Load Test with JMeter
In this article, we are going to look at how to load test Apache Kafka, a distributed streaming plat ...
随机推荐
- 第五章 服务容错保护:Spring Cloud Hystrix
在微服务架构中,我们将系统拆分为很多个服务,各个服务之间通过注册与订阅的方式相互依赖,由于各个服务都是在各自的进程中运行,就有可能由于网络原因或者服务自身的问题导致调用故障或延迟,随着服务的积压,可能 ...
- rabbitmq.config配置参数详解
rabbitmq.config详细配置参数 详细使用方法请点击:http://www.cnblogs.com/wyt007/p/9073316.html Key Documentation tcp_l ...
- 冒泡排序/选择排序/插入排序(c#)
---恢复内容开始--- 每次看这些排序都像没见过一样,完全理解不了,可是不久前明明了解的十分透彻.记下来记下来记下来! 1>>>冒泡排序:相邻的两两相比 把大的(或者小的)放后边, ...
- EF 批量 添加 修改 删除
1批量添加 db.T_Investigator.AddRange(list) 2批量删除 db.T_Investigator.RemoveRange(list) 3批量修改 for 循 ...
- C# 操作Excel图形——绘制、读取、隐藏、删除图形
简介 本篇文章将介绍C# 如何处理Excel图形相关的问题,包括以下内容要点: 1.绘制图形 1.1 绘制图形并添加文本到图形 1.2 添加图片到图形 1.3 设置图形阴影效果 1.4 设置图形透明度 ...
- Mongo基础 索引的使用
MongoDB中的索引和其他数据库索引类似,也是使用B-Tree结构.mongodb的索引是在collection级别上的,并且支持在任何列或者集合内的文档的子列中创建索引. 所有的MongoDB集合 ...
- PHP基础:MYSQL数据库操作
1.连接到数据库: · 面向对象的方法: $db = new mysqli('hostname', 'username', 'password', 'dbname'); · 面向过程的方法: $db ...
- 原生js及H5模拟鼠标点击拖拽
一.原生js 1.拖拽的流程动作 鼠标按下 触发onmousedown事件 鼠标移动 触发onmousemove事件 鼠标松开 触发onmouseup事件 2.注意事项: 要防止div移出可视框,要限 ...
- sublime 使用快捷键
Goto Anything 快捷键 Ctrl+P (支持模糊匹配) 1,查找文件 在查找框中输入文件目录(知道目录直接输入目录,不知道目录直接输入页面名称即可.支持模糊匹配) index.ht ...
- phpstudy等php本地环境运行缓慢的问题解决方法
我们经常会使用些一键安装包部署本地服务器环境.比如phpstudy.但是会有不少人发现,wordpress等使用数据库的程序打开或者切换页面的速度明显低于静态站点.甚至需要好几秒.这个问题一直困扰了我 ...
