Regularized logistic regression
要解决的问题是,给出了具有2个特征的一堆训练数据集,从该数据的分布可以看出它们并不是非常线性可分的,因此很有必要用更高阶的特征来模拟。例如本程序中个就用到了特征值的6次方来求解。
Data
To begin, load the files 'ex5Logx.dat' and ex5Logy.dat' into your program. This dataset represents the training set of a logistic regression problem with two features. To avoid confusion later, we will refer to the two input features contained in 'ex5Logx.dat' as
and
. So in the 'ex5Logx.dat' file, the first column of numbers represents the feature
After loading the data, plot the points using different markers to distinguish between the two classifications. The commands in Matlab/Octave will be:
x = load('ex5Logx.dat');

y = load('ex5Logy.dat');

figure

% Find the indices for the 2 classes

pos = find(y); neg = find(y == 0);

plot(x(pos, 1), x(pos, 2), '+')

hold on

plot(x(neg, 1), x(neg, 2), 'o')
After plotting your image, it should look something like this:

Model
the hypothesis function is

Let's look at the
parameter in the sigmoid function
.
In this exercise, we will assign
to be all monomials (meaning polynomial terms) of
To clarify this notation: we have made a 28-feature vector
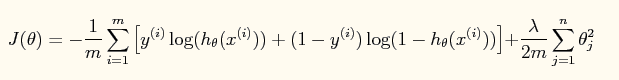
此时加入了规则项后的系统的损失函数为:


Newton’s method
Recall that the Newton's Method update rule is
1.
is your feature vector, which is a 28x1 vector in this exercise.
2.
is a 28x1 vector.
3.
and
are 28x28 matrices.
4.
and
are scalars.
5. The matrix following
in the Hessian formula is a 28x28 diagonal matrix with a zero in the upper left and ones on every other diagonal entry.
After convergence, use your values of theta to find the decision boundary in the classification problem. The decision boundary is defined as the line where


Code
%载入数据

clc,clear,close all;

x = load('ex5Logx.dat');

y = load('ex5Logy.dat');

%画出数据的分布图

plot(x(find(y),),x(find(y),),'o','MarkerFaceColor','b')

hold on;

plot(x(find(y==),),x(find(y==),),'r+')

legend('y=1','y=0')

% Add polynomial features to x by

% calling the feature mapping function

% provided in separate m-file

x = map_feature(x(:,), x(:,));  %投影到高维特征空间

[m, n] = size(x);

% Initialize fitting parameters

theta = zeros(n, );

% Define the sigmoid function

g = inline('1.0 ./ (1.0 + exp(-z))');

% setup for Newton's method

MAX_ITR = ;

J = zeros(MAX_ITR, );

% Lambda is the regularization parameter

lambda = ;%lambda=,,,修改这个地方,运行3次可以得到3种结果。

% Newton's Method

for i = :MAX_ITR

    % Calculate the hypothesis function

    z = x * theta;

    h = g(z);

    % Calculate J (for testing convergence) -- 损失函数

    J(i) =(/m)*sum(-y.*log(h) - (-y).*log(-h))+ ...

    (lambda/(*m))*norm(theta([:end]))^;

    % Calculate gradient and hessian.

    G = (lambda/m).*theta; G() = ; % extra term for gradient

    L = (lambda/m).*eye(n); L() = ;% extra term for Hessian

    grad = ((/m).*x' * (h-y)) + G;

    H = ((/m).*x' * diag(h) * diag(1-h) * x) + L;

    % Here is the actual update

    theta = theta - H\grad;

end

% Plot the results

% We will evaluate theta*x over a

% grid of features and plot the contour

% where theta*x equals zero

% Here is the grid range

u = linspace(-, 1.5, );

v = linspace(-, 1.5, );

z = zeros(length(u), length(v));

% Evaluate z = theta*x over the grid

for i = :length(u)

    for j = :length(v)

        z(i,j) = map_feature(u(i), v(j))*theta;%这里绘制的并不是损失函数与迭代次数之间的曲线,而是线性变换后的值

    end

end

z = z'; % important to transpose z before calling contour

% Plot z =

% Notice you need to specify the range [, ]

contour(u, v, z, [, ], 'LineWidth', )%在z上画出为0值时的界面,因为为0时刚好概率为0.,符合要求

legend('y = 1', 'y = 0', 'Decision boundary')

title(sprintf('\\lambda = %g', lambda), 'FontSize', )

hold off

% Uncomment to plot J

% figure

% plot(:MAX_ITR-, J, 'o--', 'MarkerFaceColor', 'r', 'MarkerSize', )

% xlabel('Iteration'); ylabel('J')
Result


Regularized logistic regression的更多相关文章
- machine learning(15) --Regularization:Regularized logistic regression
Regularization:Regularized logistic regression without regularization 当features很多时会出现overfitting现象,图 ...
- matlab(7) Regularized logistic regression : mapFeature(将feature增多) and costFunctionReg
Regularized logistic regression : mapFeature(将feature增多) and costFunctionReg ex2_reg.m文件中的部分内容 %% == ...
- matlab(6) Regularized logistic regression : plot data(画样本图)
Regularized logistic regression : plot data(画样本图) ex2data2.txt 0.051267,0.69956,1-0.092742,0.68494, ...
- 编程作业2.2:Regularized Logistic regression
题目 在本部分的练习中,您将使用正则化的Logistic回归模型来预测一个制造工厂的微芯片是否通过质量保证(QA),在QA过程中,每个芯片都会经过各种测试来保证它可以正常运行.假设你是这个工厂的产品经 ...
- matlab(8) Regularized logistic regression : 不同的λ(0,1,10,100)值对regularization的影响,对应不同的decision boundary\ 预测新的值和计算模型的精度predict.m
不同的λ(0,1,10,100)值对regularization的影响\ 预测新的值和计算模型的精度 %% ============= Part 2: Regularization and Accur ...
- 吴恩达机器学习笔记22-正则化逻辑回归模型(Regularized Logistic Regression)
针对逻辑回归问题,我们在之前的课程已经学习过两种优化算法:我们首先学习了使用梯度下降法来优化代价函数
- Stanford机器学习---第三讲. 逻辑回归和过拟合问题的解决 logistic Regression & Regularization
原文:http://blog.csdn.net/abcjennifer/article/details/7716281 本栏目(Machine learning)包括单参数的线性回归.多参数的线性回归 ...
- Machine Learning - 第3周(Logistic Regression、Regularization)
Logistic regression is a method for classifying data into discrete outcomes. For example, we might u ...
- 【机器学习】Octave 实现逻辑回归 Logistic Regression
ex2data1.txt ex2data2.txt 本次算法的背景是,假如你是一个大学的管理者,你需要根据学生之前的成绩(两门科目)来预测该学生是否能进入该大学. 根据题意,我们不难分辨出这是一种二分 ...
随机推荐
- html5开发页游(前话)
导师要求模仿某个页游网站开发益智小游戏.老板的要求是要跨平台,IOS,Android.PC.Mac等系统主要通过浏览器打开都能用.那个网站的页游是通过flash实现的,使用这种方法肯定不能满足老板的要 ...
- Python中的list,tuple,dict和set
List list的创建与检索 Python内置的一种数据类型是列表:list.list是一种有序的集合,可以随时添加和删除其中的元素. 构造list非常简单,直接用 [ ] 把list的所有元素都括 ...
- 题解 CF896C 【Willem, Chtholly and Seniorious】
貌似珂朵莉树是目前为止(我学过的)唯一一个可以维护区间x次方和查询的高效数据结构. 但是这玩意有个很大的毛病,就是它的高效建立在数据随机的前提下. 在数据随机的时候assign操作比较多,所以它的复杂 ...
- Android后台进程与前台线程间的区别使用
博客出自:http://blog.csdn.net/liuxian13183,转载注明出处! All Rights Reserved ! 很早就翻译过Android API的一篇文章Android高级 ...
- Spring可扩展Schema标签
基于Spring可扩展Schema提供自己定义配置支持 http://blog.csdn.net/cutesource/article/details/5864562 WARN : org.sprin ...
- 參加北京bluemix云计算大会偶记
我就不写散文了.博客也要轻量化. 记录心路历程吧. 这是一次ibm的技术大会.也是传道大会,洗脑大会.会议主题看起来非常多,占领了北京国际饭店的三层,作为一个老ibm bp感受非常多. 1.北京的创业 ...
- Delphi新语法 For ..In
首先我们要知道哪些类型可以用For In吧,下面就是: for Element in ArrayExpr do Stmt; 数组 for Element in StringExpr do S ...
- POJ 3275 两种做法
题意: 思路: 1.Floyd传递闭包 n^3/32 勉强卡过去吧-- 2.用邻接表搞Floyd 也是勉强卡过去-- 最后用n*(n-1)-矩阵中为1的个数就OK了 传递闭包: //By Sirius ...
- POJ 1459 最大流 第二题
http://poj.org/problem?id=1459 也是网络流的基础,只是虚拟出一个源点和终点,对应的生产值和消费值就加到与源点和终点的边上,然后做一次bfs就好了. #include &l ...
- Atcoder Grand Contest 107 A Biscuits
A - Biscuits Time limit : 2sec / Memory limit : 256MB Score : 200 points Problem Statement There are ...