matplotlib绘制三维图
本文参考官方文档:http://matplotlib.org/mpl_toolkits/mplot3d/tutorial.html
起步
新建一个matplotlib.figure.Figure对象,然后向其添加一个Axes3D类型的axes对象。
其中Axes3D对象的创建,类似其他axes对象,只不过使用projection='3d'关键词。
import matplotlib.pyplot as plt

from mpl_toolkits.mplot3d import Axes3D

fig = plt.figure()

ax = fig.add_subplot(111, projection='3d')
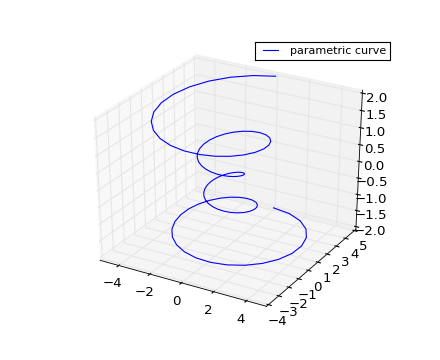
3D曲线图
import matplotlib as mpl

from mpl_toolkits.mplot3d import Axes3D

import numpy as np

import matplotlib.pyplot as plt

mpl.rcParams['legend.fontsize'] = 10

fig = plt.figure()

ax = fig.gca(projection='3d')

theta = np.linspace(-4 * np.pi, 4 * np.pi, 100)

z = np.linspace(-2, 2, 100)

r = z**2 + 1

x = r * np.sin(theta)

y = r * np.cos(theta)

ax.plot(x, y, z, label='parametric curve')

ax.legend()

ax.set_xlabel('X Label')

ax.set_ylabel('Y Label')

ax.set_zlabel('Z Label')

plt.show()
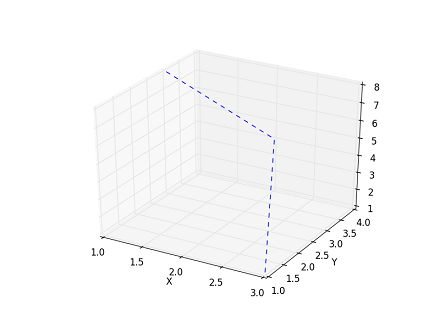
简化用法:
from pylab import *

from mpl_toolkits.mplot3d import Axes3D

plt.gca(projection='3d')

plt.plot([1,2,3],[3,4,1],[8,4,1],'--')

plt.xlabel('X')

plt.ylabel('Y')

#plt.zlabel('Z') #无法使用
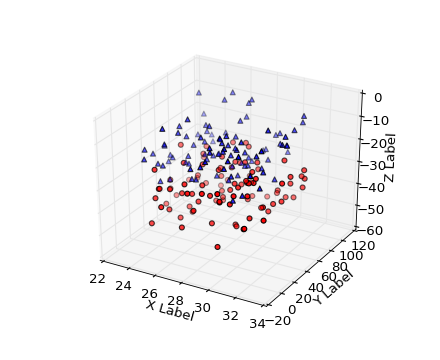
3D散点图
import numpy as np

from mpl_toolkits.mplot3d import Axes3D

import matplotlib.pyplot as plt

def randrange(n, vmin, vmax):

    return (vmax-vmin)*np.random.rand(n) + vmin

fig = plt.figure()

ax = fig.add_subplot(111, projection='3d')

n = 100

for c, m, zl, zh in [('r', 'o', -50, -25), ('b', '^', -30, -5)]:

    xs = randrange(n, 23, 32)

    ys = randrange(n, 0, 100)

    zs = randrange(n, zl, zh)

    ax.scatter(xs, ys, zs, c=c, marker=m)

ax.set_xlabel('X Label')

ax.set_ylabel('Y Label')

ax.set_zlabel('Z Label')

plt.show()
matplotlib绘制三维图的更多相关文章
- Python学习(一) —— matplotlib绘制三维轨迹图
在研究SLAM时常常需要对其输出的位姿进行复现以检测算法效果,在ubuntu系统中使用Python可以很好的完成相关的工作. 一. Ubuntu下Python的使用 在Ubuntu下使用Python有 ...
- python使用matplotlib绘制折线图教程
Matplotlib是一个Python工具箱,用于科学计算的数据可视化.借助它,Python可以绘制如Matlab和Octave多种多样的数据图形.下面这篇文章主要介绍了python使用matplot ...
- Python使用matplotlib绘制三维曲线
本文主要演示如何使用matplotlib绘制三维图形 代码如下: # -*- coding: UTF-8 -*- import matplotlib as mpl from mpl_toolkits. ...
- 使用Matlab绘制三维图的几种方法
以下六个函数都可以实现绘制三维图像: surf(xx,yy,zz); surfc(xx,yy,zz); mesh(xx,yy,zz); meshc(xx,yy,zz); meshz(xx,yy,zz) ...
- python学习之matplotlib绘制动图(FuncAnimation()参数)
1.函数FuncAnimation(fig,func,frames,init_func,interval,blit)是绘制动图的主要函数,其参数如下: a.fig 绘制动图的画布名称 b.func自定 ...
- python绘制三维图
作者:桂. 时间:2017-04-27 23:24:55 链接:http://www.cnblogs.com/xingshansi/p/6777945.html 本文仅仅梳理最基本的绘图方法. 一. ...
- Python:matplotlib绘制线条图
线型图是学习matplotlib绘图的最基础案例.我们来看看具体过程: 下面我们将两条曲线绘制到一个图形里: 可以看到这种方式下,两个线条共用一个坐标轴,并且自动区分颜色. plot方法的核心是 ...
- 使用 NumPy 和 Matplotlib 绘制函数图
Numpy是用python进行科学计算的基本程序包. 它主要包含以下功能: ♦强大的n维数组对象 ♦复杂(广播)函数工具 ♦用于集成c/c++和Fortran代码-有用的线性代数 ♦傅里叶变换和随机数 ...
- Python开发【模块】:matplotlib 绘制折线图
matplotlib 1.安装matplotlib ① linux系统安装 # 安装matplotlib模块 $ sudo apt-get install python3-matplotlib # 如 ...
随机推荐
- python pdb调试模块使用
一般在需要调试的文件加入下面代码即可 ################ _DEBUG = True ... if _DEBUG == True import pdb pdb.set_trace() # ...
- Android handler.obtainMessage()
在handler.obtainMessage()的参数是这样写的: Message android.os.Handler.obtainMessage(int what, int arg1, int a ...
- Android yyyymmdd转成yyyy-MM-dd格式
//把yyyymmdd转成yyyy-MM-dd格式 public static String formatDate(String str){ SimpleDateFormat sf1 = new Si ...
- Haxe - Actuate.Tween
方法解释: Actuate.tween( target : Dynamic , duration : Float , properties : Dynamic , ?overwrite : Bool ...
- spring-boot-quartz, 依赖spring-boot-parent
spring-boot-quartz, 依赖spring-boot-parent spring-boot Easyui Quartz 项目启动后输入:http://localhost/ 数据库文件: ...
- Miller-Rabin素数测试学习小计
1.Miller-Rabin是干啥的?它是用来检测一个数字(一般是很大的数字)是不是素数: 2.Miller-Rabin算法基于的两个定理: (1)费尔马小定理:如果p是一个素数,且0<a< ...
- 实现微信好友列表的php代码
<!DOCTYPE html PUBLIC "-//W3C//DTD XHTML 1.0 Transitional//EN" "http://www.w3.org/ ...
- 结构体TABLE_share
struct TABLE_share { static inline TABLE **next_ptr(TABLE *l) { return &l->share_next; } stat ...
- UVa 10129 (并查集 + 欧拉路径) Play on Words
题意: 有n个由小写字母的单词,要求判断是否存在某种排列使得相邻的两个单词,前一个单词末字母与后一个单词首字母相同. 分析: 将单词的两个字母看做节点,则一个单词可以看做一条有向边.那么题中所求的排列 ...
- Android ashmem hacking
/********************************************************************** * Android ashmem hacking * 声 ...