d3.js 绘制极坐标图(polar plot)
0.引言
在极坐标系中,任意位置可由一个夹角和一段相对原点(极点)的距离表示。也就是说,我们可以用 (angle,r) 来表示极坐标系中的点。
1.数据
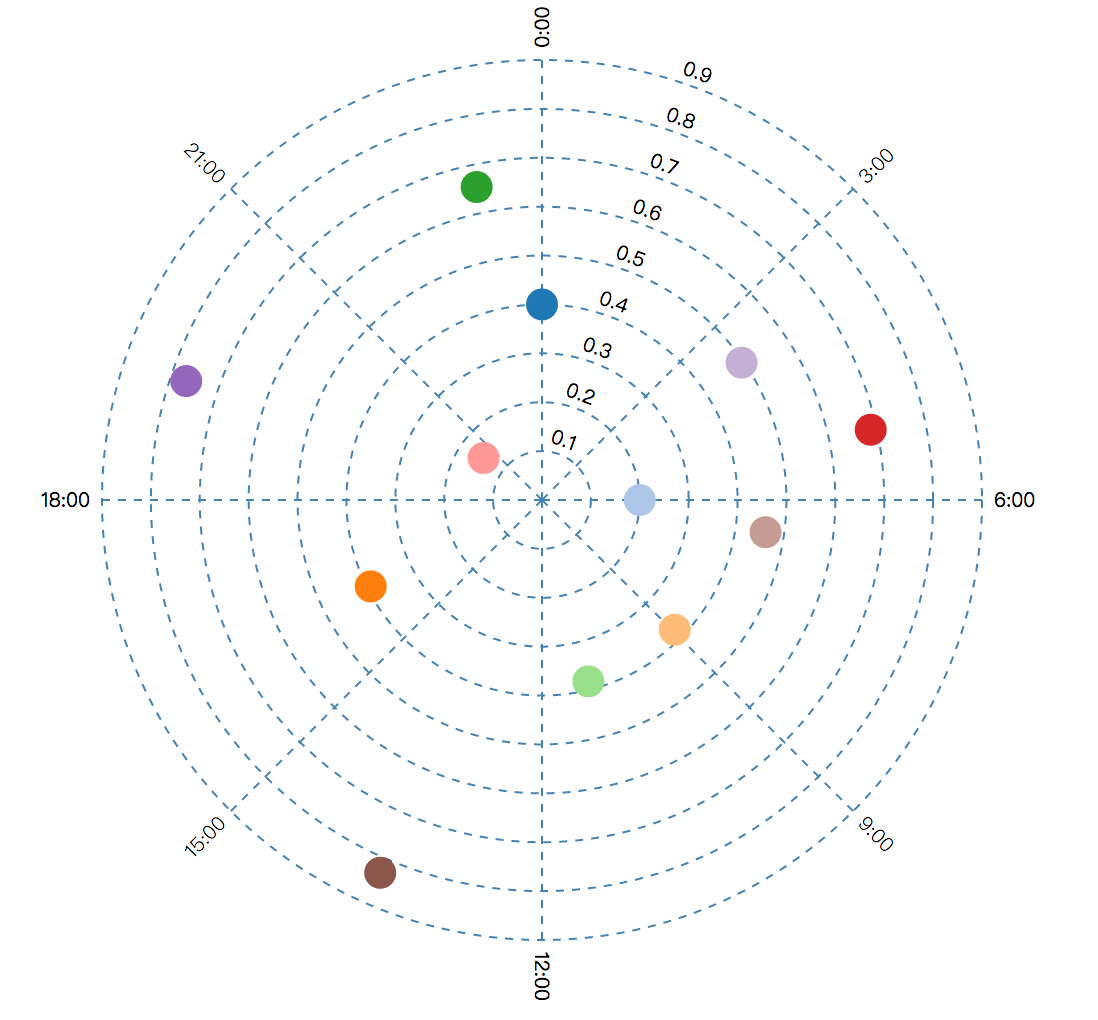
假设我们有如下数据集[ [10, 0.2], [6, 0.5], [23, 0.9],... ]。其中每个数据的一维表示时间(24小时制),二维表示信号强度。如[10, 0.2]表示十点的信号强度为0.2。现在,我们要将这些数据呈现在极坐标图(polar plot)上:

2.比例尺
我们发现,源数据的一维并不直接表示角度,二维也并不直接表示距离。那么我们需要用到比例尺。比例尺就是将某一区域的值映射到另一区域,其大小关系不变。
由于我们的区间都是连续的(连续的24小时映射到连续的360°,信号强度值映射到半径值),故这里我们用到的是线性比例尺。
 var angle = d3.scale.linear()

               .domain([0, 24])

               .range([0, 2 * Math.PI]);

 var r = d3.scale.linear()

           .domain([0, max_singnal])

           .range([0, radius]);
3.坐标系
为了清晰地呈现数据,绘制角度坐标轴(每45°画一条线)和半径坐标轴(半径每递增0.1画一个圆)。以及标上刻度。
// 角度坐标轴
 1     var ga = svg.append("g")

           .attr("class", "a axis")

           .selectAll("g")

           .data(d3.range(-90, 270, 45))

           .enter().append("g")

           .attr("transform", function(d) {

             return "rotate(" + d + ")";

         });

     ga.append("line")

         .attr("x2", radius);

     ga.append("text")

         .attr("x", radius + 6)

         .attr("dy", ".35em")

         .style("text-anchor", function(d) { return d < 270 && d > 90 ? "end" : null; })

         .attr("transform", function(d) {

             return d < 270 && d > 90 ? "rotate(180 " + (radius + 6) + ",0)" : null;

         })

         .text(function(d,i) { return i*3 + ":00" });
// 半径坐标轴
 1     var gr = svg.append("g")

           .attr("class", "r axis")

           .selectAll("g")

           .data(r.ticks(max_singnal*10).slice(1))

           .enter().append("g");

     gr.append("circle")

           .attr("r", r);

     gr.append("text")

         .attr("y", function(d) { return -r(d) - 4; })

         .attr("transform", "rotate(20)")

         .style("text-anchor", "middle")

         .text(function(d) { return d; });
4.绘制数据点
     var color = d3.scale.category20();

     var line = d3.svg.line.radial()

           .angle(function(d) {

             return angle(d[0]);

           })

           .radius(function(d) {

             return r(d[1]);

           });

     svg.selectAll("point")

           .data(data)

           .enter()

           .append("circle")

           .attr("class", "point")

           .attr("transform", function(d) {

             var coors = line([d]).slice(1).slice(0, -1);

             return "translate(" + coors + ")"

           })

           .attr("r", 8)

           .attr("fill",function(d,i){

             return color(i);

           });
5.完整代码
<!DOCTYPE html>

<meta charset="utf-8">

<style>

  .frame {

    fill: none;

    stroke: #000;

  }

  .axis text {

    font: 10px sans-serif;

  }

  .axis line,

  .axis circle {

    fill: none;

    stroke: steelblue;

    stroke-dasharray: 4;

  }

  .axis:last-of-type circle {

    stroke: steelblue;

    stroke-dasharray: none;

  }

  .line {

    fill: none;

    stroke: orange;

    stroke-width: 3px;

  }

</style>

<body>

  <script src="https://cdnjs.cloudflare.com/ajax/libs/d3/3.5.17/d3.min.js"></script>

  <script src="https://cdnjs.cloudflare.com/ajax/libs/underscore.js/1.8.3/underscore-min.js"></script>

  <script>

      var width = 960,

          height = 500,

          radius = Math.min(width, height) / 2 - 30;

    var data = [

      [0, 0.4],

      [6, 0.2],

      [Math.random()*24, Math.random()],

      [Math.random()*24, Math.random()],

      [Math.random()*24, Math.random()],

      [Math.random()*24, Math.random()],

      [Math.random()*24, Math.random()],

      [Math.random()*24, Math.random()],

      [Math.random()*24, Math.random()],

      [Math.random()*24, Math.random()],

      [Math.random()*24, Math.random()],

      [Math.random()*24, Math.random()],

    ]

    var y = _.map(data, _.last);

    var max =  Math.max.apply(null, y);

    max = Math.ceil(max*10)/10;

    var angle = d3.scale.linear()

        .domain([0, 24])

        .range([0, 2 * Math.PI]);

    var r = d3.scale.linear()

          .domain([0, max])

          .range([0, radius]);

    var svg = d3.select("body").append("svg")

          .attr("width", width)

          .attr("height", height)

          .append("g")

          .attr("transform", "translate(" + width / 2 + "," + height / 2 + ")");

    var gr = svg.append("g")

          .attr("class", "r axis")

          .selectAll("g")

          .data(r.ticks(max*10).slice(1))

          .enter().append("g");

    gr.append("circle")

          .attr("r", r);

    gr.append("text")

        .attr("y", function(d) { return -r(d) - 4; })

        .attr("transform", "rotate(20)")

        .style("text-anchor", "middle")

        .text(function(d) { return d; });

    var ga = svg.append("g")

          .attr("class", "a axis")

          .selectAll("g")

          .data(d3.range(-90, 270, 45))

          .enter().append("g")

          .attr("transform", function(d) {

            return "rotate(" + d + ")";

        });

    ga.append("line")

          .attr("x2", radius);

    ga.append("text")

        .attr("x", radius + 6)

        .attr("dy", ".35em")

        .style("text-anchor", function(d) { return d < 270 && d > 90 ? "end" : null; })

        .attr("transform", function(d) {

            return d < 270 && d > 90 ? "rotate(180 " + (radius + 6) + ",0)" : null;

        })

        .text(function(d,i) { return i*3 + ":00" });

    var color = d3.scale.category20();

    var line = d3.svg.line.radial()

          .angle(function(d) {

            return angle(d[0]);

          })

          .radius(function(d) {

            return r(d[1]);

          });

    svg.selectAll("point")

          .data(data)

          .enter()

          .append("circle")

          .attr("class", "point")

          .attr("transform", function(d) {

            var coors = line([d]).slice(1).slice(0, -1);

            return "translate(" + coors + ")"

          })

          .attr("r", 8)

          .attr("fill",function(d,i){

            return color(i);

          });

  </script>
d3.js 绘制极坐标图(polar plot)的更多相关文章
- 利用d3.js绘制雷达图
利用d3,js将数据可视化,能够做到数据与代码的分离.方便以后改动数据. 这次利用d3.js绘制了一个五维的雷达图.即将多个对象的五种属性在一张图上对照. 数据写入data.csv.数据类型写入typ ...
- [js]d3.js绘制拓扑树
echart也支持拓扑树了 所需的json数据格式: children嵌套 vis.js也支持绘制拓扑树 数据格式: nodes: {id, label, title} edges: {from, t ...
- 利用d3.js绘制中国地图
d3.js是一个比較强的数据可视化js工具. 利用它画了一幅中国地图,例如以下图所看到的: watermark/2/text/aHR0cDovL2Jsb2cuY3Nkbi5uZXQvc3ZhcDE=/ ...
- d3.js 绘制北京市地铁线路状况图(部分)
地铁线路图的可视化一直都是路网公司的重点,今天来和大家一起绘制线路图.先上图. 点击线路按钮,显示相应的线路.点击线路图下面的站间按钮(图上未显示),上报站间故障. 首先就是制作json文件,这个文件 ...
- D3.js绘制平行坐标图
参照:https://syntagmatic.github.io/parallel-coordinates/ 和 https://github.com/syntagmatic/parallel-coo ...
- D3.js绘制 颜色:RGB、HSL和插值 (V3版本)
颜色和插值 计算机中的颜色,常用的标准有RGB和HSL. RGB:色彩模式是通过对红(Red).绿(Green).蓝(Blue)三个颜色通道相互叠加来得到额各式各样的颜色.三个通道的值得范围都 ...
- D3.js (v3)+react框架 基础部分之认识选择集和如何绘制一个矢量图
首先需要下载安装d3.js : yarn add d3 然后在组建中引入 : import * as d3 from 'd3' 然后定义一个方法,在componentDidMount()这个钩子 ...
- 【 D3.js 进阶系列 — 4.0 】 绘制箭头
转自:http://www.ourd3js.com/wordpress/?p=660 [ D3.js 进阶系列 — 4.0 ] 绘制箭头 发表于2014/12/08 在 SVG 绘制区域中作图,在绘制 ...
- D3.js坐标轴的绘制方法、添加坐标轴的刻度和各比例尺的坐标轴(V3版本)
坐标轴(Axis) 坐标轴(Axis)在很多图表中都可见到,例如柱形图.折线图.散点图等.坐标轴由一组线段和文字组成,坐标轴上的点由一个坐标值确定.但是,如果使用SVG的直线和文字一笔一画的绘制坐 ...
随机推荐
- myeclipse的常用快捷键
创建一个类 Alt+Shift+N,C,输入Demo,回车 创建类属性 按3次下方向键,回车,输入String name;,回车 创建构造器 Alt+Shift+S,O,回车 创建getter/set ...
- C# 计算文件的HASH
/// <summary> /// 提供用于计算指定文件哈希值的方法 /// <example>例如计算文件的MD5值: /// <code> /// String ...
- MySQL常用命令(参考资料,部分改动)
一.连接MYSQL 格式: mysql -h主机地址 -u用户名 -p用户密码 . 连接到本机上的MYSQL. 首先打开DOS窗口,然后进入目录mysql\bin,再键入命令mysql -u root ...
- Struts2的那些小细节
1.result中传多个参数,&不允许使用需要转义&即多个参数之间用&隔开 <result type="redirectAction">show ...
- 《C++ Primer》 chapter 15 TextQuery
<C++ Primer>中第15章为了讲解面向对象编程,举了一个例子:设计一个小程序,能够处理查询给定word在文件中所在行的任务,并且能够处理“非”查询,“或”查询,“与”查询.例如执行 ...
- js正则表达式验证
有时候会要验证自己写的正则表达式是否正确 所以写了这个小东西: demo:js正则表达式验证 html: <h3>绿色表示匹配,红色表示不匹配</h3> <label&g ...
- 让win7安装时出现版本选项
win7有几种版本,win7旗舰版包含各大版本,修改一下ISO,让安装时出现版本选项窗口: 1.准备好一个官方win7旗舰版安装包IOS光盘镜像. 2.用UltraISO打开光盘镜像并删除source ...
- 1.4. 为现有的应用程序添加 Core Data 支持(Core Data 应用程序实践指南)
项目创建时会有 “Use Core Data" ,但是,有时没有勾选这个选项,那么就要手动链接Core Data Framework. 选中 Grocery Dude Target Gene ...
- 2.13.1. 对结果排序(Core Data 应用程序实践指南)
传递NSSortDescriptor给NSFetchRequest进行排序.示例如下,修改demo方法: NSSortDescriptor *sort = [NSSortDescriptor sort ...
- jQuery按键事件响应的Demo
<!DOCTYPE html><html lang="en"><head> <meta charset="UTF-8&qu ...
