Pthon Matplotlib 画图
一、普通绘图
 import matplotlib.pyplot as plt

 import numpy as np

 # 绘制普通图像

 x = np.linspace(-1, 1, 50)

 y1 = 2 * x + 1

 y2 = x**2

 plt.figure()

 # 在绘制时设置lable, 逗号是必须的

 l1, = plt.plot(x, y1, label = 'line')

 l2, = plt.plot(x, y2, label = 'parabola', color = 'red', linewidth = 1.0, linestyle = '--')

 # 设置坐标轴的取值范围

 plt.xlim((-1, 1))

 plt.ylim((0, 2))

 # 设置坐标轴的lable

 plt.xlabel('X axis')

 plt.ylabel('Y axis')

 # 设置x坐标轴刻度, 原来为0.25, 修改后为0.5

 plt.xticks(np.linspace(-1, 1, 5))

 # 设置y坐标轴刻度及标签, $$是设置字体

 plt.yticks([0, 0.5], ['$minimum$', 'normal'])

 # 设置legend

 plt.legend(handles = [l1, l2,], labels = ['a', 'b'], loc = 'best')

 plt.show()
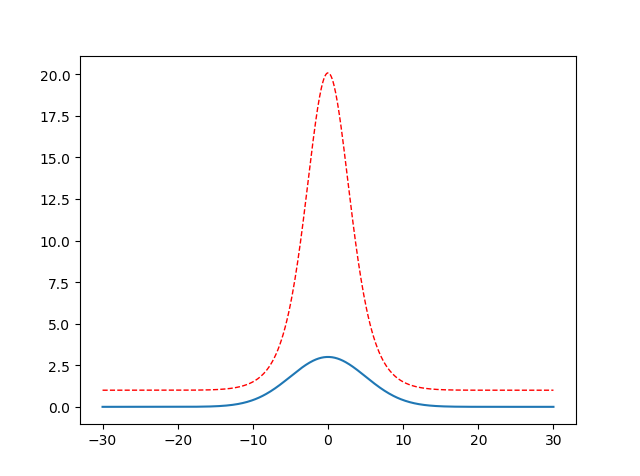
二、自定义单峰函数
 import math

 import numpy as np

 import matplotlib.pyplot as plt

 x = np.linspace(-30, 30, 500)

 y = []

 y2 = []

 a = 3

 b = 0

 c = 25

 for i in x :

     # 类似高斯函数,a 代表峰值, b对称轴位置,c方差

     temp = a * math.exp(-(i-b)**2 / (2 * c))

     y.append(temp)

     #对上一个单峰函数值进行放大处理,红色虚线部分

     y2.append(math.exp(temp))

 plt.figure()

 l1= plt.plot(x, y, label = 'line')

 l2, = plt.plot(x, y2, label = 'parabola', color = 'red', linewidth = 1.0, linestyle = '--')

 plt.show()
三、画subplot子图(2 x 2 为例)
     import matplotlib.pyplot as plt

     t=np.arange(0.0,2.0,0.1)

     s=np.sin(t*np.pi)

     plt.subplot(2,2,1) #要生成两行两列,这是第一个图plt.subplot('行','列','编号')

     plt.plot(t,s,'b--')

     plt.ylabel('y1')

     plt.subplot(2,2,2) #两行两列,这是第二个图

     plt.plot(2*t,s,'r--')

     plt.ylabel('y2')

     plt.subplot(2,2,3)#两行两列,这是第三个图

     plt.plot(3*t,s,'m--')

     plt.subplot(2,2,4)#两行两列,这是第四个图

     plt.plot(4*t,s,'k--')

     plt.show()

点图和线图
fig = plt.figure()

ax = fig.add_subplot(221, projection='3d')

ax.plot(array_normal[:,0],array_normal[:,1],array_normal[:,2])

plt.subplot(2,2,2)

plt.plot(np.arange(0,sample_len,1), signal_normal)

normal_pow = array_normal[:,2]

ax3 = fig.add_subplot(223, projection='3d')

ax3.plot(array_anomaly[:,0],array_anomaly[:,1],array_anomaly[:,2])

anomaly_pow = array_anomaly[:,2]

plt.subplot(2,2,4)

plt.scatter(np.arange(0,sample_len,1), signal_anomaly)

plt.show()

【Reference】
[1] https://www.jianshu.com/p/de223a79217a
[2] https://www.cnblogs.com/xingshansi/p/6777945.html
Pthon Matplotlib 画图的更多相关文章
- python matplotlib画图产生的Type 3 fonts字体没有嵌入问题
ScholarOne's 对python matplotlib画图产生的Type 3 fonts字体不兼容,更改措施: 在程序中添加如下语句 import matplotlib matplotlib. ...
- 使用python中的matplotlib 画图,show后关闭窗口,继续运行命令
使用python中的matplotlib 画图,show后关闭窗口,继续运行命令 在用python中的matplotlib 画图时,show()函数总是要放在最后,且它阻止命令继续往下运行,直到1.0 ...
- matplotlib 画图
matplotlib 画图 1. 画曲线图 Tompson = np.array([0, 0, 0, 0, 0.011, 0.051, 0.15, 0.251, 0.35, 0.44, 0 ...
- matplotlib画图
matplotlib画图 import numpy as np import matplotlib.pyplot as plt x1=[20,33,51,79,101,121,132,145,162, ...
- python3 使用matplotlib画图出现中文乱码的情况
python3使用matplotlib画图,因python3默认使用中unicode编码,所以在写代码时不再需要写 plt.xlabel(u’人数’),而是直接写plt.xlabel(‘人数’). 注 ...
- matplotlib画图实例:pyplot、pylab模块及作图參数
http://blog.csdn.net/pipisorry/article/details/40005163 Matplotlib.pyplot画图实例 {使用pyplot模块} matplotli ...
- python使用matplotlib画图
python使用matplotlib画图 matplotlib库是python最著名的画图库.它提供了一整套和matlab类似的命令API.十分适合交互式地进行制图. 先介绍了怎样使用matplotl ...
- matplotlib画图报错This figure includes Axes that are not compatible with tight_layout, so results might be incorrect.
之前用以下代码将实验结果用matplotlib show出来 plt.plot(np.arange(len(aver_reward_list)), aver_reward_list) plt.ylab ...
- matplotlib画图出现乱码情况
python3使用matplotlib画图,因python3默认使用中unicode编码,所以在写代码时不再需要写 plt.xlabel(u’人数’),而是直接写plt.xlabel(‘人数’). 注 ...
随机推荐
- linux 监控工具netdata
1. 背景 工作的关系,需要使用netdata将服务器信息实时.动态展示. 调研了netdata工具,记录一下,方便后续使用. 2. netdata介绍 2.1 netdata 能做什么? 可以参考: ...
- wxParse解析富文本内容使点击图片可以选中并实现放大缩小
wxParse解析富文本内容不多说,之前写过步骤介绍,主要是在使用过程中发现解析的富文本内容里有图片时有的可以点击放大缩小,有的点击却报错,找不到imgUrls. 经过排查发现:循环解析的富文本内容正 ...
- Java字符串转16 进制工具类Hex.java
Java字符串转16 进制工具类Hex.java 学习了:https://blog.csdn.net/jia635/article/details/56678086 package com.strin ...
- 从n个元素中选择k个的所有组合(包含重复元素)
LeetCode:Combinations这篇博客中给出了不包含重复元素求组合的5种解法.我们在这些解法的基础上修改以支持包含重复元素的情况.对于这种情况,首先肯定要对数组排序,以下不再强调 修改算法 ...
- 【PMP】组织级项目管理(OPM)和战略
OPM指为实现组织战略目标而整合项目组合.项目集和项目管理与组织驱动因素的框架. OPM旨在确保组织开展正确的项目并合适地分配关键资源. 组织项目管理 此图来源于PMBOK第六版
- 关于input时间框设置了弹出选择就不能手动输入的控制
<input class="Wdate" onclick="WdatePicker({minDate:'#F{$dp.$D(\'startDate\');}',ma ...
- 【Babble】批量学习与增量学习、稳定性与可塑性矛盾的乱想
一.开场白 做机器学习的对这几个词应该比较熟悉了. 最好是拿到全部数据,那就模型慢慢选,参数慢慢调,一轮一轮迭代,总能取得不错效果. 但是面对新来数据,怎么能利用已经训练好的模型,把新的信息加进去? ...
- Java 汇编代码
https://shipilev.net/blog/2015/black-magic-method-dispatch/ https://github.com/shipilev/article-meth ...
- 模仿jQuery的ajax的封装
/* * 我们使用了ajax 的xmlHttpRequest 跟服务器进行交互. * * 交互了有四个基本步骤 * 1:创建对象 * 2:建立连接 * 3:发送请求 * 4:接收数据 * * 这些操作 ...
- ArcGIS Runtime SDK for iOS开发地图图层-图形图层
注:本文翻译自:https://developers.arcgis.com/ios/objective-c/guide/creating-a-graphics-layer.htm 创建图 ...