Highcharts图表库
Highcharts图表库
1、相关网址:
1)官方主页:https://www.hcharts.cn/
2)Highcharts演示:https://www.hcharts.cn/demo/highcharts
3)下载中心:https://www.hcharts.cn/download
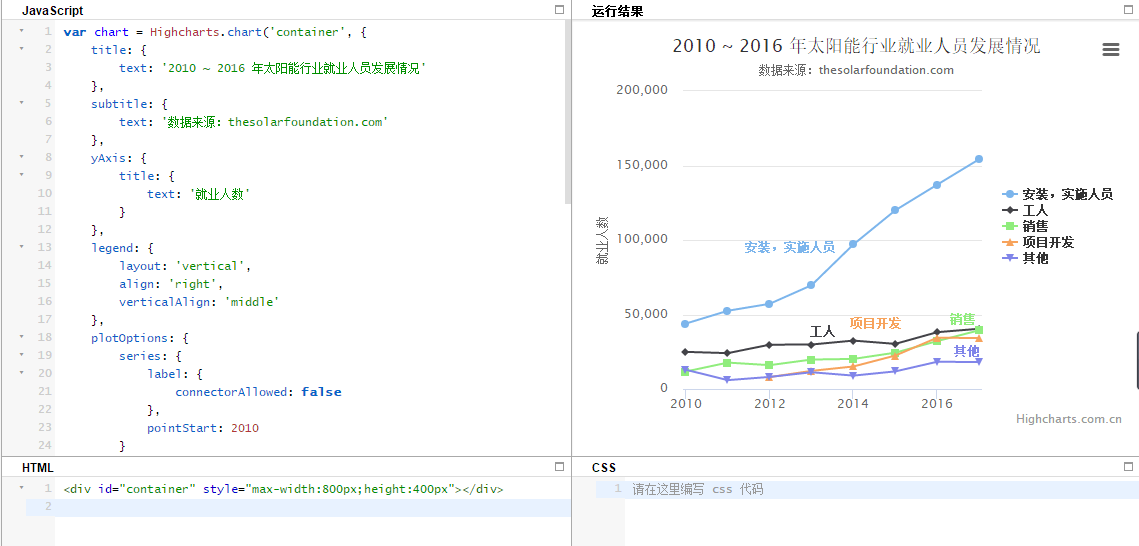
2、查看源代码
1)在图表演示页面找到需要的图表点击进入具体演示图
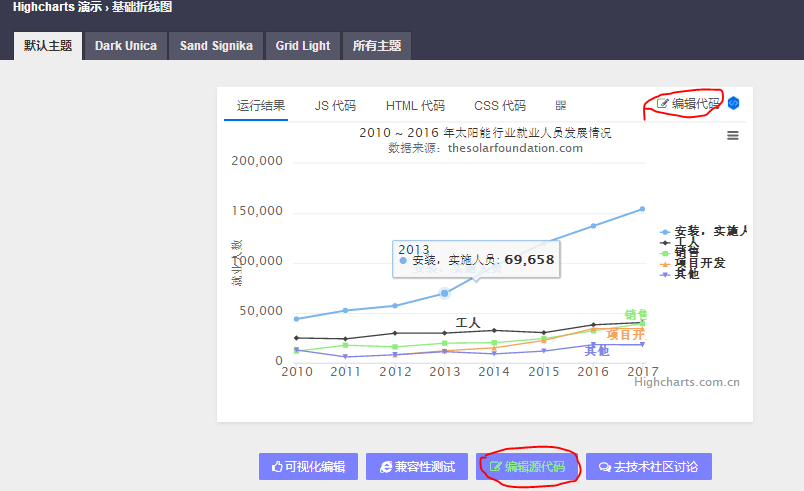
2)将代码中的数据改为需要的数据代码可以直接使用
3、使用实例
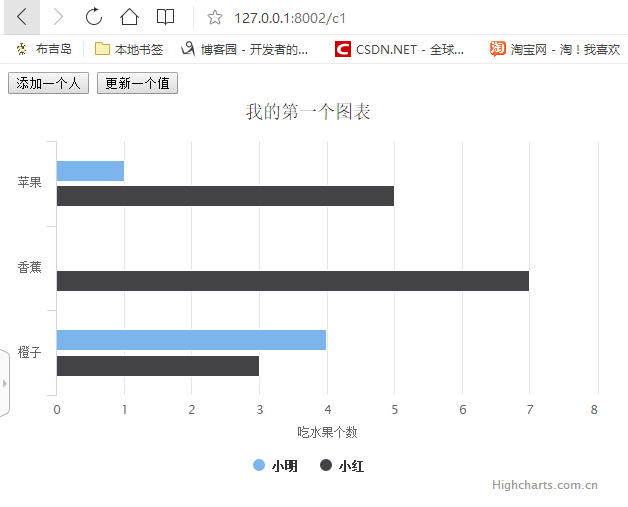
1)条形图
<!DOCTYPE html>

<html lang="en">

<head>

    <meta charset="UTF-8">

    <title>Title</title>

</head>

<body>

<input type="button" onclick="addSeries()" value="添加一个人">

<input type="button" onclick="updateItem()" value="更新一个值">

<div id="container" style="width: 600px;height:400px;"></div>

<script src="/static/js/highcharts.js"></script>

<script src="/static/js/highcharts-zh_CN.js"></script>

<script>

    var options = {

        chart: {

            type: 'bar'                          //指定图表的类型,默认是折线图(line)

        },

        title: {

            text: '我的第一个图表'                 // 标题

        },

        xAxis: {

            categories: ['苹果', '香蕉', '橙子']   // x 轴分类

        },

        yAxis: {

            title: {

                text: '吃水果个数'                // y 轴标题

            }

        },

        series: [{                              // 数据列

            name: '小明',                        // 数据列名

            data: [1, 0, 4]                     // 数据

        }, {

            name: '小红',

            data: [5, 7, 3]

        }]

    };

    // 图表初始化函数

    var chart = Highcharts.chart('container', options);

    function addSeries() {

        chart.addSeries({name: '小刘', data: [30.4, 10.1, 9]});

    }

    function updateItem() {

        chart.series[0].data[0].update(6);

    }

</script>

</body>

</html>
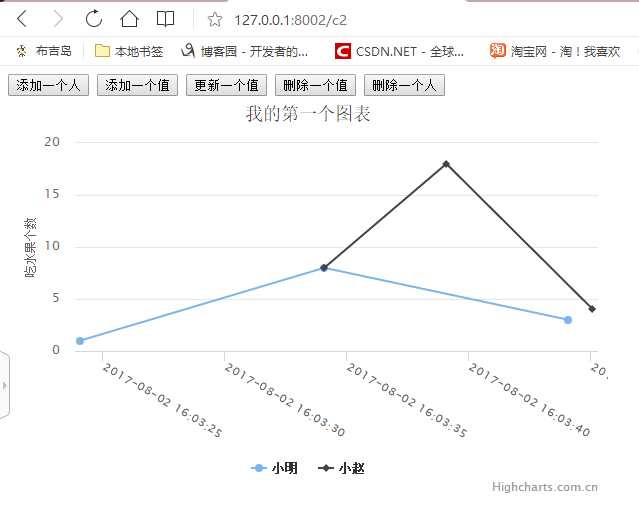
2)折线图
<!DOCTYPE html>

<html lang="en">

<head>

    <meta charset="UTF-8">

    <title>Title</title>

</head>

<body>

<input type="button" onclick="addSeries()" value="添加一个人">

<input type="button" onclick="addItem()" value="添加一个值">

<input type="button" onclick="updateItem()" value="更新一个值">

<input type="button" onclick="delItem()" value="删除一个值">

<input type="button" onclick="delSeries()" value="删除一个人">

<div id="container" style="width: 600px;height:400px;"></div>

<script src="/static/js/highcharts.js"></script>

<script src="/static/js/highcharts-zh_CN.js"></script>

<script>

    var options = {

        title: {

            text: '我的第一个图表'                 // 标题

        },

        xAxis: {

            type: 'datetime',

            labels: {

                formatter: function () {

                    return Highcharts.dateFormat('%Y-%m-%d %H:%M:%S', this.value);

                },

                rotation: 30

            }

        },

        yAxis: {

            title: {

                text: '吃水果个数'                // y 轴标题

            }

        },

        series: [{                              // 数据列

            name: '小明',                        // 数据列名

            data: [

                [1501689804077.358, 1.0],

                [1501689814077.358, 8.0],

                [1501689824077.358, 3.0]

            ]                     // 数据

        },

            {

                name: '小赵',

                data: [

                    [1501689814077.358, 8.0],

                    [1501689819077.358, 18.0],

                    [1501689825077.358, 4.0]

                ]                     // 数据

            }

        ]

    };

    // 图表初始化函数

    var chart = Highcharts.chart('container', options);

    function addSeries() {

        chart.addSeries({

            name: '小刘', data: [

                [1501689814077.358, 18.0],

                [1501689819077.358, 8.0],

                [1501689825077.358, 3.0]

            ]

        });

    }

    function updateItem() {

        //$('#id1').highcharts()

        chart.series[0].data[0].update(66);

    }

    function addItem() {

        chart.series[0].addPoint([1501689825077, 18]);

    }

    function delItem() {

        chart.series[0].data[1].remove();

    }

    function delSeries() {

        chart.series[0].remove(false);

    }

</script>

</body>

</html>
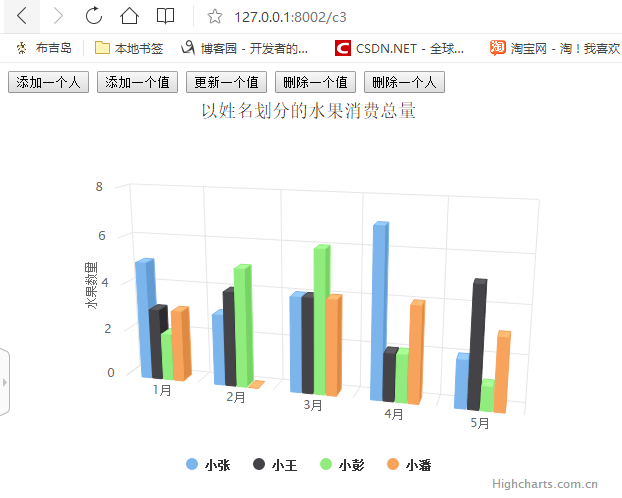
3)3d柱状图
<!DOCTYPE html>

<html lang="en">

<head>

    <meta charset="UTF-8">

    <title>Title</title>

</head>

<body>

<input type="button" onclick="addSeries()" value="添加一个人">

<input type="button" onclick="addItem()" value="添加一个值">

<input type="button" onclick="updateItem()" value="更新一个值">

<input type="button" onclick="delItem()" value="删除一个值">

<input type="button" onclick="delSeries()" value="删除一个人">

<div id="container" style="width: 600px;height:400px;"></div>

<script src="/static/js/highcharts.js"></script>

<script src="/static/js/highcharts-3d.js"></script>

<script src="/static/js/highcharts-zh_CN.js"></script>

<script>

    var options = {

        chart: {

            type: 'column',

            options3d: {

                enabled: true,

                alpha: 15,

                beta: 15,

                viewDistance: 25,

                depth: 40

            },

            marginTop: 80,

            marginRight: 40

        },

        title: {

            text: '以姓名划分的水果消费总量'

        },

        xAxis: {

            categories: ['1月', '2月', '3月', '4月', '5月', '6月']

        },

        yAxis: {

            allowDecimals: false,

            min: 0,

            title: {

                text: '水果数量'

            }

        },

        tooltip: {

            headerFormat: '<b>{point.key}</b><br>',

            pointFormat: '<span style="color:{series.color}">\u25CF</span> {series.name}: {point.y} '

        },

        plotOptions: {

            column: {

                //stacking: 'normal',

                //depth: 40

            }

        },

        series: [{

            name: '小张',

            data: [5, 3, 4, 7, 2]

        }, {

            name: '小王',

            data: [3, 4, 4, 2, 5]

        }, {

            name: '小彭',

            data: [2, 5, 6, 2, 1]

        }, {

            name: '小潘',

            data: [3, 0, 4, 4, 3]

        }]

    };

    // 图表初始化函数

    var chart = Highcharts.chart('container', options);

    function addSeries() {

        chart.addSeries({

            name: '小刘', data: [5, 3, 4, 7, 2]

        });

    }

    function updateItem() {

        //$('#id1').highcharts()

        chart.series[0].data[0].update(18);

    }

    function addItem() {

        chart.series[0].addPoint(18);

    }

    function delItem() {

        chart.series[0].data[1].remove();

    }

    function delSeries() {

        chart.series[0].remove(false);

    }

</script>

</body>

</html>
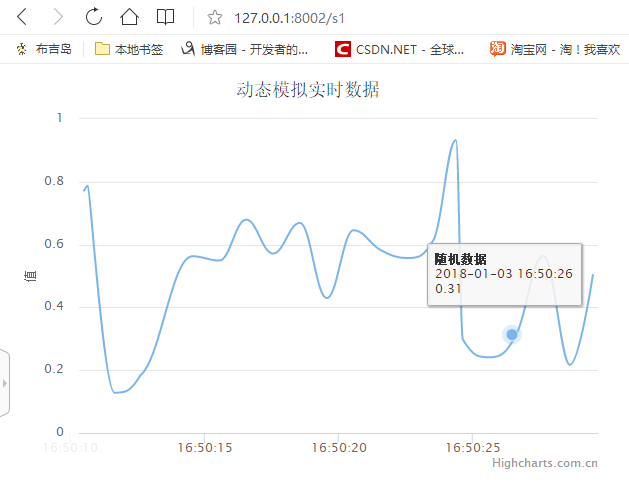
4)实时刷新曲线图
<!DOCTYPE html>

<html lang="en">

<head>

    <meta charset="UTF-8">

    <title>Title</title>

</head>

<body>

<div id="container" style="width: 600px;height:400px;"></div>

<script src="https://code.jquery.com/jquery-3.1.1.min.js"></script>

<script src="/static/js/highstock.js"></script>

<script src="/static/js/highcharts-zh_CN.js"></script>

<script>

    Highcharts.setOptions({

        global: {

            useUTC: false

        }

    });

    function activeLastPointToolip(chart) {

        var points = chart.series[0].points;

        chart.tooltip.refresh(points[points.length -1]);

    }

    $('#container').highcharts({

        chart: {

            type: 'spline',

            animation: Highcharts.svg, // don't animate in old IE

            marginRight: 10,

            events: {

                load: function () {

                    // set up the updating of the chart each second

                    var series = this.series[0],

                        chart = this;

                    setInterval(function () {

                        var x = (new Date()).getTime(), // current time

                            y = Math.random();

                        series.addPoint([x, y], true, true);

                        activeLastPointToolip(chart)

                    }, 1000);

                }

            }

        },

        title: {

            text: '动态模拟实时数据'

        },

        xAxis: {

            type: 'datetime',

            tickPixelInterval: 150

        },

        yAxis: {

            title: {

                text: '值'

            },

            plotLines: [{

                value: 0,

                width: 1,

                color: '#808080'

            }]

        },

        tooltip: {

            formatter: function () {

                return '<b>' + this.series.name + '</b><br/>' +

                    Highcharts.dateFormat('%Y-%m-%d %H:%M:%S', this.x) + '<br/>' +

                    Highcharts.numberFormat(this.y, 2);

            }

        },

        legend: {

            enabled: false

        },

        exporting: {

            enabled: false

        },

        series: [{

            name: '随机数据',

            data: (function () {

                // generate an array of random data

                var data = [],

                    time = (new Date()).getTime(),

                    i;

                for (i = -19; i <= 0; i += 1) {

                    data.push({

                        x: time + i * 1000,

                        y: Math.random()

                    });

                }

                return data;

            }())

        }]

    }, function(c) {

        activeLastPointToolip(c)

    });

</script>

</body>

</html>
Highcharts图表库的更多相关文章
- highcharts 图表库的简单使用
Highcharts简介: Highcharts是一款纯javascript编写的图表库,能够很简单便捷的在Web网站或Web应用中添加交互性的图表,Highcharts目前支持直线图.曲线图.面积图 ...
- highCharts入门-强大的图表库插件
简介 Highcharts 是一个用纯JavaScript编写的一个图表库, 能够很简单便捷的在web网站或是web应用程序添加有交互性的图表,并且免费提供给个人学习.个人网站和非商业 ...
- Highcharts纯js图表库,以后可以跟客户说,你跟阿里云ECS用的图表库是同款
Highcharts是一款纯javascript编写的图表库,能够很简便的在Web网站或Web应用中添加交互性的图表,Highcharts目前支持直线图.曲线图.面积图.柱状图.饼图.散点图等多达18 ...
- 关于highcharts(功能强大、开源、美观、图表丰富、兼容绝大多数浏览器的纯js图表库)
官网http://www.hcharts.cn/ 引入下列文件 <script type="text/javascript" src="http://cdn.hch ...
- 在AngularJS中的使用Highcharts图表控件
一.Highcharts简介 Highcharts是一款非常好用的前端图表控件,正如其中文网介绍的那样:功能强大.开源.美观.图表丰富.兼容绝大多数浏览器的纯js图表库. 如果你的项目是基于jquer ...
- 11个很棒的 jQuery 图表库
如果你曾经使用过任何类型的数据,你应该知道阅读一排排数据的痛苦.通过所有这些数据弄清楚他们的意思是非常不容易的.可视化对于解决这个问题起到了重要的作用.可视化降低了数据阅读的难度,帮助决策者获得可操作 ...
- 转:Highcharts图表控件的使用
摘要 Highcharts图表控件是目前使用最为广泛的图表控件.本文将从零开始逐步为你介绍Highcharts图表控件.通过本文,你将学会如何配置Highcharts以及动态生成Highchart图表 ...
- highCharts图表应用-实现多种图表的显示
在数据统计和分析业务中,有时需要在一个图表中将柱状图.饼状图.曲线图的都体现出来,即可以从柱状图中看出具体数据.又能从曲线图中看出变化趋势,还能从饼状图中看出各部分数据比重.highCharts可以轻 ...
- highCharts图表入门简介
一.Highcharts简介 Highcharts:功能强大.开源.美观.图表丰富.兼容绝大多数浏览器的纯js图表库 Highcharts是一款纯javascript编写的图表库,能够很简单便捷的在W ...
随机推荐
- [BUG]Uncaught TypeError: Illegal invocation at HTMLDivElement.
<div id="clickMe" key="1">点我</div> clickMe.onclick = function (event ...
- CUDA Pro Tip: Write Flexible Kernels with Grid-Stride Loops
https://devblogs.nvidia.com/cuda-pro-tip-write-flexible-kernels-grid-stride-loops/ One of the most c ...
- pc 媒体查询
PC端 按屏幕宽度大小排序(主流的用橙色标明) 分辨率 比例 | 设备尺寸 1024*500 (8.9寸) 1024*768 (比例4:3 | 10.4寸.12.1寸.14.1寸.15寸; ) ...
- 最简易 Pair of Topics解决方法
这个题花费了我两天的时间来解决,最终找到了两个比较简单的方法 首先这个题不难看出是寻找a[i]+a[j]<0的情况,我第一开始直接用两个for循环遍历通过不了,应该是复杂度太大了 第一个方法 # ...
- php解析配置文件
php解析配置文件 标签(空格分隔): php .ini格式 RNN和双向RNN讲解及实践
欢迎大家关注我们的网站和系列教程:http://www.tensorflownews.com/,学习更多的机器学习.深度学习的知识! 笔者:Ray 介绍 通过对前面文章的学习,对深度神经网络(DNN) ...
- 50行代码实现GAN | 干货演练
2014年,Ian Goodfellow和他的同事发表了一篇论文,向世界介绍了生成对抗网络(GAN).通过对计算图和博弈论的创新性组合,他们表明如果有足够的建模能力,两个相互对抗的模型可以通过普通的反 ...
- Python第七章-面向对象高级
面向对象高级 一. 特性 特性是指的property. property这个词的翻译一直都有问题, 很多人把它翻译为属性, 其实是不恰当和不准确的. 在这里翻译成特性是为了和属性区别开来. 属性是指的 ...