echarts系列之动态加载数据
1.echarts学习前言
最近接触到echarts,发现数据可视化真的是魅力无穷啊,各种变幻的曲线交错,以及‘曼妙’的动画效果真是让人如痴如醉!
下面就来一起欣赏她的美...
“ ECharts是中国的,也是世界的。”
—— 浙江大学教授 · 陈为
“ ECharts,发现数据可视化之美!”
——中国传媒大学教授 · 沈浩
大数据时代
重新定义数据图表的时候到了......
2.echarts的demo代码
需求:ajax请求到json格式数据,动态添加到曲线和表格中
jquery:1.8.3版本
bootstrap:2.3.2版本
用代码说话是我们的游戏规则(吼吼):
echarts/qiyue.html 中 qiyue.html文件:
<html>

    <head>

        <title>*echarts*</title>

        <meta charset="utf-8"/>

        <link rel="stylesheet" type="text/css" href="css/bootstrap.min.css"/>

        <script src="js/jquery-1.8.3.min.js"></script>

        <script src="js/bootstrap.min.js"></script>

        <script src="js/echarts.js"></script>

        <style type="text/css">

            *{

                font-family: "微软雅黑";

            }

            .count-title{

                padding-bottom: 15px;

                margin-bottom: 20px;

                border-bottom: 1px solid #ccc;

            }

            #main{

                width: 100%;

                height: 500px;

                margin: 0 auto;

            }

            .total-incre{

                padding-left: 147px;

                margin-top: 5px;

                position: absolute;

            }

            .total-incre strong{

                color: #e5903a;

            }

            .chooseTime{

                position: absolute;

                right: 100px;

                top:18px;

            }

            .table td,.table th{

                text-align: center;

            }

            .agencyNew{

                width: 90%;

            }

        </style>

    </head>

    <body>

        <div class="container agencyNew">

            <div class="row">

                <!-- Split button -->

                <h1 class="count-title">XX销售情况</h1>

                <p class="total-incre">

                    合计:<strong class="total">888</strong> | 新增 :<strong class="increase">88</strong>

                </p>

                <!--下拉框-->

                <div class="dropdown chooseTime">

                  <a class="btn btn-default dropdown-toggle" role="button" data-toggle="dropdown" data-target="#" >

                        最近一个月

                    <b class="caret"></b>

                  </a>

                  <ul class="dropdown-menu" role="menu" aria-labelledby="dLabel">

                        <li><a href="#">最近一个月</a></li>

                        <li role="separator" class="divider"></li>

                        <li><a href="#">2017年2月</a></li>

                        <li><a href="#">2017年1月</a></li>

                  </ul>

                </div>

                <!--echarts曲线容器-->

                <div id="main">

                </div>

                <!--表格-->

                <table class="table table-bordered table-striped table-hover">

                    <thead>

                        <!--动态获取表头-->

                    </thead>

                    <tbody>

                        <!--动态获取表格-->

                    </tbody>

                </table>

            </div>

        </div>

    </body>

    <script src="http://echarts.baidu.com/build/dist/echarts.js"></script>

    <script src="js/qiyue.js"></script>

</html>
echarts/js/qiyue.js 中 qiyue.js文件:
var myChart,option;

$(function(){

        require.config({

            paths: {

                'echarts': 'http://echarts.baidu.com/build/dist'

            }

        });

        require(

            [

                'echarts',

                'echarts/chart/line',   // 按需加载所需图表,如需动态类型切换功能,别忘了同时加载相应图表

                'echarts/chart/bar'

            ],

            function (ec) {

                myChart = ec.init(document.getElementById('main'));

                option  = {

                   title: {

                        text: 'XX销售情况',

                        subtext: ''

                    },

                    tooltip: {

                        trigger: 'axis'

                    },

                    legend: {

                        data: []

                    },

                    toolbox: {

                         show : true,

                        feature : {

                            mark : {show: true},

                            dataView : {show: true, readOnly: false},

                            magicType : {show: true, type: ['line', 'bar', 'stack', 'tiled']},

                            restore : {show: true},

                            saveAsImage : {show: true}

                        }

                    },

                    xAxis: [

                         {

                                type : 'category',

                                boundaryGap : false,

                                data : [ ]

                                ,

                                axisLabel: {

                                    interval:0,//横轴信息全部显示

                                    rotate: 30,//60度角倾斜显示

                                    formatter:function(val){

//                                        return val.split("").join("\n"); //横轴信息文字竖直显示

                                        return val;

                                    },

                                    textStyle: {

                                        color: '#000',

                                        align: 'center',

                                        fontWeight: 'bold'

                                    }

                                }

                           }

                    ],

                    yAxis: [],

                    series: []

                };

//                myChart = require('echarts').init(document.getElementById('main'));

                myChart.showLoading({

//                    text : '数据获取中',

                    effect: 'whirling'

                });

                getData();

           });

});

//请求json

var fields,

     itemsMap,

     seriesItem,

    yAxis_arr = [],

    thead     = '',

     tbody     = '',

    tbody_tr  = '';

        function getData(){

            $.ajax({

                url      : 'data0.json',

                dataType : 'json',

                async    : false,

                type     : 'get',

                success  : function(json){

//                    console.log(json.data);

                    console.log(option);

                    fields   = json.data.fields;

                    itemsMap = json.data.itemsMap;

                    createEcharts();//动态创建曲线图

                    createTab();//动态创建表格

                    myChart.hideLoading();

                    myChart.setOption(option);

                },

                error : function(XMLHttpRequest, textStatus, errorThrown){

                    if(textStatus == 'parsererror'){

                        alert('数据为空或者SQL语句错误!');

                    }

                    console.log(errorThrown);

                }

            });

        }

/*

 * 动态创建曲线图

 */

function createEcharts(){

    //    series

    for(var i=1; i<fields.length; i++){

        if(i==1){

            itemStyle = {

                    normal: {

                        areaStyle: {

                            type: 'default'

                        }

                    }

            };

        }else{

            itemStyle = {

                    normal: {

                        color: '#70bf41'

                    }

            };

        }

        option.legend.data.push(fields[i]);  //    legend

        seriesItem              = {};

        seriesItem.name      = fields[i];

        seriesItem.type      = 'line';

        seriesItem.smooth    = false;

        seriesItem.yAxisIndex= i-1;

        seriesItem.itemStyle = itemStyle;

        seriesItem.data      = [];

        for(var key in itemsMap){

            seriesItem.data.push(itemsMap[key][i]);

        }

//        填充默认显示曲线的数据

        option.series.push(seriesItem);

//        option.series[0].type      = 'line';

//        option.series[1].type      = 'bar';

        // yAxis

        var yAxis_obj  = {};

        yAxis_obj.type = 'value';

        yAxis_obj.name = fields[i];

        yAxis_obj.show = true;

        yAxis_arr.push(yAxis_obj);

    }

        option.yAxis = yAxis_arr;

        console.log(yAxis_arr);

}

/*

 * 动态创建表格

 */

function createTab(){

    //动态创建表头

    for(var i=0; i<fields.length; i++){

        thead += '<th>'+fields[i]+'</th>';

        $('.table thead').html('<tr>'+thead+'</tr>');

    }

    for(var j in itemsMap){

        var tbody_td = '';

        option.xAxis[0].data.push(itemsMap[j][0]); // XAxis

        for(var k=0; k<itemsMap[j].length; k++){

              tbody_td += '<td>'+itemsMap[j][k]+'</td>';

        }

//        console.log(tbody_td);

        tbody_tr += '<tr>'+tbody_td+'</tr>';

    }

    $('.table tbody').html(tbody_tr);

}
echarts/data0.json 中data0.json文件:
{

    "data": {

        "itemsMap": {

            "1": ["2017-03-1", "3", "8"],

            "2": ["2017-03-2", "18", "20"],

            "3": ["2017-03-3", "43", "54"],

            "4": ["2017-03-4", "50", "74"],

            "5": ["2017-03-5", "39", "41"],

            "6": ["2017-03-6", "20", "52"],

            "7": ["2017-03-7", "21", "25"],

            "8": ["2017-03-8", "16", "26"],

            "9": ["2017-03-9", "10", "11"],

            "10": ["2017-03-10", "8", "10"]

        },

        "fields": ["日期", "预购", "成交"],

        "status": 1

    }

}
3.运行结果展示
由于鹅的博客还没有直接运行功能,为了浏览方便我就把效果图贴上吧(= =)
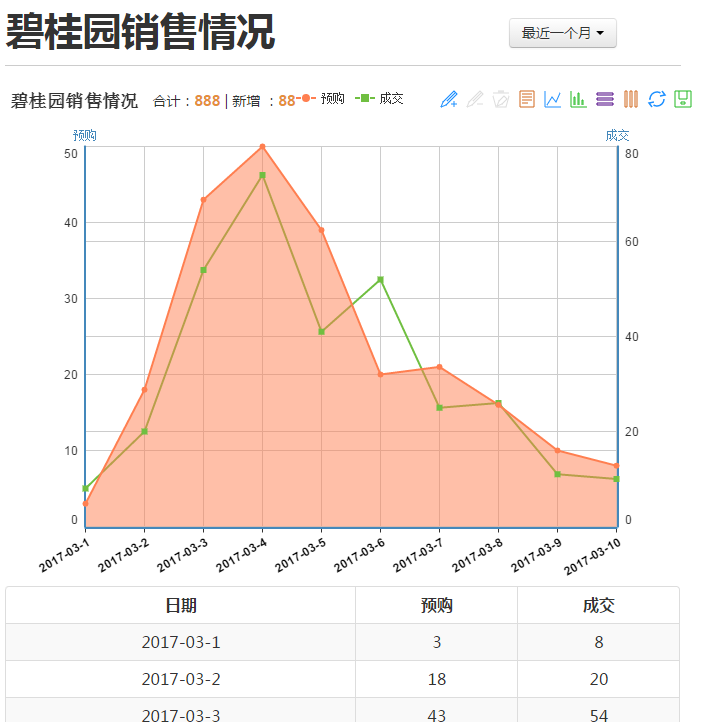
tips:所有数据纯属虚构哦。
源代码在github上提供https://github.com/yingliyu/commonDemo.git
echarts系列之动态加载数据的更多相关文章
- echarts官网上的动态加载数据bug被我解决。咳咳/。
又是昨天,为什么昨天发生了这么多事.没办法,谁让我今天没事可做呢. 昨天需求是动态加载数据,画一个实时监控的折线图.大概长这样. 我屁颠屁颠的把代码copy过来,一运行,caocaocao~bug出现 ...
- Echarts使用及动态加载图表数据
Echarts使用及动态加载图表数据 官网:http://echarts.baidu.com/ 1.文档 2.实例 名词: 1.统计维度(说明数据) 维度就是统计致力于建立一个基于多方位统计(时间.地 ...
- AppCan学习笔记----关闭页面listview动态加载数据
AppCan页面关闭 AppCan 的页面是由两个HTML组成,如果要完全关闭的话需要在主HTML eg.index.html中关闭,关闭方法:appcan.window.close(-1); 管道 ...
- [JS前端开发] js/jquery控制页面动态加载数据 滑动滚动条自动加载事件
页面滚动动态加载数据,页面下拉自动加载内容 相信很多人都见过瀑布流图片布局,那些图片是动态加载出来的,效果很好,对服务器的压力相对来说也小了很多 有手机的相信都见过这样的效果:进入qq空间,向下拉动空 ...
- 微信小程序(五) 利用模板动态加载数据
利用模板动态加载数据,其实是对上一节静态数据替换成动态数据:
- mui 动态加载数据出现的问题处理 (silder轮播组件 indexedList索引列表 下拉刷新不能继续加载数据)
mui-slider 问题:动态给mui的图片轮播添加图片,轮播不滚动. 解决:最后把滚动轮播图片的mui(".mui-slider").slider({interval: 300 ...
- ASP.NET MVC动态加载数据
ASP.NET MVC动态加载数据,一般的做法是使用$.each方法来循环产生tabel: 你可以在html时先写下非动态的部分: Source Code 上图中,有一行代码: <tbody ...
- js实现滚动条来动态加载数据
主要angular2+es6 data:Array<any> //展示的数据 allData:Array<any> //全部的数据 size:number = 10 //每次动 ...
- js/jquery控制页面动态加载数据 滑动滚动条自动加载事件--转他人的
js/jquery控制页面动态加载数据 滑动滚动条自动加载事件--转他人的 相信很多人都见过瀑布流图片布局,那些图片是动态加载出来的,效果很好,对服务器的压力相对来说也小了很多 有手机的相信都见过这样 ...
随机推荐
- iOS开发-关闭/收起键盘方法总结
前言:作为IOS开发人员,需要经常和表单打交道.因此我对收起键盘的方法作了下总结,IOS收起键盘有三种方法(如果有其它收起键盘的方法请在留言区指错). 收起键盘的方法: 1.点击Return按扭时收起 ...
- 有关IM即时通讯原理
在网上搜索了一些资料,谈谈自己对IM即时通讯的理解 IM全称为Instant Messaging,即时通讯,如qq那种的. 现在有两个用户UserA, UserB, 俩人是一个IM通讯软件的好友,Us ...
- Audio简介
本片只简单从硬件角度简介Audio AC97/HDA Audio总线分两种: (1)I2S (2)HDA HD Audio spec Audio verb table是用来初始化audio的,一个au ...
- iptables修改
https://fedoraproject.org/wiki/How_to_edit_iptables_rules?rd=User_talk:Rforlot Listing Rules Current ...
- Python模块学习之fabric
fabric是一个运维经常使用到的一个模块.但是我在python3环境下安装fabric就遇到了坑! 安装包名称是fabric3而不是fabric! pip install fabric3 利用fab ...
- linux跨主机复制文件
scp -r billing@10.200.171.111:/billdata2/user/yanhm/redis/* /newboss/billing/user/aabb 其中: 10.200.17 ...
- window安装mysql
window安装mysql 1. 官网下载mysql zip安装包,然后解压到你想安装的目录,假设解压的目录是P:\mysql 解压完的目录:bin docs include lib share CO ...
- quantz入门和使用流程(转载)
1.下载地址:http://quartz-scheduler.org/downloads/catalog http://quartz-scheduler.org/downloads/destinati ...
- 我买网B轮融资成功,五周年豪掷千万回馈会员
对中粮我买网而言,近期的B轮融资应该算是最大的好消息了------8月1日,中粮我买网在京宣布完毕B轮融资.金额高达1亿美元.被称为"食品电商史上最大融资".据悉,本次融资 ...
- 【转载】C#时间差的计算,精确输出“年月天时分秒”
======================== 感谢“不忘初心”大神的分享======================== 原博地址:http://www.cnblogs.com/IT-Bear/a ...