【原创】大数据基础之Hadoop(3)yarn数据收集与监控
yarn常用rest api
1 metrics
# curl http://localhost:8088/ws/v1/cluster/metrics
The cluster metrics resource provides some overall metrics about the cluster. More detailed metrics should be retrieved from the jmx interface.
{

  "clusterMetrics":

  {

    "appsSubmitted":0,

    "appsCompleted":0,

    "appsPending":0,

    "appsRunning":0,

    "appsFailed":0,

    "appsKilled":0,

    "reservedMB":0,

    "availableMB":17408,

    "allocatedMB":0,

    "reservedVirtualCores":0,

    "availableVirtualCores":7,

    "allocatedVirtualCores":1,

    "containersAllocated":0,

    "containersReserved":0,

    "containersPending":0,

    "totalMB":17408,

    "totalVirtualCores":8,

    "totalNodes":1,

    "lostNodes":0,

    "unhealthyNodes":0,

    "decommissionedNodes":0,

    "rebootedNodes":0,

    "activeNodes":1

  }

}
2 scheduler
# curl http://localhost:8088/ws/v1/cluster/scheduler
A scheduler resource contains information about the current scheduler configured in a cluster. It currently supports both the Fifo and Capacity Scheduler. You will get different information depending on which scheduler is configured so be sure to look at the type information.
{

    "scheduler": {

        "schedulerInfo": {

            "capacity": 100.0,

            "maxCapacity": 100.0,

            "queueName": "root",

            "queues": {

                "queue": [

                    {

                        "absoluteCapacity": 10.5,

                        "absoluteMaxCapacity": 50.0,

                        "absoluteUsedCapacity": 0.0,

                        "capacity": 10.5,

                        "maxCapacity": 50.0,

                        "numApplications": 0,

                        "queueName": "a",

                        "queues": {

                            "queue": [

                                {

                                    "absoluteCapacity": 3.15,

                                    "absoluteMaxCapacity": 25.0,

                                    "absoluteUsedCapacity": 0.0,

                                    "capacity": 30.000002,

                                    "maxCapacity": 50.0,

                                    "numApplications": 0,

                                    "queueName": "a1",

...
3 apps
# curl http://localhost:8088/ws/v1/cluster/apps
With the Applications API, you can obtain a collection of resources, each of which represents an application. When you run a GET operation on this resource, you obtain a collection of Application Objects.
支持参数:
* state [deprecated] - state of the application
* states - applications matching the given application states, specified as a comma-separated list.
* finalStatus - the final status of the application - reported by the application itself
* user - user name
* queue - queue name
* limit - total number of app objects to be returned
* startedTimeBegin - applications with start time beginning with this time, specified in ms since epoch
* startedTimeEnd - applications with start time ending with this time, specified in ms since epoch
* finishedTimeBegin - applications with finish time beginning with this time, specified in ms since epoch
* finishedTimeEnd - applications with finish time ending with this time, specified in ms since epoch
* applicationTypes - applications matching the given application types, specified as a comma-separated list.
* applicationTags - applications matching any of the given application tags, specified as a comma-separated list.
{

  "apps":

  {

    "app":

    [

       {

          "finishedTime" : 1326815598530,

          "amContainerLogs" : "http://host.domain.com:8042/node/containerlogs/container_1326815542473_0001_01_000001",

          "trackingUI" : "History",

          "state" : "FINISHED",

          "user" : "user1",

          "id" : "application_1326815542473_0001",

          "clusterId" : 1326815542473,

          "finalStatus" : "SUCCEEDED",

          "amHostHttpAddress" : "host.domain.com:8042",

          "progress" : 100,

          "name" : "word count",

          "startedTime" : 1326815573334,

          "elapsedTime" : 25196,

          "diagnostics" : "",

          "trackingUrl" : "http://host.domain.com:8088/proxy/application_1326815542473_0001/jobhistory/job/job_1326815542473_1_1",

          "queue" : "default",

          "allocatedMB" : 0,

          "allocatedVCores" : 0,

          "runningContainers" : 0,

          "memorySeconds" : 151730,

          "vcoreSeconds" : 103

       },

       {

          "finishedTime" : 1326815789546,

          "amContainerLogs" : "http://host.domain.com:8042/node/containerlogs/container_1326815542473_0002_01_000001",

          "trackingUI" : "History",

          "state" : "FINISHED",

          "user" : "user1",

          "id" : "application_1326815542473_0002",

          "clusterId" : 1326815542473,

          "finalStatus" : "SUCCEEDED",

          "amHostHttpAddress" : "host.domain.com:8042",

          "progress" : 100,

          "name" : "Sleep job",

          "startedTime" : 1326815641380,

          "elapsedTime" : 148166,

          "diagnostics" : "",

          "trackingUrl" : "http://host.domain.com:8088/proxy/application_1326815542473_0002/jobhistory/job/job_1326815542473_2_2",

          "queue" : "default",

          "allocatedMB" : 0,

          "allocatedVCores" : 0,

          "runningContainers" : 1,

          "memorySeconds" : 640064,

          "vcoreSeconds" : 442

       }

    ]

  }

}
收集shell脚本示例
metrics
#!/bin/sh

cluster_name="c1"

rms="192.168.0.1 192.168.0.2"

url_path="/ws/v1/cluster/metrics"

keyword="clusterMetrics"

log_name="metrics.log"

base_dir="/tmp"

log_path=${base_dir}/${log_name}

echo "`date +'%Y-%m-%d %H:%M:%S'`"

for rm in $rms

do

        url="http://${rm}:8088${url_path}"

        echo $url

        content=`curl $url`

        echo $content

        if [[ "$content" == *"$keyword"* ]]; then

                break

        fi

done

if [[ "$content" == *"$keyword"* ]]; then

        modified="${content:0:$((${#content}-1))},\"currentTime\":`date +%s`,\"clusterName\":\"${cluster_name}\"}"

        echo "$modified"

        echo "$modified" >> $log_path

else

        echo "gather metrics failed from : ${rms}, ${url_path}, ${keyword}"

fi
apps
#!/bin/sh

cluster_name="c1"

rms="192.168.0.1 192.168.0.2"

url_path="/ws/v1/cluster/apps?states=RUNNING"

keyword="apps"

log_name="apps.log"

base_dir="/tmp"

log_path=${base_dir}/${log_name}

echo "`date +'%Y-%m-%d %H:%M:%S'`"

for rm in $rms

do

        url="http://${rm}:8088${url_path}"

        echo $url

        content=`curl $url`

        echo $content

        if [[ "$content" == *"$keyword"* ]]; then

                break

        fi

done

if [[ "$content" == *"$keyword"* ]]; then

        if [[ "$content" == *"application_"* ]]; then

                postfix=",\"currentTime\":`date +%s`,\"clusterName\":\"${cluster_name}\"}"

                modified="${content:16:$((${#content}-20))}"

                echo "${modified//\"/\\\"}"|awk '{split($0,arr,"},"); for (i in arr) {print arr[i]}}'|xargs -i echo "{}$postfix" >> $log_path

        else

                echo "no apps is running"

        fi

else

        echo "gather metrics failed from : ${rms}, ${url_path}, ${keyword}"

fi
然后对接ELK
ELK
Logstash配置示例
metrics1:input json+filter mutate rename
input {

  file {

    path => "/tmp/metrics.log"

    codec => "json"

  }

}

filter {

  mutate {

    rename => {

      "[clusterMetrics][appsSubmitted]" => "[appsSubmitted]"

      "[clusterMetrics][appsCompleted]" => "[appsCompleted]"

      "[clusterMetrics][appsPending]" => "[appsPending]"

      "[clusterMetrics][appsRunning]" => "[appsRunning]"

      "[clusterMetrics][appsFailed]" => "[appsFailed]"

      "[clusterMetrics][appsKilled]" => "[appsKilled]"

      "[clusterMetrics][reservedMB]" => "[reservedMB]"

      "[clusterMetrics][availableMB]" => "[availableMB]"

      "[clusterMetrics][allocatedMB]" => "[allocatedMB]"

      "[clusterMetrics][reservedVirtualCores]" => "[reservedVirtualCores]"

      "[clusterMetrics][availableVirtualCores]" => "[availableVirtualCores]"

      "[clusterMetrics][allocatedVirtualCores]" => "[allocatedVirtualCores]"

      "[clusterMetrics][containersAllocated]" => "[containersAllocated]"

      "[clusterMetrics][containersReserved]" => "[containersReserved]"

      "[clusterMetrics][containersPending]" => "[containersPending]"

      "[clusterMetrics][totalMB]" => "[totalMB]"

      "[clusterMetrics][totalVirtualCores]" => "[totalVirtualCores]"

      "[clusterMetrics][totalNodes]" => "[totalNodes]"

      "[clusterMetrics][lostNodes]" => "[lostNodes]"

      "[clusterMetrics][unhealthyNodes]" => "[unhealthyNodes]"

      "[clusterMetrics][decommissionedNodes]" => "[decommissionedNodes]"

      "[clusterMetrics][rebootedNodes]" => "[rebootedNodes]"

      "[clusterMetrics][activeNodes]" => "[activeNodes]"

    }

    remove_field => ["clusterMetrics", "path"]

  }

#  ruby {

#    code => "event.set('@timestamp', LogStash::Timestamp.at(event.get('currentTime') + 28800))"

#  }

  date {

    match => [ "currentTime","UNIX"]

    target => "@timestamp"

  }

}
metrics2:filter json+filter mutate add_field
input {

  file {

    path => "/tmp/metrics.log"

  }

}

filter {

  json {

    source => "message"

  }

  mutate {

    add_field => {

      "appsSubmitted" => "%{[clusterMetrics][appsSubmitted]}"

      "appsCompleted" => "%{[clusterMetrics][appsCompleted]}"

      "appsPending" => "%{[clusterMetrics][appsPending]}"

      "appsRunning" => "%{[clusterMetrics][appsRunning]}"

      "appsFailed" => "%{[clusterMetrics][appsFailed]}"

      "appsKilled" => "%{[clusterMetrics][appsKilled]}"

      "reservedMB" => "%{[clusterMetrics][reservedMB]}"

      "availableMB" => "%{[clusterMetrics][availableMB]}"

      "allocatedMB" => "%{[clusterMetrics][allocatedMB]}"

      "reservedVirtualCores" => "%{[clusterMetrics][reservedVirtualCores]}"

      "availableVirtualCores" => "%{[clusterMetrics][availableVirtualCores]}"

      "allocatedVirtualCores" => "%{[clusterMetrics][allocatedVirtualCores]}"

      "containersAllocated" => "%{[clusterMetrics][containersAllocated]}"

      "containersReserved" => "%{[clusterMetrics][containersReserved]}"

      "containersPending" => "%{[clusterMetrics][containersPending]}"

      "totalMB" => "%{[clusterMetrics][totalMB]}"

      "totalVirtualCores" => "%{[clusterMetrics][totalVirtualCores]}"

      "totalNodes" => "%{[clusterMetrics][totalNodes]}"

      "lostNodes" => "%{[clusterMetrics][lostNodes]}"

      "unhealthyNodes" => "%{[clusterMetrics][unhealthyNodes]}"

      "decommissionedNodes" => "%{[clusterMetrics][decommissionedNodes]}"

      "rebootedNodes" => "%{[clusterMetrics][rebootedNodes]}"

      "activeNodes" => "%{[clusterMetrics][activeNodes]}"

    }

    convert => {

      "appsSubmitted" => "integer"

      "appsCompleted" => "integer"

      "appsPending" => "integer"

      "appsRunning" => "integer"

      "appsFailed" => "integer"

      "appsKilled" => "integer"

      "reservedMB" => "integer"

      "availableMB" => "integer"

      "allocatedMB" => "integer"

      "reservedVirtualCores" => "integer"

      "availableVirtualCores" => "integer"

      "allocatedVirtualCores" => "integer"

      "containersAllocated" => "integer"

      "containersReserved" => "integer"

      "containersPending" => "integer"

      "totalMB" => "integer"

      "totalVirtualCores" => "integer"

      "totalNodes" => "integer"

      "lostNodes" => "integer"

      "unhealthyNodes" => "integer"

      "decommissionedNodes" => "integer"

      "rebootedNodes" => "integer"

      "activeNodes" => "integer"

    }

    remove_field => ["message", "clusterMetrics", "path"]

  }

#  ruby {

#    code => "event.set('@timestamp', LogStash::Timestamp.at(event.get('currentTime') + 28800))"

#  }

  date {

    match => [ "currentTime","UNIX"]

    target => "@timestamp"

  }

}
app:input json
input {

  file {

    path => "/tmp/apps.log"

    codec => "json"

  }

}

filter {

#  ruby {

#    code => "event.set('@timestamp', LogStash::Timestamp.at(event.get('currentTime') + 28800))"

#  }

  date {

    match => [ "currentTime","UNIX"]

    target => "@timestamp"

  }

}
注意:
date插件得到的timestamp为UTC时区,
1)如果是存放到elasticsearch然后用kibana展示(kibana会自动根据浏览器时区做偏移),直接使用UTC时区就可以;
2)如果是存放到其他存储,想直接存储当前时区的时间,需要指定timezone,但是date插件使用UNIX格式时timezone不会生效,会使用系统默认时区,所以使用ruby插件转换时区;
Unix timestamps (i.e. seconds since the epoch) are by definition always UTC and @timestamp is also always UTC. The timezone option indicates the timezone of the source timestamp, but doesn't really apply when the UNIX or UNIX_MS patterns are used.
所有timezone:http://joda-time.sourceforge.net/timezones.html
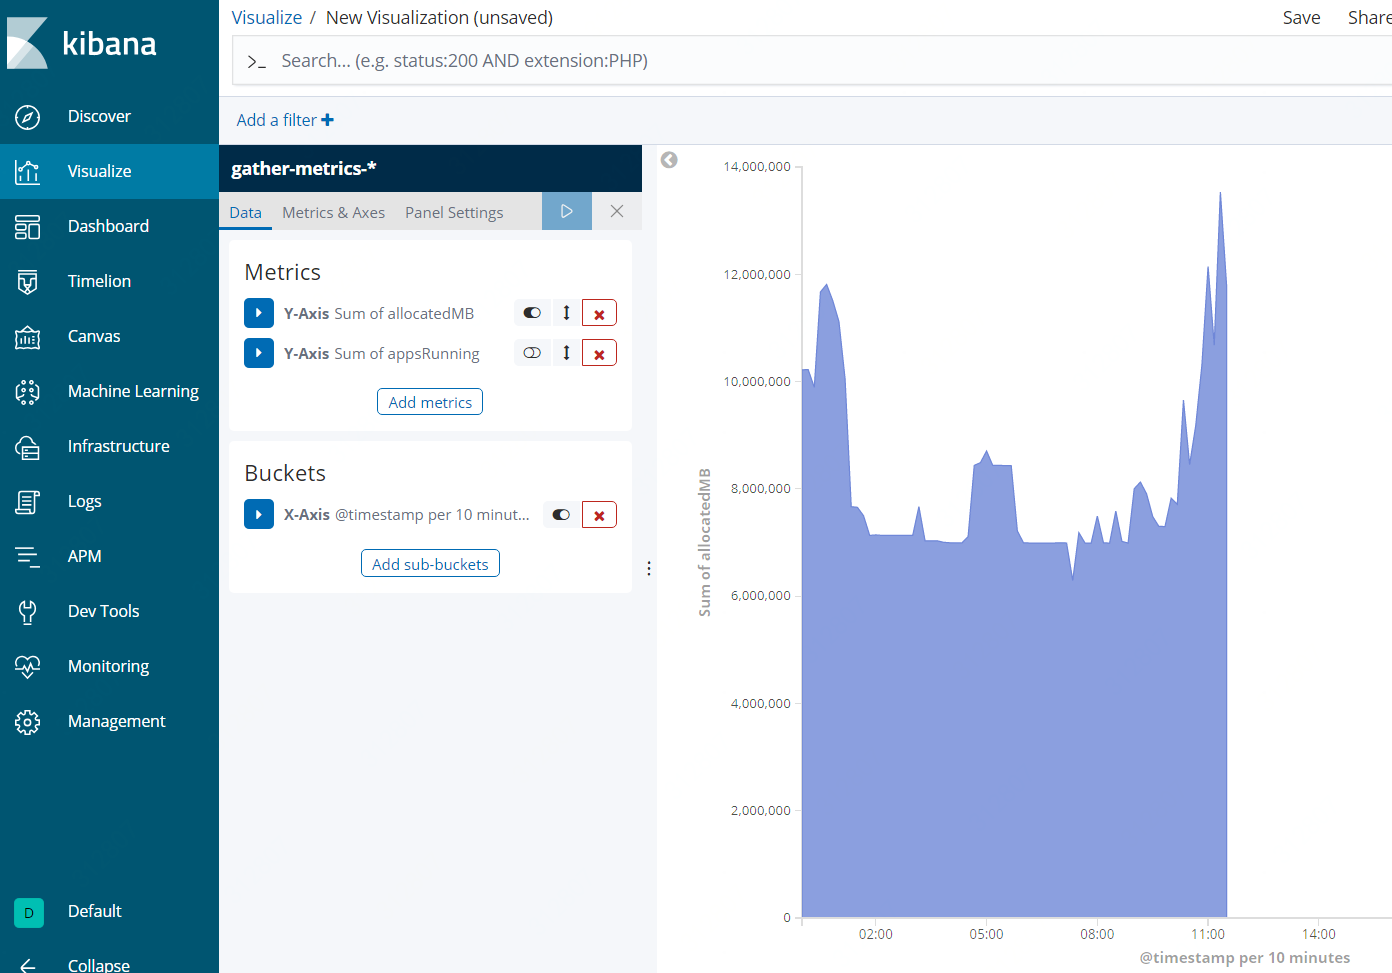
Kibana展示示例
参考:
https://hadoop.apache.org/docs/r2.7.3/hadoop-yarn/hadoop-yarn-site/ResourceManagerRest.html
https://discuss.elastic.co/t/new-timestamp-using-dynamic-timezone-not-working/97166
【原创】大数据基础之Hadoop(3)yarn数据收集与监控的更多相关文章
- 【原创】大数据基础之Hadoop(2)hdfs和yarn最简绿色部署
环境:3结点集群 192.168.0.1192.168.0.2192.168.0.3 1 配置root用户服务期间免密登录 参考:https://www.cnblogs.com/barneywill/ ...
- 【原创】大数据基础之Hadoop(1)HA实现原理
有些工作只能在一台server上进行,比如master,这时HA(High Availability)首先要求部署多个server,其次要求多个server自动选举出一个active状态server, ...
- 学习大数据基础框架hadoop需要什么基础
什么是大数据?进入本世纪以来,尤其是2010年之后,随着互联网特别是移动互联网的发展,数据的增长呈爆炸趋势,已经很难估计全世界的电子设备中存储的数据到底有多少,描述数据系统的数据量的计量单位从MB(1 ...
- 大数据基础总结---MapReduce和YARN技术原理
Map Reduce和YARN技术原理 学习目标 熟悉MapReduce和YARN是什么 掌握MapReduce使用的场景及其原理 掌握MapReduce和YARN功能与架构 熟悉YARN的新特性 M ...
- 大数据架构师基础:hadoop家族,Cloudera产品系列等各种技术
大数据我们都知道hadoop,可是还会各种各样的技术进入我们的视野:Spark,Storm,impala,让我们都反映不过来.为了能够更好的架构大数据项目,这里整理一下,供技术人员,项目经理,架构师选 ...
- 【大数据】了解Hadoop框架的基础知识
介绍 此Refcard提供了Apache Hadoop,这是最流行的软件框架,可使用简单的高级编程模型实现大型数据集的分布式存储和处理.我们将介绍Hadoop最重要的概念,描述其架构,指导您如何开始使 ...
- 大数据系列文章-Hadoop基础介绍(一)
Hadoop项目背景简介 2003-2004年,Google公开了部分GFS个Mapreduce思想的细节,以此为基础Doug Cutting等人用了2年的业余时间,实现了DFS和Mapreduce机 ...
- 【原创】大数据基础之Zookeeper(2)源代码解析
核心枚举 public enum ServerState { LOOKING, FOLLOWING, LEADING, OBSERVING; } zookeeper服务器状态:刚启动LOOKING,f ...
- 【原创】大数据基础之Impala(2)实现细节
一 架构 Impala is a massively-parallel query execution engine, which runs on hundreds of machines in ex ...
随机推荐
- Mysql数据的增删改查
一 介绍 MySQL数据操作: DML 在MySQL管理软件中,可以通过SQL语句中的DML语言来实现数据的操作,包括 使用INSERT实现数据的插入 UPDATE实现数据的更新 使用DELETE实现 ...
- xshell中进入PLSQL命令不能使用方向键和退格键的做法(输入后显示乱码)
解决输入退格键为乱码的情况 输入时可以ctrl+backspace进行强制退格,或者使用下面一种方法: 在xshell的连接属性中配置,如下图红圈部分: 彻底解决方向键和退格键的一种办法(未亲测) ...
- git方法 GUI here
注:stage changed是将所有修改归集到一次commit,如果要分开commit,则应该使用ctrl+t来一个一个文件的stage
- css3 animation(左右摆动) (放大缩小)
左右摆动: @-webkit-keyframes roundRule{ 0%, 100%{ -webkit-transform: rotate(-15deg); } 50%{ -webkit-tran ...
- Kindle官方广告“自封”泡面盖
动点科技获悉:亚马逊出品的电子书阅读器 kindle 在最新投放天猫平台上的 banner 栏醒目位置投放了一组广告,令人大跌眼镜的是图片使用了 kindle 放在一桶泡面上的形式,怕你看不懂用意的官 ...
- 【dp】求最长上升子序列
题目描述 给定一个序列,初始为空.现在我们将1到N的数字插入到序列中,每次将一个数字插入到一个特定的位置.我们想知道此时最长上升子序列长度是多少? 输入 第一行一个整数N,表示我们要将1到N插入序列中 ...
- 20175209 《Java程序设计》第三周学习总结
20175209 <Java程序设计>第三周学习总结 教材学习内容总结 第四章知识点 1.发展阶段: 面向机器——面向过程——面向对象(特点:封装性,继承性,多态性) 2.类: 类 声明变 ...
- 1.1浅谈Spring(一个叫春的框架)
如今各种Spring框架甚嚣尘上,但是终归还是属于spring的东西.所以在这里,个人谈一谈对spring的认识,笔者觉得掌握spring原理以及spring所涉及到的设计模式对我们具有极大的帮助.我 ...
- LFYZ-OJ ID: 1020 过河卒(NOIP2002)
过河卒 Proble Description 如图,A 点有一个过河卒,需要走到目标 B 点.卒行走规则:可以向下.或者向右.同时在棋盘上的任一点有一个对方的马(如上图的C点),该马所在的点和所有跳跃 ...
- LFYZ-OJ ID: 1024 火车站
火车过站 问题描述 火车从始发站(称为第1站)开出,在始发站上车的人数为a,然后到达第2站,在第2站有人上.下车,但上.下车的人数相同,因此在第2站开出时(即在到达第3站之前)车上的人数保持为a人.从 ...