《DSP using MATLAB》Problem 7.14
代码:
%% ++++++++++++++++++++++++++++++++++++++++++++++++++++++++++++++++++++++++++++++++
%% Output Info about this m-file
fprintf('\n***********************************************************\n');
fprintf(' <DSP using MATLAB> Problem 7.14 \n\n'); banner();
%% ++++++++++++++++++++++++++++++++++++++++++++++++++++++++++++++++++++++++++++++++ % bandpass
ws1 = 0.25*pi; wp1 = 0.35*pi; wp2=0.65*pi; ws2=0.75*pi;
delta1 = 0.05; delta2 = 0.01;
tr_width = min(wp1-ws1, ws2-wp2);
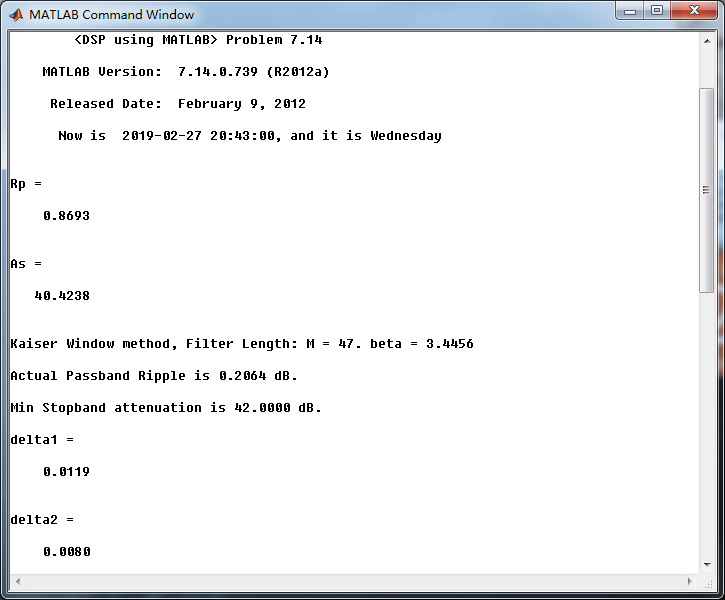
f = [ws1, wp1, wp2, ws2]/pi; [Rp, As] = delta2db(delta1, delta2) M = ceil((As-7.95)/(2.285*tr_width)) + 1; % Kaiser Window
if As > 21 || As < 50
beta = 0.5842*(As-21)^0.4 + 0.07886*(As-21);
else
beta = 0.1102*(As-8.7);
end fprintf('\nKaiser Window method, Filter Length: M = %d. beta = %.4f\n', M, beta); n = [0:1:M-1]; wc1 = (ws1+wp1)/2; wc2 = (ws2+wp2)/2; %wc = (ws + wp)/2, % ideal LPF cutoff frequency hd = ideal_lp(wc2, M) - ideal_lp(wc1, M);
w_kai = (kaiser(M, beta))'; h = hd .* w_kai;
[db, mag, pha, grd, w] = freqz_m(h, [1]); delta_w = 2*pi/1000;
[Hr,ww,P,L] = ampl_res(h); Rp = -(min(db(wp1/delta_w :1: wp2/delta_w+1))); % Actual Passband Ripple
fprintf('\nActual Passband Ripple is %.4f dB.\n', Rp); As = -round(max(db(1 : 1 : floor(ws1/delta_w)+1 ))); % Min Stopband attenuation
fprintf('\nMin Stopband attenuation is %.4f dB.\n', As); [delta1, delta2] = db2delta(Rp, As) % Plot figure('NumberTitle', 'off', 'Name', 'Problem 7.14 ideal_lp Method')
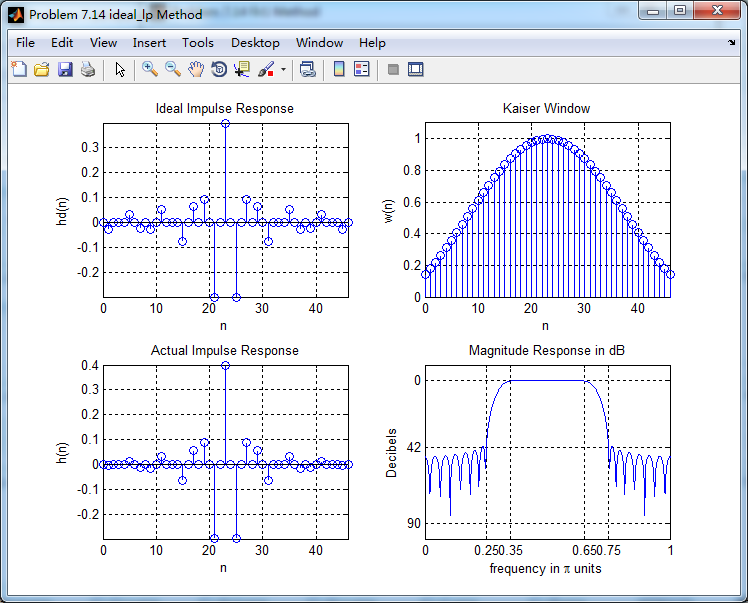
set(gcf,'Color','white'); subplot(2,2,1); stem(n, hd); axis([0 M-1 -0.3 0.4]); grid on;
xlabel('n'); ylabel('hd(n)'); title('Ideal Impulse Response'); subplot(2,2,2); stem(n, w_kai); axis([0 M-1 0 1.1]); grid on;
xlabel('n'); ylabel('w(n)'); title('Kaiser Window'); subplot(2,2,3); stem(n, h); axis([0 M-1 -0.3 0.4]); grid on;
xlabel('n'); ylabel('h(n)'); title('Actual Impulse Response'); subplot(2,2,4); plot(w/pi, db); axis([0 1 -100 10]); grid on;
set(gca,'YTickMode','manual','YTick',[-90,-42,0]);
set(gca,'YTickLabelMode','manual','YTickLabel',['90';'42';' 0']);
set(gca,'XTickMode','manual','XTick',[0,f,1]);
xlabel('frequency in \pi units'); ylabel('Decibels'); title('Magnitude Response in dB'); figure('NumberTitle', 'off', 'Name', 'Problem 7.14 h(n) ideal_lp Method')
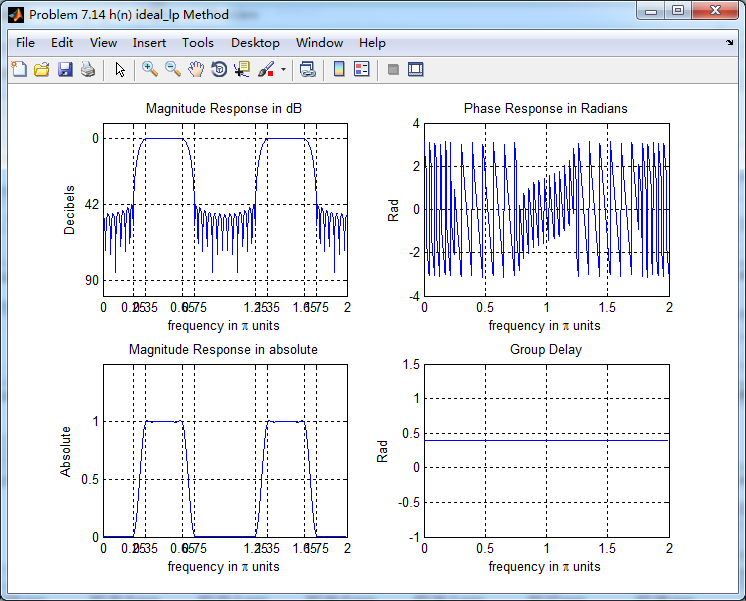
set(gcf,'Color','white'); subplot(2,2,1); plot(w/pi, db); grid on; axis([0 2 -100 10]);
xlabel('frequency in \pi units'); ylabel('Decibels'); title('Magnitude Response in dB');
set(gca,'YTickMode','manual','YTick',[-90,-42,0])
set(gca,'YTickLabelMode','manual','YTickLabel',['90';'42';' 0']);
set(gca,'XTickMode','manual','XTick',[0,f,1+f,2]); subplot(2,2,3); plot(w/pi, mag); grid on; %axis([0 2 -100 10]);
xlabel('frequency in \pi units'); ylabel('Absolute'); title('Magnitude Response in absolute');
set(gca,'XTickMode','manual','XTick',[0,f,1+f,2]);
set(gca,'YTickMode','manual','YTick',[0,0.5, 1]) subplot(2,2,2); plot(w/pi, pha); grid on; %axis([0 1 -100 10]);
xlabel('frequency in \pi units'); ylabel('Rad'); title('Phase Response in Radians');
subplot(2,2,4); plot(w/pi, grd*pi/180); grid on; %axis([0 1 -100 10]);
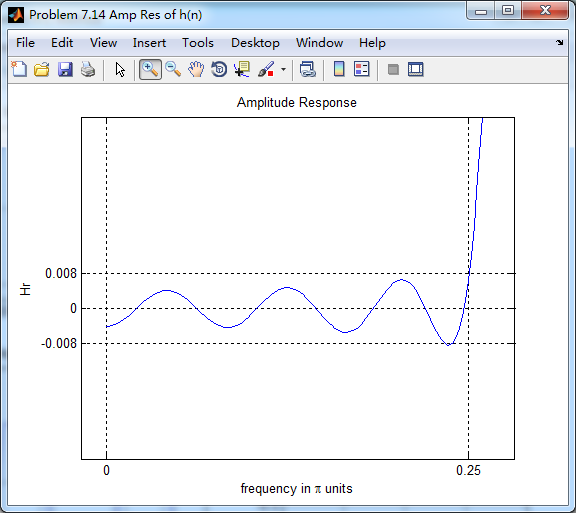
xlabel('frequency in \pi units'); ylabel('Rad'); title('Group Delay'); figure('NumberTitle', 'off', 'Name', 'Problem 7.14 Amp Res of h(n)')
set(gcf,'Color','white'); plot(ww/pi, Hr); grid on; %axis([0 1 -100 10]);
xlabel('frequency in \pi units'); ylabel('Hr'); title('Amplitude Response');
set(gca,'YTickMode','manual','YTick',[-delta2,0,delta2,1 - delta1,1, 1 + delta1])
%set(gca,'YTickLabelMode','manual','YTickLabel',['90';'45';' 0']);
set(gca,'XTickMode','manual','XTick',[0,f,2]); %% +++++++++++++++++++++++++++++++++++++++++
%% fir1 function method
%% +++++++++++++++++++++++++++++++++++++++++
f = [ws1, wp1, wp2, ws2]/pi;
m = [0 1 0];
ripple = [0.01 0.05 0.01];
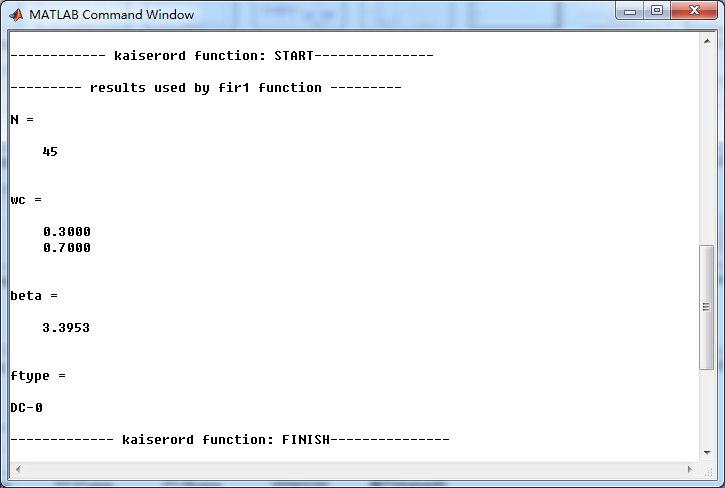
[N, wc, beta, ftype] = kaiserord(f,m,ripple);
fprintf('\n------------ kaiserord function: START---------------\n');
fprintf('\n--------- results used by fir1 function ---------\n');
N
wc
beta
ftype
fprintf('------------- kaiserord function: FINISH---------------\n');
%h_check = fir1(M-1, [wc1 wc2]/pi, 'stop', window(@kaiser, M));
%h_check = fir1(N, wc, ftype, window(@kaiser, N+1));
h_check = fir1(N, wc, ftype, kaiser(N+1, beta)); [db, mag, pha, grd, w] = freqz_m(h_check, [1]);
[Hr,ww,P,L] = ampl_res(h_check); As = -round(max(db(1 : 1 : floor(ws1/delta_w)+1 ))); % Min Stopband attenuation
fprintf('\nMin Stopband attenuation is %.4f dB.\n', As); Rp = -(min(db(wp1/delta_w :1: wp2/delta_w+1))); % Actual Passband Ripple
fprintf('\nActual Passband Ripple is %.4f dB.\n', Rp); [delta1, delta2] = db2delta(Rp, As) %% -------------------------------------------
%% plot
%% -------------------------------------------
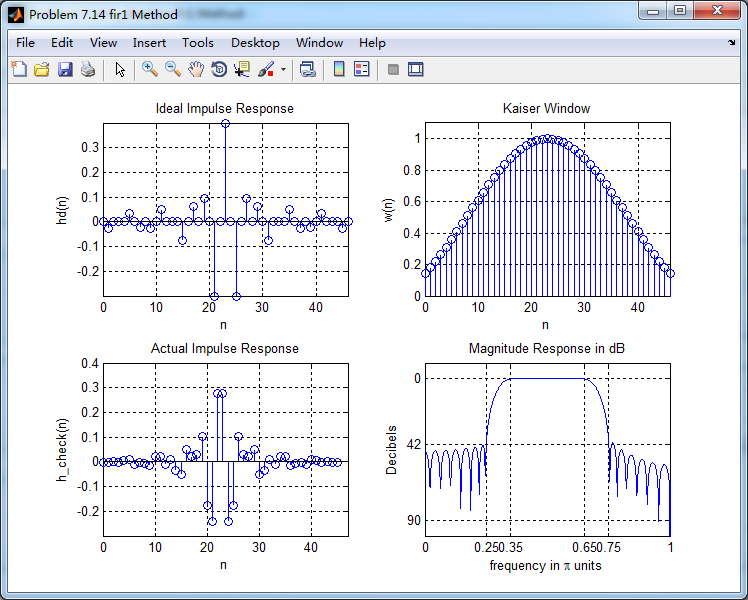
figure('NumberTitle', 'off', 'Name', 'Problem 7.14 fir1 Method')
set(gcf,'Color','white'); subplot(2,2,1); stem(n, hd); axis([0 M-1 -0.3 0.4]); grid on;
xlabel('n'); ylabel('hd(n)'); title('Ideal Impulse Response'); subplot(2,2,2); stem(n, w_kai); axis([0 M-1 0 1.1]); grid on;
xlabel('n'); ylabel('w(n)'); title('Kaiser Window'); subplot(2,2,3); stem([0:N], h_check); axis([0 M -0.3 0.4]); grid on;
xlabel('n'); ylabel('h\_check(n)'); title('Actual Impulse Response'); subplot(2,2,4); plot(w/pi, db); axis([0 1 -100 10]); grid on;
set(gca,'YTickMode','manual','YTick',[-90,-42,0]);
set(gca,'YTickLabelMode','manual','YTickLabel',['90';'42';' 0']);
set(gca,'XTickMode','manual','XTick',[0,f,1]);
xlabel('frequency in \pi units'); ylabel('Decibels'); title('Magnitude Response in dB'); figure('NumberTitle', 'off', 'Name', 'Problem 7.14 h_check(n) fir1 Method')
set(gcf,'Color','white'); subplot(2,2,1); plot(w/pi, db); grid on; axis([0 2 -100 10]);
xlabel('frequency in \pi units'); ylabel('Decibels'); title('Magnitude Response in dB');
set(gca,'YTickMode','manual','YTick',[-90,-42,0])
set(gca,'YTickLabelMode','manual','YTickLabel',['90';'42';' 0']);
set(gca,'XTickMode','manual','XTick',[0,f,1+f,2]); subplot(2,2,3); plot(w/pi, mag); grid on; %axis([0 2 -100 10]);
xlabel('frequency in \pi units'); ylabel('Absolute'); title('Magnitude Response in absolute');
set(gca,'XTickMode','manual','XTick',[0,f,1+f,2]);
set(gca,'YTickMode','manual','YTick',[0,0.5, 1]) subplot(2,2,2); plot(w/pi, pha); grid on; %axis([0 1 -100 10]);
xlabel('frequency in \pi units'); ylabel('Rad'); title('Phase Response in Radians');
subplot(2,2,4); plot(w/pi, grd*pi/180); grid on; %axis([0 1 -100 10]);
xlabel('frequency in \pi units'); ylabel('Rad'); title('Group Delay');
运行结果:


使用fir1函数得到的对应结果


《DSP using MATLAB》Problem 7.14的更多相关文章
- 《DSP using MATLAB》Problem 6.14
代码: %% ++++++++++++++++++++++++++++++++++++++++++++++++++++++++++++++++++++++++++++++++ %% Output In ...
- 《DSP using MATLAB》Problem 5.14
说明:这两个小题的数学证明过程都不会,欢迎博友赐教. 直接上代码: %% +++++++++++++++++++++++++++++++++++++++++++++++++++++++++++++++ ...
- 《DSP using MATLAB》Problem 4.14
代码: %% ---------------------------------------------------------------------------- %% Output Info a ...
- 《DSP using MATLAB》Problem 2.14
代码: %% ------------------------------------------------------------------------ %% Output Info about ...
- 《DSP using MATLAB》Problem 8.14
代码: %% ------------------------------------------------------------------------ %% Output Info about ...
- 《DSP using MATLAB》Problem 7.26
注意:高通的线性相位FIR滤波器,不能是第2类,所以其长度必须为奇数.这里取M=31,过渡带里采样值抄书上的. 代码: %% +++++++++++++++++++++++++++++++++++++ ...
- 《DSP using MATLAB》Problem 6.8
代码: %% ++++++++++++++++++++++++++++++++++++++++++++++++++++++++++++++++++++++++++++++++ %% Output In ...
- 《DSP using MATLAB》Problem 5.7
代码: %% ++++++++++++++++++++++++++++++++++++++++++++++++++++++++++++++++++++++++++++++++ %% Output In ...
- 《DSP using MATLAB》Problem 7.27
代码: %% ++++++++++++++++++++++++++++++++++++++++++++++++++++++++++++++++++++++++++++++++ %% Output In ...
随机推荐
- Vultr新用户充值优惠 – 最多充值100美元送100美元
Vultr商家向来是搅局的,当初海外VPS商家被Linode一家独大的时候,由于VULTR商家进入市场进行相似产品的营销,使得目前我们看到海外主机商各种低价.当然这些说法也有些武断,但是肯定是有一定的 ...
- mysql5.7.20 windows 解压缩版安装
1.下载 文件下载路径:https://dev.mysql.com/downloads/mysql/ 2.配置文件 在解压的文件夹内新建my.ini文件,并加入以下内容: [mysql] # 设置my ...
- 基于centos6.5安装部署mongdb3.6
注意:不同的版本的centos,mongdb安装方式不同,请注意版本号!! 基于centos6.5安装部署mongdb3.6 方式有多种,本文介绍使用wget命令来下载获取mongdb,具体命令如下 ...
- vue安装遇到vue不是内部变量
配置path系统变量 打开我的电脑-->右键属性-->高级系统设置-->环境变量-->Path-->添加获得npm的位置(搜索vue.cmd 可以找到该位置) 全局安装位 ...
- 自动化运维之ansible
第三十九课 自动化运维之ansible 目录 十五. ansible介绍 十六. ansible安装 十七. ansible远程执行命令 十八. ansible拷贝文件或目录 十九. ansible远 ...
- Problem A: 重载字符的加减法
Description 定义一个字符类Character,只有一个char类型的数据成员. 重载它的+.-.<<和>>运算符,其中+.-的第二个操作数是int类型的整数n.“+ ...
- Intellij idea 2018的注册方式
激活方式:License Server 第一步: 将地址 http://active.chinapyg.com/ 或者 http://idea.toocruel.net 任意一个复制到License ...
- c++中sort()函数的用法
用法: 1.sort函数可以三个参数也可以两个参数,必须的头文件#include < algorithm>和using namespace std; 2.它使用的排序方法是类似于快排的方法 ...
- SQL Server用表组织数据
一.主键 主键作为表中的唯一标识,标识这一列不允许出现重复数据 如果两列或多列组合起来唯一标识表中的每一行,该主键叫“复合主键” 选择主键的原则 最少性 尽量选择单个键作为主键 ...
- 巧用std::shared_ptr全局对象释放单例内存
巧用std::shared_ptr 单例的使用相对比较广泛,但是需要在程序退出前调用它的析构函数对数据进行释放,常规做法是在main函数末尾进行释放工作, 但是这样相对比较繁琐,因此便有了利用全局变量 ...