matplotlib系列——条形图
import matplotlib.pyplot as plt
import numpy as np
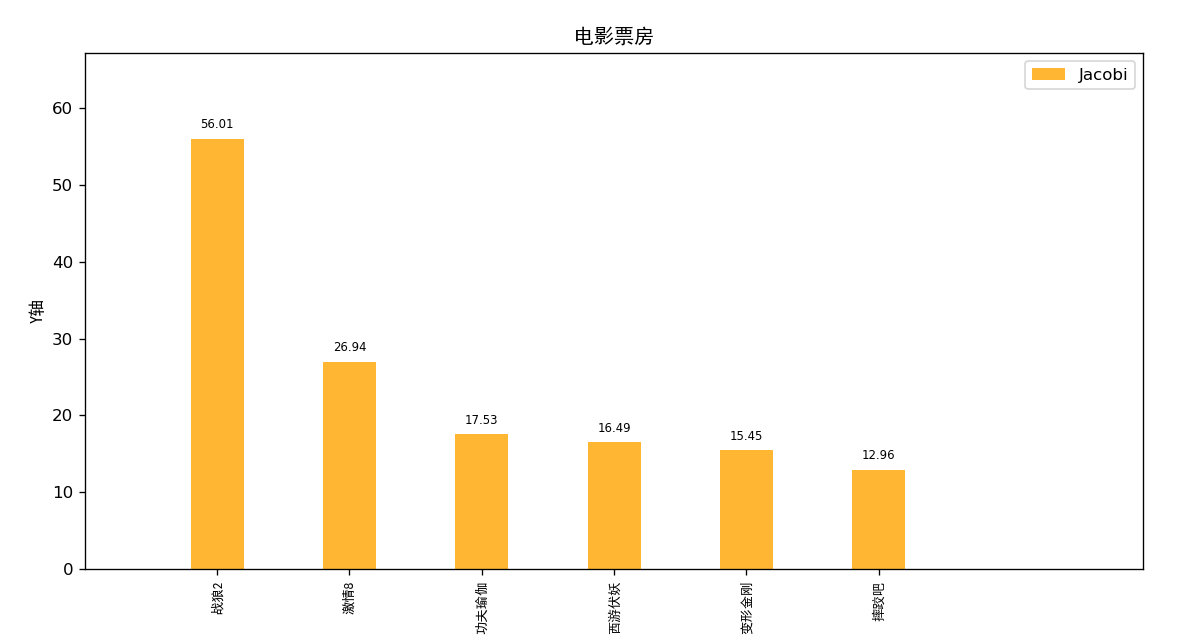
import matplotlib x = ["战狼2","激情8","功夫瑜伽","西游伏妖","变形金刚","摔跤吧"]
y = [56.01,26.94,17.53,16.49,15.45,12.96]
# 设置图形对象 :窗口
plt.figure('Figure Object 1', # 图形对象名称 窗口左上角显示
figsize = (8, 5), # 窗口大小
dpi = 120, # 分辨率
facecolor = 'white', # 背景色
) #绘制条形图
"""
left:长条形中点横坐标
height:长条形高度
width:长条形宽度,默认值0.8
label:为后面设置legend准备
"""
rects1=plt.bar(x, y, width=0.4,label='Jacobi',alpha=0.8,color='orange')
#rects1=plt.bar(x, y, width=0.4,label='Jacobi',alpha=0.8,color='orange') #横向条形图 #刻度
plt.xticks(range(len(x)),x,rotation=90,fontproperties='SimHei',fontsize=8)
#plt.yticks(range(len(x)), x, rotation=90) #条形图高度的标注
for rect in rects1:
height = rect.get_height()
plt.text(rect.get_x() + rect.get_width()/2, height+1, height, ha="center", va="bottom",fontsize=7) #坐标轴范围
plt.xlim(-1,len(x)+1)
plt.ylim(0, max(y)*1.2) #显示图例
plt.legend() #坐标轴标注
#plt.xlabel("X轴",fontproperties='SimHei',fontsize=8)
plt.ylabel("Y轴",fontproperties='SimHei',fontsize=10) #标题
plt.title('电影票房',fontproperties='SimHei',fontsize=12) plt.show()
matplotlib系列——条形图的更多相关文章
- matplotlib系列——线的属性
幕布视图:https://mubu.com/doc/alG8r_3iSw 参考文献:嵩天的Python课程讲义 示例(更多示例:matplotlib系列——折线图) 效果 颜色 线的风格 标记类型 ...
- python matplotlib.pyplot 条形图详解
python matplotlib.pyplot 条形图详解 一.创建直方图 可以用bar函数来创建直方图 然后用show函数显示直方图 比如: import matplotlib.pyplot as ...
- 4.4Python数据处理篇之Matplotlib系列(四)---plt.bar()与plt.barh条形图
目录 目录 前言 (一)竖值条形图 (二)水平条形图 1.使用bar()绘制: 2.使用barh()绘制: (三)复杂的条形图 1.并列条形图: 2.叠加条形图: 3.添加图例于数据标签的条形图: 目 ...
- python Matplotlib 系列教程(三)——绘制直方图和条形图
在本章节我们将学习如何绘制条形图和直方图 条形图与直方图的区别:首先,条形图是用条形的长度表示各类别频数的多少,其宽度(表示类别)则是固定的: 直方图是用面积表示各组频数的多少,矩形的高度表示每一组的 ...
- Matplotlib系列(四)--plt.bar与plt.barh条形图
(一)竖条条形图 参数说明 参数 说明 类型 x x坐标 int,float height 条形的高度 int,float width 线条的宽度 0~1,默认是0.8 botton 条形的起始位置 ...
- 4.7Python数据处理篇之Matplotlib系列(七)---matplotlib原理分析
目录 目录 前言 (一)总框架分析 (二)函数式的绘图 1.说明: 2.函数绘图的缺优点 3.绘图类的函数 4.操作类的函数 5.例子: (三)面向对象式的绘图 1.基本概念 2.基本对象 3.面向对 ...
- Python 绘图与可视化 matplotlib 动态条形图 bar
bar的参考链接:https://matplotlib.org/3.1.1/api/_as_gen/matplotlib.pyplot.bar.html 第一种办法 一种方法是每次都重新画,包括清除f ...
- 3.matplotlib绘制条形图
plt.bar() # coding=utf-8 from matplotlib import pyplot as plt from matplotlib import font_manager my ...
- matplotlib之条形图
1.知识点 1.plt.figure(figsize=(20,8),dpi=80)设置图像大小,主要参数为figsize(a,b) 2.plt.barh(range(len(a)),b,height= ...
随机推荐
- ES6——解构赋值
解构赋值: 注意: 1.左右两边结构必须一样 练习1,2,3 2.右边必须是个东西(有值)练习4 3.声明和赋值不能分开(必须在一句话里完成)练习5 /* 练习1: // let arr = [1,2 ...
- 2018-2-13-win10-UWP-RSS阅读器
title author date CreateTime categories win10 UWP RSS阅读器 lindexi 2018-2-13 17:23:3 +0800 2018-2-13 1 ...
- [数论]原根与指标,BSGS
刚学了这方面的知识,总结一下.推荐学习数论方面的知识还是看书学习,蒟蒻看的是<初等数论>学的. 这里也推荐几个总结性质的博客,学习大佬的代码和习题. 原根:https://blog.csd ...
- java 继承的概念及案例
package java09; //定义一个员工类 public class Employee { public void method(){ System.out.println("方法执 ...
- 无法用另一台电脑上的navicat链接主机数据库lost connection toMYSQl server at "handshake":reading inital communication packet,system error:34
同事要用navicat登陆我的数据库,主机地址和密码都没错,但是报错,lost connection toMYSQl server at "handshake":reading i ...
- Makefile中几种变量赋值运算符
Makefile中几种变量赋值运算符: = :最简单的赋值 := :一般也是赋值 以上这两个大部分情况下效果是一样的,但是有时候不一样. 用 = 赋值的变量,在被解析时他的值取决于最 ...
- 微信小程序swiper组件实现图片宽度自适应
wxml 代码: <!--pages/swipe/swipe.wxml--> <view> <swiper circular="true" indic ...
- HugeGraph图数据库--测试
2018年百度的HugeGraph.实现了Apache TinkerPop3框架及完全兼容Gremlin查询语言.开源项目https://github.com/hugegraph HugeGraph典 ...
- bzoj4007 & loj2111 [JLOI2015]战争调度 复杂度分析+树上背包
题目传送门 https://lydsy.com/JudgeOnline/problem.php?id=4007 https://loj.ac/problem/2111 题解 同 [NOI2006]网络 ...
- redisTemplate 封装bitcout
@Repositorypublic class RedisServiceExtend { @Autowired private RedisTemplate<String, String> ...