Debug your ASP.NET Application while Hosted on IIS
转摘:http://www.codeproject.com/Articles/37182/Debug-your-ASP-NET-Application-while-Hosted-on-IIS
Contents
- Overview
- ASP.NET Debugging vs. IIS Debugging
- What is the Worker Process?
- Application Pool
- How to start?
- Which process to attach to?
- How to attach to one of many running Worker Processes
- Summary
Overview
Generally we debug our ASP.NET web application from Visual Studio. Visual Studio has its own ASP.NET engine, which is capable enough to run and debug your web sites inside Visual Studio. However, if your site is hosted on IIS and you want to debug that site directly, how would you debug it? When we host sites on IIS, the Worker Process (w3wp.exe) is used to run the web application. We need to attach to this particular process from Visual Studio to debug the web application. This article describes the overall idea of debugging an application using this method. It also describes the Worker Process, Application Pool and selecting a particular process if there are multiple Worker Processes running on IIS, using iisapp.vbs. I hope you will enjoy this article and provide your valuable suggestions and feedback.
ASP.NET Debugging vs. IIS Debugging
Visual Studio has its own integrated debugging engine, which debugs our code when we run the application in Visual Studio. If we are developing a site and need to debug the code, we just set breakpoints and do the debugging (Note: In this article I do not describe how to set the debug mode).
When we run the application, execution breaks when certain a breakpoint is reached. It is very simple, because when an ASP.NET application is running in Visual Studio, it is under the control of the ASP.NET Engine which is integrated with Visual Studio. If you want to check which process is running for debugging, run the web application from Visual Studio: you will get a popup notification as shown below.

This indicates a process is starting to run the ASP.NET application. Double-click on the icon and a popup window will appear to show the details.
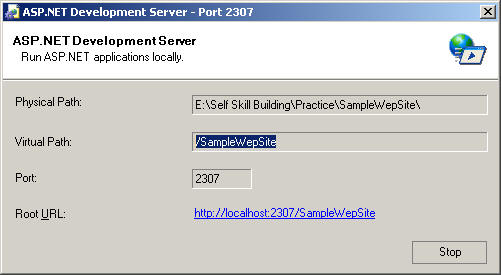
Behind the running process is WebDev.WebServer.exe. When We press F5 to run the application, this process starts to execute the it. If you want run the application from command prompt, you have to perform the following steps.
Steps to run a web application from the command prompt:
- Open The Visual Studio command prompt
- Run WebDev.WebServer
The following screen will come up. Check the Example section there.
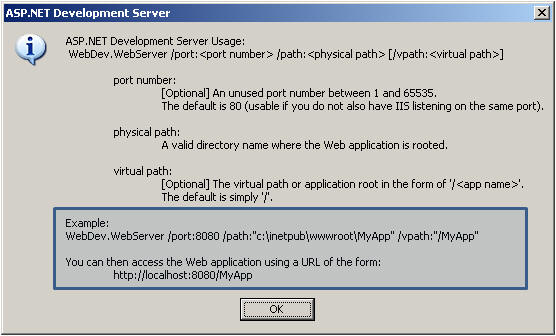
Now back to IIS debugging. IIS comes into the picture when we deploy or host the site. After deploying the site on IIS, if we want to debug the site there, we can't do it directly as in Visual Studio. IIS has its own Worker Process which takes care of all execution and maintenance of deployed web applications. I will describe the details of the Worker Process in a later section. So, if we have running process in IIS and we need to debug the application, first of all we have to attach to the correct process from Visual Studio. Before describing that, let's just have a look at the Worker Process and Application Pool.
What is the Worker Process?
The Worker Process (w3wp.exe) runs ASP.NET applications within IIS. All ASP.NET functionality runs under the scope of the Worker Process. When a request comes to the server from a client, the Worker Process is responsible for generating the request and response. Its also maintains the InProc session data. If we recycle the Worker Process, we will lose its state. For more information, read this article: A Low-Level Look at the ASP.NET Architecture
Application Pool
This is one of the most important things that you should create for your own application in a production environment. Application Pools are used to separate sets of IIS Worker Processes that share the same configuration. Application Pools enable us to isolate our web application for better security, reliability, and availability. The Worker Process serves as the process boundary that separates each Application Pool, so that when one Worker Process or application has an issue or recycles, other applications or Worker Processes are not affected.

Default Application Pool
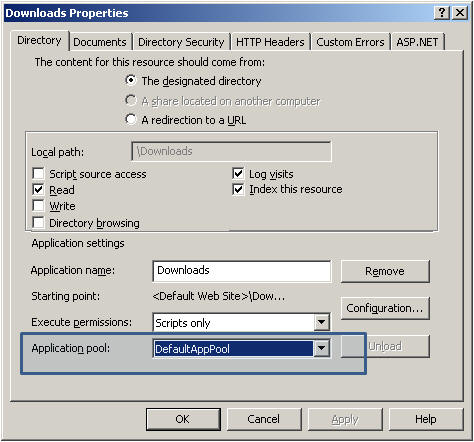
The name of the default application of IIS 6.0 is DefaultAppPool. After hosting the site on IIS, if we check the properties of the virtual directory, we can to view that information as follows.
- Start Menu → Run command →
inetmgr - Expand DefaultWebSites or Other Web Sites, where you have created the virtual directory
- Right Click on the virtual directory
- Click on Properties
The following virtual directory properties screen will come up, showing the Application Pool name which is assigned to the selected site.
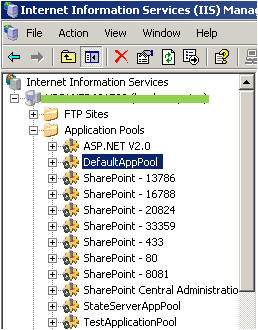
If you want to check the list of all Application Pools in IIS, you have to expand the Application Pool node on IIS Server.
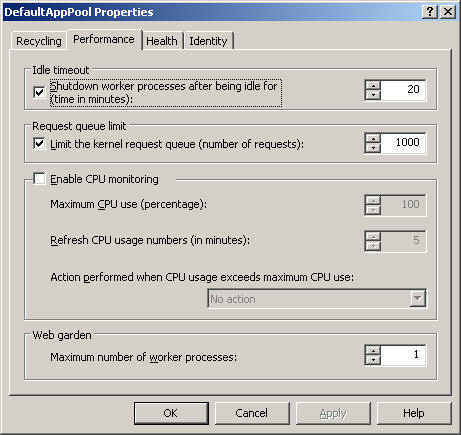
Now, each and every Application Pool should have the minimum of one Worker Process which takes care of the operation of the site which is associated with the Application Pool. Right-click on the Application Pool → go to the Performance tab, check near the bottom of the tab, there is a web garden section, and by default, the number of Worker Processes is 1. An Application Pool containing more than one Worker Process called a Web Garden.
Creating and Assigning an Application Pool
- Open the IIS Console, right-click on the Application Pools folder, select New
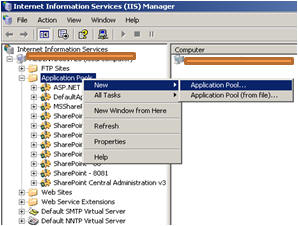 Fig. 8-1
 - Give the Application Pool ID and click OK.
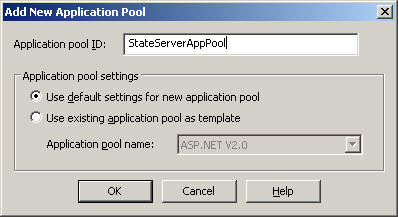 Fig. 8-2
 - Now, right-click on the virtual directory and assign the newly created Application Pool to that virtual directory.
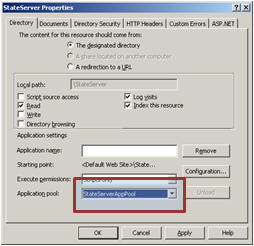 Fig. 8-3
Now, this web site will run independently, within StateServerAppPool, so any problem related to other applications will not affect this application. This is the main advantage of creating a separate Application Pool.
How to start?
What I have said up to now give you a good idea of Worker Processes and Application Pools. You should have a clear understanding on these before going on to the next part. Now I will show you how to debug a site which is hosted on an IIS Server.
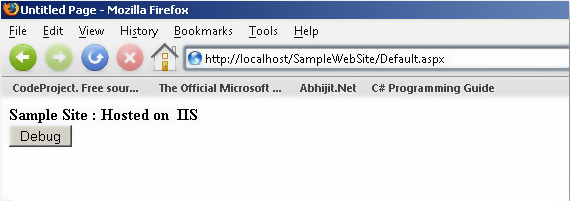
For the demonstration, I have created a web site called SampleWebSite and hosted it on to my local IIS. Below is default page output.
Which process to attach to?
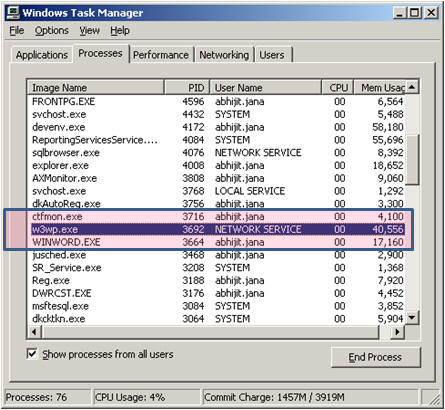
Now, as I have already explained, the process name is w3wp.exe, so we can check it from our Task Manager whether or not the Worker Process is running.
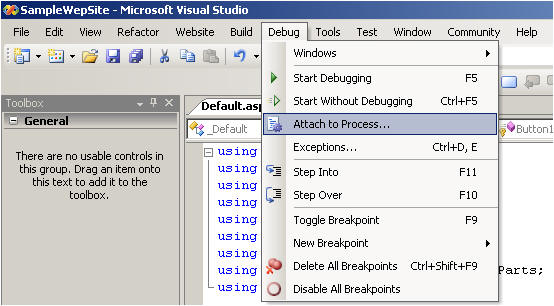
Now we are going to attach to the process. In Visual Studio, go to Debug → Attach to Process
After clicking Attach to Process, the following screen will come up
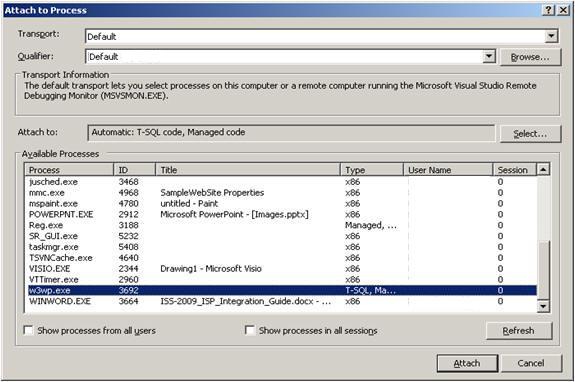
Now we are able to see that the Worker Process is running, and we need to attach that process. Select the process and click on the Attach button. After that, look at the two images below:


Did you notice the breakpoint symbol? If the Worker Process attached successfully, within the code, the breakpoint symbol should be a solid circle. Otherwise it will have a warning icon as shown. For a single Worker Process, this scenario is not common. However, when we have multiple Worker Processes running on IIS, then we can have some confusion. I will discuss the same in a later section.
Now if we click the Debug button after successfully attaching to the process, execution will stop at the breakpoint.
Next, let's have a look at what to do if we have multiple Worker Processes running.
How to attach to one of many running Worker Processes
Now, when this scenario will come up? When we have multiple sites hosted on IIS, and those sites have their own Application Pool. Now, multiple Application Pools means multiple Worker Processes are running.
Here I have three Application Pools in my IIS. They are:
- Default Application Pool
- Generic Application Pool
- State Server Application Pool
Now, my SampleWebSite is associated with the DefaultAppPool. Now, I want to attach the process to debug mySampleWebSite. Follow the same steps as before. Open the Process Attach window:
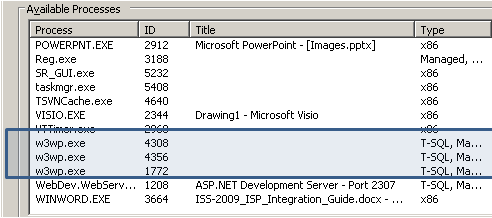
Just have a look, there are three Worker Processes currently running, and you have to attach one of them. But, you do not know which Worker Process is the default Application Pool's. What you do is, you select any one of them at random, let's say the one with process ID = 4308, and suppose it is not the Worker Process for the default Application Pool. So what will happen if you attach to a wrong process? Check the image below:

Getting a list of running Worker Processes
Now what is the solution for the previous case? Here is a quick tip:
- Start → Run command → cmd
- Change directory to \Windows\System32
- Run the command:
cscript iisapp.vbs
and wait for the output. Wow! You get a list of running Worker Process, Process ID and Application Pool Name!

Attaching to the correct process
From here you can easily identify the correct Application Pool name and its process ID. Now, return to Visual Studio → Attach Process. Now you know that the process ID for Default Application Pool is 1772, so Attach to that process.

Now, enjoy debugging!

Summary
Sometimes we need to debug our application which is hosted on IIS. For that, we need to attach the running Worker Process to the Visual Studio. If we have multiple Worker Processes running on the IIS server, we can identify the appropriate Worker Process by using the command cscript iisapp.vbs.
I hope this article will help beginners who are still struggling with debugging applications that are hosted on IIS. Please give your feedback and suggestions to improve the article.
Thank you.
License
This article, along with any associated source code and files, is licensed under The Code Project Open License (CPOL)
Debug your ASP.NET Application while Hosted on IIS的更多相关文章
- VS2015/2013/2012 IIS Express Debug Classic ASP
参考资料: https://msdn.microsoft.com/en-us/library/ms241740(v=vs.100).aspx When you attach to an ASP Web ...
- [Angular 2] How To Debug An Angular 2 Application - Debugging via Augury or the Console
In this lesson we will learn several ways to debug an Angular 2 application, including by using Augu ...
- ASP.NET Application Life Cycle
The table in this topic details the steps performed while an XAF ASP.NET application is running. Not ...
- ASP.NET Application and Page Life Cycle
ASP.NET Application Life Cycle Overview for IIS 7.0 https://msdn.microsoft.com/en-us/library/bb47025 ...
- How to increase timeout for your ASP.NET Application ?
How to increase timeout for your ASP.NET Application ? 原文链接:https://www.techcartnow.com/increase-tim ...
- [转]ASP.NET Core 1 Deploy to IIS
本文转自: http://webmodelling.com/webbits/aspnet/aspnet-deploy-iis.aspx 15 Sep 2016. This tutorial will ...
- 将asp.net core站点发布到IIS上遇到的问题
今天第一次将整个 asp.net core 站点发布到 IIS 上,以前都是发布到 Linux 服务器上. 开始使用 dotnet publish -c release 命令发布,用浏览器访问站点时出 ...
- Application Initialization Module for IIS 7.5
http://www.iis.net/downloads/microsoft/application-initialization IIS7.5也有Warm Up功能 让ASP.NET第一次Reque ...
- asp.net core 2.1 部署IIS(win10/win7)
asp.net core 2.1 部署IIS(win10/win7) 概述 与ASP.NET时代不同,ASP.NET Core不再是由IIS工作进程(w3wp.exe)托管,而是使用自托管Web服务器 ...
随机推荐
- python进行两个大数相加
python进行两个大数相加:由于int类型32位或64位都有长度限制,超出会内存溢出,无法计算,那么解决方法如下: 思路: 1.将超长数转换成字符串 2.进行长度补零,即让两个要计算的字符串长度一样 ...
- 树的计数 Prüfer编码与Cayley公式 学习笔记
最近学习了Prüfer编码与Cayley公式,这两个强力的工具一般用于解决树的计数问题.现在博主只能学到浅层的内容,只会用不会证明. 推荐博客:https://blog.csdn.net/moreja ...
- WriteDataToFile(filename,pJsonData,strlen(pJsonData)+1)
WriteDataToFile(filename,pJsonData,strlen(pJsonData)+1) 字节流的长度计算 发送的txt 文件是对的 zip exe出现字节计算错误 strlen ...
- Oracle 数据库恢复命令
前提是oracle服务能正常启动,但是客户端怎么都连接不上. 首先打开命令行,输入:sqlplus / as sysdba; 回车 连上数据库后,屏幕会显示:已连接到空闲例程. 接下来在SQL> ...
- 【LeetCode】深搜DFS(共85题)
[98]Validate Binary Search Tree [99]Recover Binary Search Tree [100]Same Tree [101]Symmetric Tree [1 ...
- Flutter-icon
常用屬性 Icon( Icons.access_alarm,//设置使用哪种图标 size: 300,//设置图标大小 color: Colors.yellow,//设置图标颜色 textDirect ...
- HTML知识梳理(笔记)
HTML常见元素 meta 定义和用法<meta> 元素可提供有关页面的元信息(meta-information),比如针对搜索引擎和更新频度的描述和关键词. <meta> 标 ...
- 【leetcode】659. Split Array into Consecutive Subsequences
题目如下: 解题思路:本题可以维护三个字典,dic_1保存没有组成序列的单元素,dic_2保存组成了包含两个元素的序列中的较大的元素,dic_3保存组成了包括三个或者三个以上元素的序列中的最大值.因为 ...
- vue cli3以上的项目中如何使用axois请求本地json文件
首先明确一点,在vue cli3以上的版本中,存放静态资源的文件是public 我刚开始以为是和vue cli2一样需要放在static文件夹下,但是项目中没有这个文件夹,我就自己创建了一个,结果请求 ...
- 英语单词Permissive
Permissive 来源 [root@centos7 ~]# setenforce usage: setenforce [ Enforcing | Permissive | | ] 翻译 adj. ...
