微服务SpringCloud之熔断监控Hystrix Dashboard和Turbine
Hystrix-dashboard是一款针对Hystrix进行实时监控的工具,通过Hystrix Dashboard我们可以在直观地看到各Hystrix Command的请求响应时间, 请求成功率等数据。但是只使用Hystrix Dashboard的话, 你只能看到单个应用内的服务信息, 这明显不够. 我们需要一个工具能让我们汇总系统内多个服务的数据并显示到Hystrix Dashboard上, 这个工具就是Turbine.用数据、图表展示更加直观,让数据说话,一图顶千言。
一、Hystrix Dashboard
1.引入依赖
在EurekaConsumer项目中引入Hystrix Dashboard也比较容易,只需在pom.xml中引入依赖,主要引入spring-cloud-starter-netflix-hystrix、spring-cloud-starter-netflix-hystrix-dashboard、spring-boot-starter-actuator。
<?xml version="1.0" encoding="UTF-8"?>

<project xmlns="http://maven.apache.org/POM/4.0.0" xmlns:xsi="http://www.w3.org/2001/XMLSchema-instance"

    xsi:schemaLocation="http://maven.apache.org/POM/4.0.0 http://maven.apache.org/xsd/maven-4.0.0.xsd">

    <modelVersion>4.0.0</modelVersion>

    <parent>

        <groupId>org.springframework.boot</groupId>

        <artifactId>spring-boot-starter-parent</artifactId>

        <version>2.1.6.RELEASE</version>

        <relativePath/> <!-- lookup parent from repository -->

    </parent>

    <groupId>com.example</groupId>

    <artifactId>EurekaConsumer</artifactId>

    <version>0.0.1-SNAPSHOT</version>

    <name>EurekaConsumer</name>

    <description>Demo project for Spring Boot</description>

    <properties>

        <java.version>1.8</java.version>

        <spring-cloud.version>Greenwich.SR1</spring-cloud.version>

    </properties>

    <dependencies>

        <dependency>

            <groupId>org.springframework.boot</groupId>

            <artifactId>spring-boot-starter-web</artifactId>

        </dependency>

        <dependency>

            <groupId>org.springframework.cloud</groupId>

            <artifactId>spring-cloud-starter-netflix-eureka-client</artifactId>

        </dependency>

        <dependency>

            <groupId>org.springframework.cloud</groupId>

            <artifactId>spring-cloud-starter-openfeign</artifactId>

        </dependency>

        <!-- https://mvnrepository.com/artifact/org.springframework.cloud/spring-cloud-openfeign-core -->

        <dependency>

            <groupId>org.springframework.cloud</groupId>

            <artifactId>spring-cloud-openfeign-core</artifactId>

            <version>2.1.2.RELEASE</version>

        </dependency>

        <!-- https://mvnrepository.com/artifact/org.springframework.cloud/spring-cloud-starter-netflix-hystrix -->

        <dependency>

            <groupId>org.springframework.cloud</groupId>

            <artifactId>spring-cloud-starter-netflix-hystrix</artifactId>

            <version>2.1.2.RELEASE</version>

        </dependency>

        <!-- https://mvnrepository.com/artifact/org.springframework.cloud/spring-cloud-starter-netflix-hystrix-dashboard -->

        <dependency>

            <groupId>org.springframework.cloud</groupId>

            <artifactId>spring-cloud-starter-netflix-hystrix-dashboard</artifactId>

            <version>2.1.2.RELEASE</version>

        </dependency>

        <!-- https://mvnrepository.com/artifact/org.springframework.boot/spring-boot-starter-actuator -->

        <dependency>

            <groupId>org.springframework.boot</groupId>

            <artifactId>spring-boot-starter-actuator</artifactId>

            <version>2.1.6.RELEASE</version>

        </dependency>

        <dependency>

            <groupId>org.springframework.boot</groupId>

            <artifactId>spring-boot-starter-test</artifactId>

            <scope>test</scope>

        </dependency>

    </dependencies>

    <dependencyManagement>

        <dependencies>

            <dependency>

                <groupId>org.springframework.cloud</groupId>

                <artifactId>spring-cloud-dependencies</artifactId>

                <version>${spring-cloud.version}</version>

                <type>pom</type>

                <scope>import</scope>

            </dependency>

        </dependencies>

    </dependencyManagement>

    <build>

        <plugins>

            <plugin>

                <groupId>org.springframework.boot</groupId>

                <artifactId>spring-boot-maven-plugin</artifactId>

            </plugin>

        </plugins>

    </build>

    <packaging>war</packaging>

</project>
2.启用@EnableHystrixDashboard、@EnableCircuitBreaker
在main方法类中增加注解@EnableHystrixDashboard、@EnableCircuitBreaker,如果只是添加注解还是不够的,运行的时候会报404的错误,还需要在EurekaConsumerApplication类中增加ServletRegistrationBean,设置映射的url。
package com.example.demo;

import org.springframework.boot.SpringApplication;

import org.springframework.boot.autoconfigure.SpringBootApplication;

import org.springframework.boot.web.servlet.ServletRegistrationBean;

import org.springframework.cloud.client.circuitbreaker.EnableCircuitBreaker;

import org.springframework.cloud.client.discovery.EnableDiscoveryClient;

import org.springframework.cloud.netflix.hystrix.dashboard.EnableHystrixDashboard;

import org.springframework.cloud.openfeign.EnableFeignClients;

import org.springframework.context.annotation.Bean;

import com.netflix.hystrix.contrib.metrics.eventstream.HystrixMetricsStreamServlet;

@SpringBootApplication

@EnableDiscoveryClient

@EnableFeignClients

@EnableHystrixDashboard

@EnableCircuitBreaker

public class EurekaConsumerApplication {

    public static void main(String[] args) {

        SpringApplication.run(EurekaConsumerApplication.class, args);

    }

      @Bean

      public ServletRegistrationBean getServlet() {

        HystrixMetricsStreamServlet streamServlet = new HystrixMetricsStreamServlet();

        ServletRegistrationBean registrationBean = new ServletRegistrationBean(streamServlet);

        registrationBean.setLoadOnStartup(1);

        registrationBean.addUrlMappings("/hystrix.stream");

        registrationBean.setName("HystrixMetricsStreamServlet");

        return registrationBean;

      }

}
3.输入http://localhost:9001/hystrix时,会显示如下页面
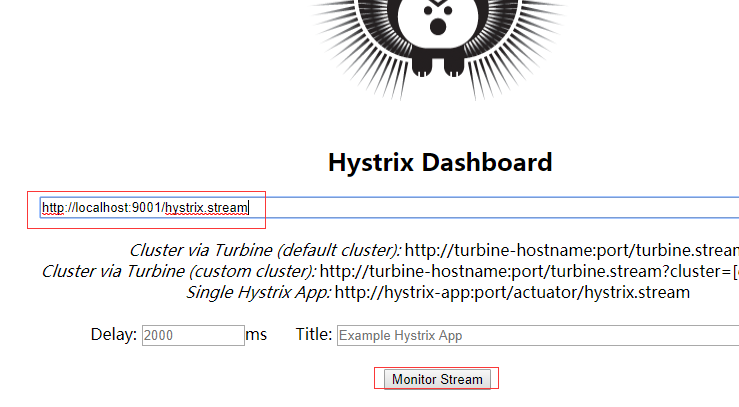
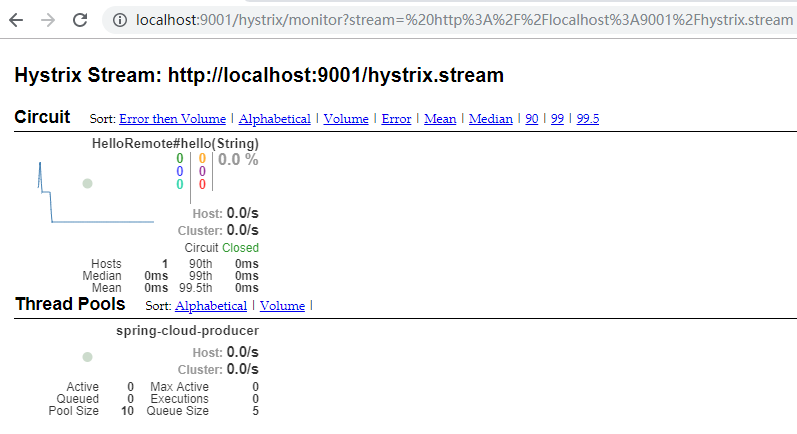
在上面的页面输入http://localhost:9001/hystrix.stream,点击Monitor Stream,然后请求http://localhost:9001/hello?name=cuiyw,就会在点击页面弹出的新页面中看到监控。
二、Turbine
在复杂的分布式系统中,相同服务的节点经常需要部署上百甚至上千个,很多时候,运维人员希望能够把相同服务的节点状态以一个整体集群的形式展现出来,这样可以更好的把握整个系统的状态。 为此,Netflix提供了一个开源项目(Turbine)来提供把多个hystrix.stream的内容聚合为一个数据源供Dashboard展示。
1.引入依赖
这里新建了HystrixTurbine项目,在项目中主要引入spring-cloud-starter-netflix-hystrix-dashboard、spring-cloud-starter-netflix-turbine、spring-boot-starter-actuator、spring-cloud-starter-netflix-turbine-stream。
<?xml version="1.0" encoding="UTF-8"?>

<project xmlns="http://maven.apache.org/POM/4.0.0" xmlns:xsi="http://www.w3.org/2001/XMLSchema-instance"

    xsi:schemaLocation="http://maven.apache.org/POM/4.0.0 http://maven.apache.org/xsd/maven-4.0.0.xsd">

    <modelVersion>4.0.0</modelVersion>

    <parent>

        <groupId>org.springframework.boot</groupId>

        <artifactId>spring-boot-starter-parent</artifactId>

        <version>2.1.6.RELEASE</version>

        <relativePath/> <!-- lookup parent from repository -->

    </parent>

    <groupId>com.example</groupId>

    <artifactId>HystrixTurbine</artifactId>

    <version>0.0.1-SNAPSHOT</version>

    <name>HystrixTurbine</name>

    <description>Demo project for Spring Boot</description>

    <properties>

        <java.version>1.8</java.version>

        <spring-cloud.version>Greenwich.SR2</spring-cloud.version>

    </properties>

    <dependencies>

        <dependency>

            <groupId>org.springframework.cloud</groupId>

            <artifactId>spring-cloud-starter-netflix-hystrix-dashboard</artifactId>

        </dependency>

        <dependency>

            <groupId>org.springframework.cloud</groupId>

            <artifactId>spring-cloud-starter-netflix-turbine</artifactId>

        </dependency>

        <dependency>

            <groupId>org.springframework.boot</groupId>

            <artifactId>spring-boot-starter-test</artifactId>

            <scope>test</scope>

        </dependency>

        <!-- https://mvnrepository.com/artifact/org.springframework.boot/spring-boot-starter-actuator -->

         <dependency>

            <groupId>org.springframework.boot</groupId>

            <artifactId>spring-boot-starter-actuator</artifactId>

            <version>2.1.6.RELEASE</version>

        </dependency>

                <!-- https://mvnrepository.com/artifact/org.springframework.cloud/spring-cloud-starter-netflix-turbine-stream -->

         <dependency>

            <groupId>org.springframework.cloud</groupId>

            <artifactId>spring-cloud-starter-netflix-turbine-stream</artifactId>

            <version>2.0.1.RELEASE</version>

        </dependency>

    </dependencies>

    <dependencyManagement>

        <dependencies>

            <dependency>

                <groupId>org.springframework.cloud</groupId>

                <artifactId>spring-cloud-dependencies</artifactId>

                <version>${spring-cloud.version}</version>

                <type>pom</type>

                <scope>import</scope>

            </dependency>

        </dependencies>

    </dependencyManagement>

    <build>

        <plugins>

            <plugin>

                <groupId>org.springframework.boot</groupId>

                <artifactId>spring-boot-maven-plugin</artifactId>

            </plugin>

        </plugins>

    </build>

    <packaging>war</packaging>

</project>
2.设置配置文件
spring.application.name=hystrix-dashboard-turbine

server.port=8002

turbine.appConfig=spring-cloud-consumerA,spring-cloud-consumerB

turbine.aggregator.clusterConfig= default

turbine.clusterNameExpression= new String("default")

eureka.client.serviceUrl.defaultZone=http://localhost:8088/eureka/

spring.main.allow-bean-definition-overriding=true

turbine.instanceUrlSuffix.default =hystrix.stream
turbine.appConfig :配置Eureka中的serviceId列表,表明监控哪些服务
turbine.aggregator.clusterConfig :指定聚合哪些集群,多个使用”,”分割,默认为default。可使用http://.../turbine.stream?cluster={clusterConfig之一}访问
turbine.clusterNameExpression : 1. clusterNameExpression指定集群名称,默认表达式appName;此时:turbine.aggregator.clusterConfig需要配置想要监控的应用名称;2. 当clusterNameExpression: default时,turbine.aggregator.clusterConfig可以不写,因为默认就是default;3. 当clusterNameExpression: metadata[‘cluster’]时,假设想要监控的应用配置了eureka.instance.metadata-map.cluster: ABC,则需要配置,同时turbine.aggregator.clusterConfig: ABC
3.设置@EnableHystrixDashboard、@EnableTurbineStream、@EnableTurbine
package com.example.demo;

import org.springframework.boot.SpringApplication;

import org.springframework.boot.autoconfigure.SpringBootApplication;

import org.springframework.cloud.netflix.hystrix.dashboard.EnableHystrixDashboard;

import org.springframework.cloud.netflix.turbine.EnableTurbine;

import org.springframework.cloud.netflix.turbine.stream.EnableTurbineStream;

@SpringBootApplication

@EnableHystrixDashboard

@EnableTurbineStream

@EnableTurbine

public class HystrixTurbineApplication {

    public static void main(String[] args) {

        SpringApplication.run(HystrixTurbineApplication.class, args);

    }

}
4.测试
分别启动EurekaServer、EurekaClient,分别修改EurekaConsumer,设置端口9001、9002,以及对应的spring.application.name为spring-cloud-consumerA、spring-cloud-consumerB,并启动,最后启动HystrixTurbine。
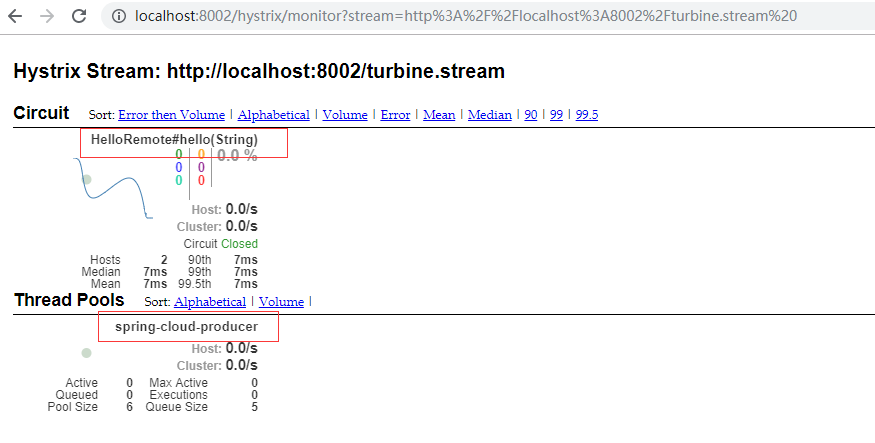
在浏览器中输入http://localhost:8002/hystrix,在出现的页面中输入http://localhost:8002/turbine.stream ,点击Monitor Stream,在浏览器中分别输入http://localhost:9002/hello?name=cuiyw、http://localhost:9001/hello?name=cuiyw,之后可以观察监控页面。由于这里只有一个接口一个生产者,所以只显示了一个。
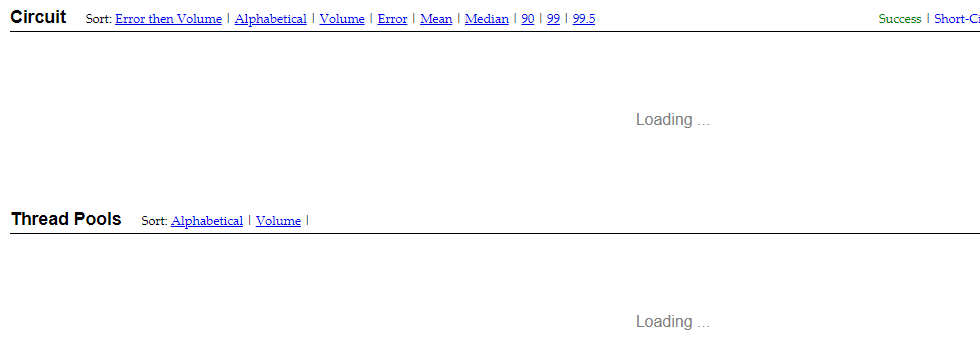
这里还有一个要注意的,由于未在配置文件中设置turbine.instanceUrlSuffix.default =hystrix.stream,导致打开监控页面时一直在loading。日志报com.netflix.turbine.monitor.instance.InstanceMonitor$MisconfiguredHostException: [{"timestamp":"2019-07-21T14:05:10.222+0000","status":404,"error":"Not Found","message":"No message available","path":"/actuator/hystrix.stream"}]错误。
微服务SpringCloud之熔断监控Hystrix Dashboard和Turbine的更多相关文章
- 跟我学SpringCloud | 第五篇:熔断监控Hystrix Dashboard和Turbine
SpringCloud系列教程 | 第五篇:熔断监控Hystrix Dashboard和Turbine Springboot: 2.1.6.RELEASE SpringCloud: Greenwich ...
- springcloud(五):熔断监控Hystrix Dashboard和Turbine
Hystrix-dashboard是一款针对Hystrix进行实时监控的工具,通过Hystrix Dashboard我们可以在直观地看到各Hystrix Command的请求响应时间, 请求成功率等数 ...
- spring cloud(五)熔断监控Hystrix Dashboard和Turbine
Hystrix-dashboard是一款针对Hystrix进行实时监控的工具,通过Hystrix Dashboard我们可以在直观地看到各Hystrix Command的请求响应时间, 请求成功率等数 ...
- Spring Cloud(五):熔断监控Hystrix Dashboard和Turbine
Hystrix-dashboard是一款针对Hystrix进行实时监控的工具,通过Hystrix Dashboard我们可以在直观地看到各Hystrix Command的请求响应时间, 请求成功率等数 ...
- spring cloud深入学习(六)-----熔断监控Hystrix Dashboard和Turbine
Hystrix-dashboard是一款针对Hystrix进行实时监控的工具,通过Hystrix Dashboard我们可以在直观地看到各Hystrix Command的请求响应时间, 请求成功率等数 ...
- spring cloud熔断监控Hystrix Dashboard和Turbine
参考: http://blog.csdn.net/ityouknow/article/details/72625646 完整pom <?xml version="1.0" e ...
- spring-cloud:熔断监控Hystrix Dashboard和Turbine的示例
1.运行环境 开发工具:intellij idea JDK版本:1.8 项目管理工具:Maven 4.0.0 2.GITHUB地址 https://github.com/nbfujx/springCl ...
- Spring Cloud 入门教程(八): 断路器指标数据监控Hystrix Dashboard 和 Turbine
1. Hystrix Dashboard (断路器:hystrix 仪表盘) Hystrix一个很重要的功能是,可以通过HystrixCommand收集相关数据指标. Hystrix Dashboa ...
- springcloud(十):熔断监控Hystrix Dashboard
申明: 这里比较坑爹,大家写的时候要小心,这里和springboot的版本有关系哈,我使用的是2.0 版本,要么调频为1.5 版本,要么使用其他方式 解决错误,我选择了还是用2.0 ...
随机推荐
- win10 uwp 获得Slider拖动结束的值
原文:win10 uwp 获得Slider拖动结束的值 本文讲的是如何获得Slider移动结束的值,也就是触发移动后的值.如果我们监听ValueChanged,在我们鼠标放开之前,只要拖动不放,那么就 ...
- 企业级架构 MVVM 模式指南 (WPF 和 Silverlight 实现) 译(3)
第一章 表现模式关注分离(soc)是企业及软件开发中非常有用的核心原则,也是许多表现模式背后的驱动力量.在WPF和Silverlight开发中,MVVM成为了实现关注分离最为有效的设计模式.然而,这种 ...
- Qt自定义委托在QTableView中绘制控件、图片、文字(内容比较全)
自定义委托,继承于,QStyledItemDelegate类,重载Paint()函数, 1.实现在QTableView中绘制 格式字符串 2.实现在QTableView中绘制进度条 3.实现在QTab ...
- DLL中类的显式链接(用虚函数进行显式链接)
DLL的显式链接在某些时候比隐式链接具有更大的灵活性.比如,如果在运行时发现DLL无法找到,程序可以显示一个错误信息并能继续运行.当你想为你的程序提供插件服务时,显式链接也很有用处. 显式链接到全局C ...
- 发布Qt Widgets桌面应用程序的方法(自定义进程步骤,用QT Creator直接生成)
发布Qt Widgets桌面应用程序的方法 Qt是一款优秀的跨平台开发框架,它可以在桌面.移动平台以及嵌入式平台上运行.目前Qt 5介绍程序发布的文章帖子比较少.大家又非常想要知道如何发布Qt应用程序 ...
- 极简代理IP爬取代码——Python爬取免费代理IP
这两日又捡起了许久不碰的爬虫知识,原因是亲友在朋友圈拉人投票,点进去一看发现不用登陆或注册,觉得并不复杂,就一时技痒搞一搞,看看自己的知识都忘到啥样了. 分析一看,其实就是个post请求,需要的信息都 ...
- log4net插入access自定义字段
1.创建表格 2.创建log4net.xml,并设置属性始终复制,关键属性 <bufferSize value="1" /> <conversionPattern ...
- vue2.0父子组件以及非父子组件通信传参详解
1.父组件传递数据给子组件 父组件数据如何传递给子组件呢?可以通过props属性来实现 父组件: <parent> <child :child-msg="msg" ...
- 【静态NAT】 为什么子网可以ping父网,但是父网ping不通子网?
为什么子网可以ping父网,但是父网ping不通子网? 这就好比在公网中ping一个192.168.0.x的子网,roter无法找到这个子网的地址,所以会把package丢掉. 如何解决呢,可以在路由 ...
- 使用release自动打包发布正式版详细教程
昨天写了个release插件的版本管理,今天就在自动发布过程中遇到了许多坑,只能再写一篇自动发布详细教程,纪念我那昨日逝去的青春 (╥ _ ╥`) release正常打包发布流程按照如下几个阶段: C ...