如何使用 Python 创建一个 NBA 得分图?
本文意在创建一个得分图,该图同时描绘了从场上不同位置投篮得分的百分比和投篮次数,这和 Austin Clemen 个人网站上的帖子 http://www.austinclemens.com/shotcharts/ 类似 。
为了实现这个得分图,笔者参考了 Savvas Tjortjoglou 的帖子 http://savvastjortjoglou.com/nba-shot-sharts.html。这篇帖子很棒,但是他只描述了从不同位置投篮的次数。而笔者对在不同位置的投篮次数和进球百分比都很感兴趣,所以还需要进一步的工作,在原有基础上添加些东西,下面是实现过程。
#import some libraries and tell ipython we want inline figures rather than interactive figures.

%matplotlib inline

import matplotlib.pyplot as plt, pandas as pd, numpy as np, matplotlib as mpl
首先,我们需要获得每个球员的投篮数据。利用 Savvas Tjortjoglou 贴出的代码,笔者从 NBA.com 网站 API 上获取了数据。在此不会贴出这个函数的结果。如果你感兴趣,推荐你去看看 Savvas Tjortjoglou 的博客。
def aqcuire_shootingData(PlayerID,Season):

    import requests

    shot_chart_url = 'http://stats.nba.com/stats/shotchartdetail?CFID=33&CFPARAMS='+Season+'&ContextFilter='\

                    '&ContextMeasure=FGA&DateFrom=&DateTo=&GameID=&GameSegment=&LastNGames=0&LeagueID='\

                    '00&Location=&MeasureType=Base&Month=0&OpponentTeamID=0&Outcome=&PaceAdjust='\

                    'N&PerMode=PerGame&Period=0&PlayerID='+PlayerID+'&PlusMinus=N&Position=&Rank='\

                    'N&RookieYear=&Season='+Season+'&SeasonSegment=&SeasonType=Regular+Season&TeamID='\

                    '0&VsConference=&VsDivision=&mode=Advanced&showDetails=0&showShots=1&showZones=0'

    response = requests.get(shot_chart_url)

    headers = response.json()['resultSets'][0]['headers']

    shots = response.json()['resultSets'][0]['rowSet']

    shot_df = pd.DataFrame(shots, columns=headers)

    return shot_df
接下来,我们需要绘制一个包含得分图的篮球场图。该篮球场图例必须使用与NBA.com API 相同的坐标系统。例如,3分位置的投篮距篮筐必须为 X 单位,上篮距离篮筐则是 Y 单位。同样,笔者再次使用了 Savvas Tjortjoglou 的代码(哈哈,否则的话,搞明白 NBA.com 网站的坐标系统肯定会耗费不少的时间)。
def draw_court(ax=None, color='black', lw=2, outer_lines=False):

    from matplotlib.patches import Circle, Rectangle, Arc

    if ax is None:

        ax = plt.gca()

    hoop = Circle((0, 0), radius=7.5, linewidth=lw, color=color, fill=False)

    backboard = Rectangle((-30, -7.5), 60, -1, linewidth=lw, color=color)

    outer_box = Rectangle((-80, -47.5), 160, 190, linewidth=lw, color=color,

                          fill=False)

    inner_box = Rectangle((-60, -47.5), 120, 190, linewidth=lw, color=color,

                          fill=False)

    top_free_throw = Arc((0, 142.5), 120, 120, theta1=0, theta2=180,

                         linewidth=lw, color=color, fill=False)

    bottom_free_throw = Arc((0, 142.5), 120, 120, theta1=180, theta2=0,

                            linewidth=lw, color=color, linestyle='dashed')

    restricted = Arc((0, 0), 80, 80, theta1=0, theta2=180, linewidth=lw,

                     color=color)

    corner_three_a = Rectangle((-220, -47.5), 0, 140, linewidth=lw,

                               color=color)

    corner_three_b = Rectangle((220, -47.5), 0, 140, linewidth=lw, color=color)

    three_arc = Arc((0, 0), 475, 475, theta1=22, theta2=158, linewidth=lw,

                    color=color)

    center_outer_arc = Arc((0, 422.5), 120, 120, theta1=180, theta2=0,

                           linewidth=lw, color=color)

    center_inner_arc = Arc((0, 422.5), 40, 40, theta1=180, theta2=0,

                           linewidth=lw, color=color)

    court_elements = [hoop, backboard, outer_box, inner_box, top_free_throw,

                      bottom_free_throw, restricted, corner_three_a,

                      corner_three_b, three_arc, center_outer_arc,

                      center_inner_arc]

    if outer_lines:

        outer_lines = Rectangle((-250, -47.5), 500, 470, linewidth=lw,

                                color=color, fill=False)

        court_elements.append(outer_lines)

    for element in court_elements:

        ax.add_patch(element)

    ax.set_xticklabels([])

    ax.set_yticklabels([])

    ax.set_xticks([])

    ax.set_yticks([])

    return ax
我想创造一个不同位置的投篮百分比数组,因此决定利用 matplot 的 Hexbin 函数 http://matplotlib.org/api/pyplot_api.html 将投篮位置均匀地分组到六边形中。该函数会对每个六边形中每一个位置的投篮次数进行计数。
六边形是均匀的分布在 XY 网格中。「gridsize」变量控制六边形的数目。「extent」变量控制第一个和最后一个六边形的绘制位置(一般来说第一个六边形的位置基于第一个投篮的位置)。
计算命中率则需要对每个六边形中投篮的次数和投篮得分次数进行计数,因此笔者对同一位置的投篮和得分数分别运行 hexbin 函数。然后,只需用每个位置的进球数除以投篮数。
def find_shootingPcts(shot_df, gridNum):

    x = shot_df.LOC_X[shot_df['LOC_Y']<425.1] #i want to make sure to only include shots I can draw

    y = shot_df.LOC_Y[shot_df['LOC_Y']<425.1]

    x_made = shot_df.LOC_X[(shot_df['SHOT_MADE_FLAG']==1) & (shot_df['LOC_Y']<425.1)]

    y_made = shot_df.LOC_Y[(shot_df['SHOT_MADE_FLAG']==1) & (shot_df['LOC_Y']<425.1)]

    #compute number of shots made and taken from each hexbin location

    hb_shot = plt.hexbin(x, y, gridsize=gridNum, extent=(-250,250,425,-50));

    plt.close() #don't want to show this figure!

    hb_made = plt.hexbin(x_made, y_made, gridsize=gridNum, extent=(-250,250,425,-50),cmap=plt.cm.Reds);

    plt.close()

    #compute shooting percentage

    ShootingPctLocs = hb_made.get_array() / hb_shot.get_array()

    ShootingPctLocs[np.isnan(ShootingPctLocs)] = 0 #makes 0/0s=0

    return (ShootingPctLocs, hb_shot)
笔者非常喜欢 Savvas Tjortjoglou 在他的得分图中加入了球员头像的做法,因此也顺道用了他的这部分代码。球员照片会出现在得分图的右下角。
def acquire_playerPic(PlayerID, zoom, offset=(250,400)):

    from matplotlib import  offsetbox as osb

    import urllib

    pic = urllib.urlretrieve("http://stats.nba.com/media/players/230x185/"+PlayerID+".png",PlayerID+".png")

    player_pic = plt.imread(pic[0])

    img = osb.OffsetImage(player_pic, zoom)

    #img.set_offset(offset)

    img = osb.AnnotationBbox(img, offset,xycoords='data',pad=0.0, box_alignment=(1,0), frameon=False)

    return img
笔者想用连续的颜色图来描述投篮进球百分比,红圈越多代表着更高的进球百分比。虽然「红」颜色图示效果不错,但是它会将0%的投篮进球百分比显示为白色http://matplotlib.org/users/colormaps.html,而这样显示就会不明显,所以笔者用淡粉红色代表0%的命中率,因此对红颜色图做了下面的修改。
#cmap = plt.cm.Reds

#cdict = cmap._segmentdata

cdict = {

    'blue': [(0.0, 0.6313725709915161, 0.6313725709915161), (0.25, 0.4470588266849518, 0.4470588266849518), (0.5, 0.29019609093666077, 0.29019609093666077), (0.75, 0.11372549086809158, 0.11372549086809158), (1.0, 0.05098039284348488, 0.05098039284348488)],

    'green': [(0.0, 0.7333333492279053, 0.7333333492279053), (0.25, 0.572549045085907, 0.572549045085907), (0.5, 0.4156862795352936, 0.4156862795352936), (0.75, 0.0941176488995552, 0.0941176488995552), (1.0, 0.0, 0.0)],

    'red': [(0.0, 0.9882352948188782, 0.9882352948188782), (0.25, 0.9882352948188782, 0.9882352948188782), (0.5, 0.9843137264251709, 0.9843137264251709), (0.75, 0.7960784435272217, 0.7960784435272217), (1.0, 0.40392157435417175, 0.40392157435417175)]

}

mymap = mpl.colors.LinearSegmentedColormap('my_colormap', cdict, 1024)
好了,现在需要做的就是将它们合并到一块儿。下面所示的较大函数会利用上文描述的函数来创建一个描述投篮命中率的得分图,百分比由红圈表示(红色越深 = 更高的命中率),投篮次数则由圆圈的大小决定(圆圈越大 = 投篮次数越多)。需要注意的是,圆圈在交叠之前都能增大。一旦圆圈开始交叠,就无法继续增大。
在这个函数中,计算了每个位置的投篮进球百分比和投篮次数。然后画出在该位置投篮的次数(圆圈大小)和进球百分比(圆圈颜色深浅)。
def shooting_plot(shot_df, plot_size=(12,8),gridNum=30):

    from matplotlib.patches import Circle

    x = shot_df.LOC_X[shot_df['LOC_Y']<425.1]

    y = shot_df.LOC_Y[shot_df['LOC_Y']<425.1]

    #compute shooting percentage and # of shots

    (ShootingPctLocs, shotNumber) = find_shootingPcts(shot_df, gridNum)

    #draw figure and court

    fig = plt.figure(figsize=plot_size)#(12,7)

    cmap = mymap #my modified colormap

    ax = plt.axes([0.1, 0.1, 0.8, 0.8]) #where to place the plot within the figure

    draw_court(outer_lines=False)

    plt.xlim(-250,250)

    plt.ylim(400, -25)

    #draw player image

    zoom = np.float(plot_size[0])/(12.0*2) #how much to zoom the player's pic. I have this hackily dependent on figure size

    img = acquire_playerPic(PlayerID, zoom)

    ax.add_artist(img)

    #draw circles

    for i, shots in enumerate(ShootingPctLocs):

        restricted = Circle(shotNumber.get_offsets()[i], radius=shotNumber.get_array()[i],

                            color=cmap(shots),alpha=0.8, fill=True)

        if restricted.radius > 240/gridNum: restricted.radius=240/gridNum

        ax.add_patch(restricted)

    #draw color bar

    ax2 = fig.add_axes([0.92, 0.1, 0.02, 0.8])

    cb = mpl.colorbar.ColorbarBase(ax2,cmap=cmap, orientation='vertical')

    cb.set_label('Shooting %')

    cb.set_ticks([0.0, 0.25, 0.5, 0.75, 1.0])

    cb.set_ticklabels(['0%','25%', '50%','75%', '100%'])

    plt.show()

    return ax
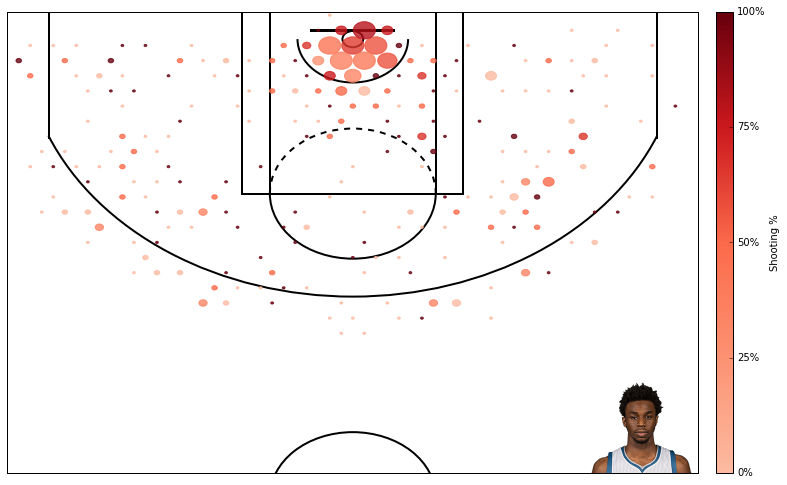
好了,大功告成!因为笔者是森林狼队的粉丝,在下面用几分钟跑出了森林狼队前六甲的得分图。
PlayerID = '203952' #andrew wiggins

shot_df = aqcuire_shootingData(PlayerID,'2015-16')

ax = shooting_plot(shot_df, plot_size=(12,8));
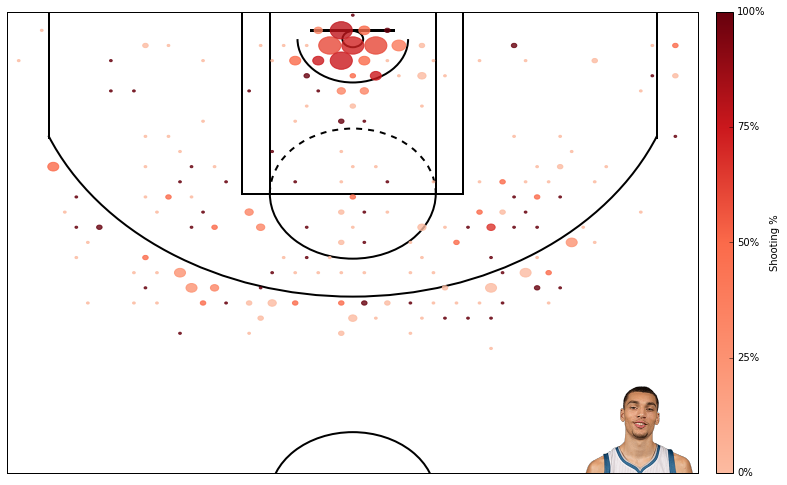
PlayerID = '1626157' #karl anthony towns

shot_df = aqcuire_shootingData(PlayerID,'2015-16')

ax = shooting_plot(shot_df, plot_size=(12,8));

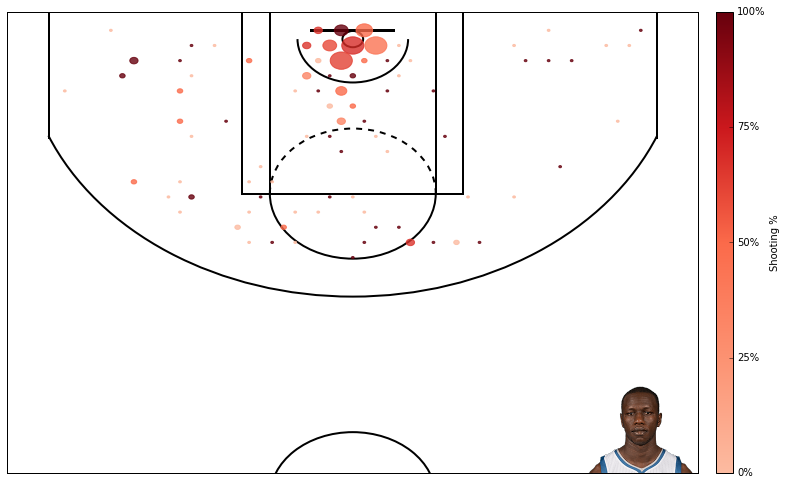
PlayerID = '203897' #zach lavine

shot_df = aqcuire_shootingData(PlayerID,'2015-16')

ax = shooting_plot(shot_df, plot_size=(12,8));
PlayerID = '203476' #gorgui deing

shot_df = aqcuire_shootingData(PlayerID,'2015-16')

ax = shooting_plot(shot_df, plot_size=(12,8));
PlayerID = '2755' #kevin martin

shot_df = aqcuire_shootingData(PlayerID,'2015-16')

ax = shooting_plot(shot_df, plot_size=(12,8));

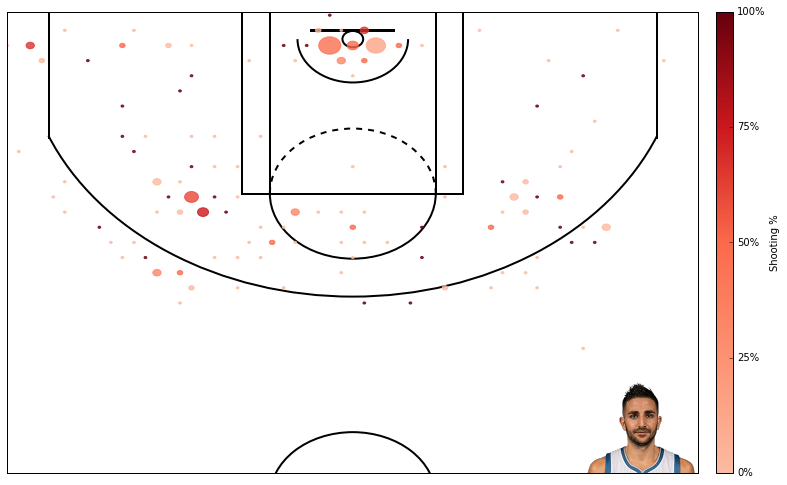
PlayerID = '201937' #ricky rubio

shot_df = aqcuire_shootingData(PlayerID,'2015-16')

ax = shooting_plot(shot_df, plot_size=(12,8));
使用 hexbin 函数也是有隐患的,第一它并没有解释由于三分线而导致的非线性特性(一些 hexbin 函数同时包括了2分和3分的投篮)。它很好的限定了一些窗口来进行3分投篮,但如果没有这个位置的硬编码就没有办法做到这一点。此外 hexbin 方法的一个优点与是可以很容易地改变窗口的数量,但不确定是否可以同样灵活的处理2分投篮和3分投篮。
另外一个隐患在于此图将所有投篮都一视同仁,这相当不公平。在禁区投篮命中40%和三分线后的投篮命中40%可是大不相同。Austin Clemens 的解决办法是将命中率与联赛平均分关联。也许过几天笔者也会实现与之类似的功能。
原文 Creating NBA Shot Charts 作者 Dan Vatterott ,本文由 OneAPM 工程师编译整理。
OneAPM 能够帮你查看 Python 应用程序的方方面面,不仅能够监控终端的用户体验,还能监控服务器性能,同时还支持追踪数据库、第三方 API 和 Web 服务器的各种问题。想阅读更多技术文章,请访问 OneAPM 官方技术博客。
本文转自 OneAPM 官方博客
如何使用 Python 创建一个 NBA 得分图?的更多相关文章
- 使用Python创建一个简易的Web Server
Python 2.x中自带了SimpleHTTPServer模块,到Python3.x中,该模块被合并到了http.server模块中.使用该模块,可以快速创建一个简易的Web服务器. 我们在C:\U ...
- 【LINUX】——linux如何使用Python创建一个web服务
问:linux如何使用Python创建一个web服务? 答:一句话,Python! 一句代码: /usr/local/bin/python -m SimpleHTTPServer 8686 > ...
- python 创建一个实例:步骤一 编写一个构造函数
编写一个构造函数 #在python中,person 类的第一件是就是记录关于人员的基本信息,这叫做实例对象属性,并且它们通常通过给类方法函数中的self 属性赋值来创建. #赋给实力属性第一个值得通常 ...
- Python创建一个简单的区块链
区块链(Blockchain)是一种分布式账本(listributed ledger),它是一种仅供增加(append-only),内容不可变(immutable)的有序(ordered)链式数据结构 ...
- Python 创建一个Django项目
1 环境搭建及创建 1) 安装Django 方法一:pip install django 方法二:Pycharm File--settings--Project--Python Interpreter ...
- Python>>>创建一个简单的3D场景
首先安装PyOpengl pip install PyOpenGL PyOpenGL_accelerate
- python创建一个线程和一个线程池
创建一个线程 1.示例代码 import time import threading def task(arg): time.sleep(2) while True: num = input('> ...
- 使用Python创建一个系统监控程序--李渣渣(lizaza.cn)
最近在做个人网站,但是由于服务器资源不足,偶尔会出现系统崩溃的现象,所以想写一个程序来实时监控系统状态.当系统资源占用过高时发送邮件提醒. psutil(进程和系统实用程序)是一个跨平台的库,用于检索 ...
- 基于python创建一个简单的HTTP-WEB服务器
背景 大多数情况下主机资源只有开发和测试相关人员可以登录直接操作,且有些特定情况"答辩.演示.远程"等这些场景下是无法直接登录主机的.web是所有终端用户都可以访问了,解决了人员权 ...
随机推荐
- 本地nginx多域名映射
前言: 工作两年多了,一直感觉技术上没有太大的长进,好多东西感觉会但是给别人讲起来的时候又感觉和没学过一样.以后希望能坚持写博客,把看过的东西都一点一滴积累下来.言归正传,今天要说的是nginx与ho ...
- oracle数据库使用之数据查询入门
1.在查询过程中使用算术表达式对数据进行运算 student表结构如下: 最后一项salary表示每个人的月薪,我现在想查询每个人的年薪: 2.使用nvl函数处理null值,向表中插入一条数据,该数据 ...
- pnd3
这两天重写了,消除后本身的下落计算还有问题,新产生的块下落和消除已经OK了.消除算法真的很要命.最后还是回归最开始的想法,用递归的方式不断的SPREAD来得到消除的数据.快到月底了,得勤写写了,要不找 ...
- git 删除配置的远程地址
删除(origin 名称需根据你本地查询出来的想删除的名字, 查询命令为 git remote -v) git remote rm origin 添加(origin 名称可根据需要添加) git re ...
- IHttpModule接口
IHttpModule向实现类提供模块初始化和处置事件. IHttpModule包含兩個方法: public void Init(HttpApplication context);public voi ...
- Nginx高并发配置思路(轻松应对1万并发量)
测试机器为腾讯云服务器1核1G内存,swap分区2G,停用除SSH外的所有服务,仅保留nginx,优化思路主要包括两个层面:系统层面+nginx层面. 一.系统层面 1.调整同时打开文件数量 ulim ...
- Mybaitis配置总结
在mybatis-config.xml中配置分页插件,插件配置必须放在mapper前面 <plugins> <plugin interceptor="com.rrtong. ...
- Linux系统ifconfig命令找不到,centos ifconfig Command not found
centos ifconfig Command not found,Linux系统ifconfig命令找不到 >>>>>>>>>>>& ...
- microchip PIC芯片使用方法
pickit3调试器使用: http://www.eeboard.com/evaluation/pickit3debug/1/ MPLAB环境使用: 1.代码折叠功能 2.代码补全功能 3.函数跳转功 ...
- mysql锁表和解锁语句分享
对于MySQL来说,有三种锁的级别:页级.表级.行级 页级的典型代表引擎为BDB. 表级的典型代表引擎为MyISAM,MEMORY以及很久以前的ISAM. 行级的典型代表引擎为INNODB. ...