基于matplotlib的数据可视化 - 笔记
1 基本绘图
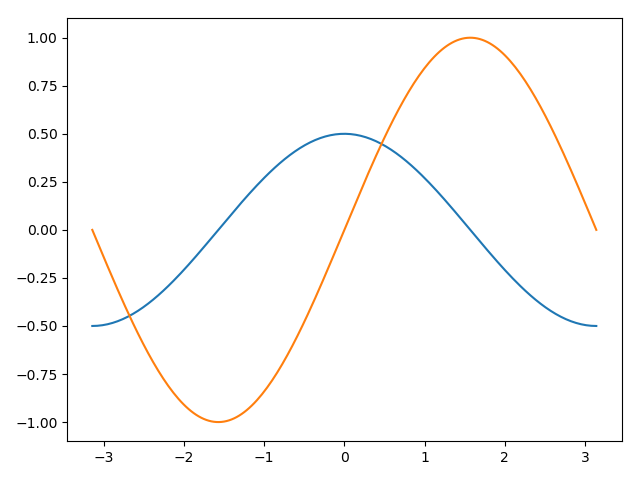
在plot()函数中只有x,y两个量时。
import numpy as np
import matplotlib.pyplot as plt

# 生成曲线上各个点的x,y坐标,然后用一段段直线连起来
# 利用linspace函数产生一个等差数列
x = np.linspace(-np.pi, np.pi, 200)
cos_y = np.cos(x) / 2
sin_y = np.sin(x)

# 用直线连接曲线上各点
plt.plot(x, cos_y)
plt.plot(x, sin_y)

# 显示图形
plt.show()
2 线属性设置
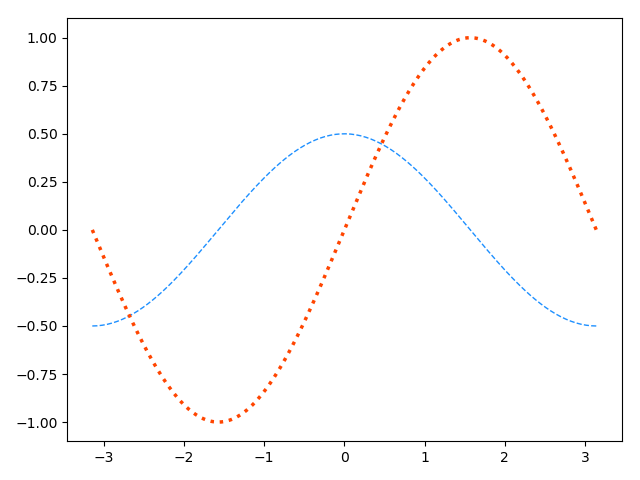
线的属性主要有线型、线宽 和 颜色 等。
import numpy as np
import matplotlib.pyplot as plt

x = np.linspace(-np.pi, np.pi, 200)

cos_y = np.cos(x) / 2
sin_y = np.sin(x)

# 用直线连接曲线上各点
plt.plot(x, cos_y, linestyle='--', linewidth=1,color='dodgerblue')
plt.plot(x, sin_y, linestyle=':', linewidth=2.5,color='orangered')

plt.show()
3 坐标轴设置
坐标轴设置主要有坐标轴范围、坐标轴名称、坐标轴刻度、十字坐标等
3.1 获取坐标轴
坐标轴的设置必须先获得坐标轴,再对坐标轴进行操作
获取坐标轴的方法:ax = plt.gca()
gca - get current axes
注意,坐标轴共有四个top、 bottom、 left、 right
3.2 获取轴并操作
先通过gca获取当前轴,再对轴进行操作
# 获取当前坐标轴对象
ax = mp.gca()
# 将上、右轴设置为none / None
ax.spines['top'].set_color('none')
ax.spines['right'].set_color('none')
当然,也可通过 ax.spines 捕捉 bottom、left 坐标轴,并进行操作
3.3 指定坐标轴位置
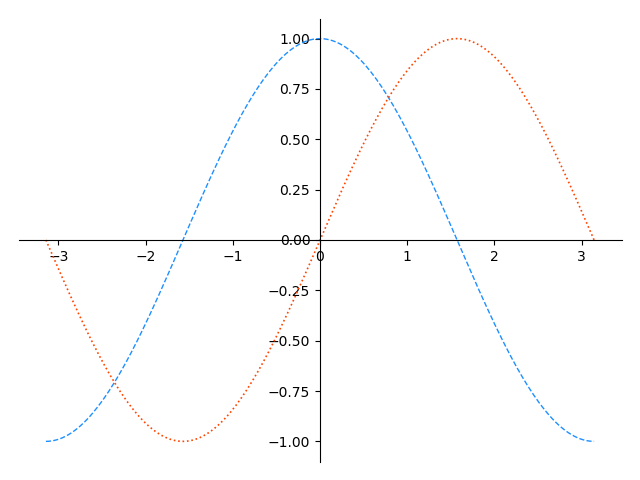
通过 set_position( (position type, amount) ) 改变 spine 位置;spine 的位置是由 (position type, amount) 来确定的
position type(amount)
(1)axis(0.0~1.0):把spine放在指定的轴坐标(Axes coordinate)上,范围值为从0.0到1.0(对应坐标自左向右);0表示最左边,1表示最右边,0.5表示中间位置
(2)data(number):把spine 放在指定的数据坐标(data coordinate)上,number的范围值与 bottom 和 top的关系 有关,0表示坐标轴上 0 值位点
(3)outward :通过specified number of points 将 spine 从数据区移出。
(3)place the spine out from the data area by the specified number of points. (Negative values specify placing the spine inward.)
例如
import numpy as np
import matplotlib.pyplot as mp

x = np.linspace(-np.pi, np.pi, 200)  # 产生一个等差数列

cos_y = np.cos(x)
sin_y = np.sin(x)

ax = mp.gca()

ax.spines['left'].set_position(('axes',0.5))
ax.spines['bottom'].set_position(('data', 0))

# 将右边框和顶边框设置成无色
ax.spines['right'].set_color('None')
ax.spines['top'].set_color('None')

# 用直线连接曲线上各点
mp.plot(x, cos_y, linestyle='--', linewidth=1,color='dodgerblue')
mp.plot(x, sin_y, linestyle=':', linewidth=1.2,color='orangered')

# 显示图形
mp.show()
(a)ax.spines['bottom'].set_position(('data', 0))
(b) ax.spines['bottom'].set_position(('data', -3))
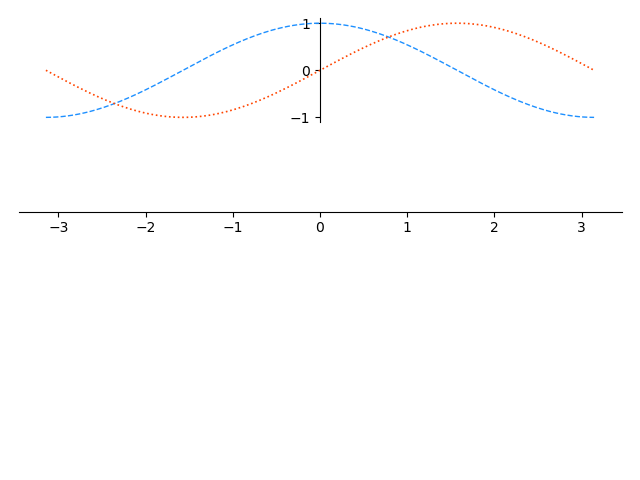
(c)ax.spines['bottom'].set_position(('data', -4))
抛出错误:
raise ValueError('bottom cannot be >= top')

ValueError: bottom cannot be >= top
在这里,由于本案例中是对称的, ax.spines['bottom'].set_position(('data', 4)) 这里 4 与 -4 是一致的,采用 -4 主要说明报错的原因 bottom cannot be >= top 想不通原因。
这里面由两个原因没搞明白:
(1)范围值(如 4 )这个值是怎么界定的,当然在3到4之间还有系列值,此处不枚举;
(2)负值向下移动,应该是bottom - > bottom,为什么会有top值(bottom cannot be >= top)。
3.4 设置坐标轴范围
设置 x 轴范围:plt.xlim(最小值,最大值)
设置 y 轴范围:plt.ylim(最小值,最大值)
3.5 设置坐标轴名称
设置 x 轴名称:plt.xlabel(' 字符串 str ')
设置 y 轴名称:plt.ylabel(' 字符串 str ')
注意:字符串如果是中文,容易出错。
3.6 设置坐标轴刻度
设置 x 轴刻度:plt.xticks(刻度标签位置,刻度标签文本)
设置 y 轴刻度:plt.yticks(刻度标签位置,刻度标签文本)
3.7 刻度定位器
set_major_locator(): 设置主刻度定位器
set_minor_locator(): 设置次刻度定位器
常见参数
NullLocator() 空,不做刻度标记
MaxNLocator() 指定最多刻度数
FixedLocator() 由参数指定刻度
AutoLocator() 默认的,自动选择最合理的刻度
IndexLocator() 根据偏移和增量定位刻度
MultipleLocator() 根据指定的距离定位刻度
LinearLocator() 根据指定的总刻度数定位刻度
LogLocator() 根据指定的底数和指数定位刻度
具体示例
import numpy as np
import matplotlib.pyplot as plt

plt.figure('Locator')
locators = [
    'plt.NullLocator()',
    'plt.MaxNLocator(nbins=3,steps=[3,5,7,9])',
    'plt.FixedLocator(locs=[0,2.5,5,7.5,10])',
    'plt.AutoLocator()',
    'plt.IndexLocator(offset=0.5, base=1.5)',
    'plt.MultipleLocator()',
    'plt.LinearLocator(numticks=21)',
    'plt.LogLocator(base=2, subs=[1.0])']
n_locators = len(locators)

for i, locator in enumerate(locators):
    plt.subplot(n_locators, 1, i + 1)
    plt.xlim(0, 10)
    plt.ylim(-1, 1)
    plt.yticks(())
    ax = plt.gca()
    ax.spines['left'].set_color('none')
    ax.spines['right'].set_color('none')
    ax.spines['top'].set_color('none')
    ax.spines['bottom'].set_position(('data', 0))
    ax.xaxis.set_major_locator(eval(locator))
    ax.xaxis.set_minor_locator(plt.MultipleLocator(0.1))
    plt.plot(np.arange(11), np.zeros(11))
    plt.text(5, 0.3, locator[3:], ha='center', size=10)

plt.tight_layout()
plt.show()

3.8 设置刻度位置
设置 x 轴的刻度值位置(下方):ax.xaxis.set_ticks_position('bottom')
设置 y 轴的刻度值位置(左侧):ax.yaxis.set_ticks_position('left')
注:ax = mp.gca()
接受值(ACCEPTS):: [ 'left' | 'right' | 'both' | 'default' | 'none' | ‘top’ | 'bottom' ]
也可以通过 top 将刻度值位置甚至在顶部
3.9 应用实例
import numpy as np
import matplotlib.pyplot as plt

# 生成曲线上各个点的x,y坐标,然后用一段段直线连起来
x = np.linspace(-np.pi, np.pi, 200)  # 产生一个等差数列

cos_y = np.cos(x) / 2
sin_y = np.sin(x)

# 设置坐标范围
plt.xlim(x.min() * 1.1, x.max() * 1.1)
plt.ylim(min(cos_y.min(), sin_y.min()) * 1.1,
        max(cos_y.max(), sin_y.max()) * 1.1)

# 设置坐标轴刻度标签
plt.xticks([-np.pi, -np.pi / 2, 0, np.pi / 2, np.pi * 3 / 4, np.pi],
          [r',
           r'$\frac{\pi}{2}$', r'$\frac{3\pi}{4}$', r'$\pi$'])
plt.yticks([-1, -0.5, 0.5, 1])

# 将矩形坐标轴改成十字坐标轴:
# 获取当前坐标轴对象
ax = plt.gca()  # get current axis

# 将垂直坐标刻度置于左边框
ax.yaxis.set_ticks_position('left')

# 将左边框置于数据坐标原点
ax.spines['left'].set_position(('data', 0))

# 将水平坐标刻度置于底边框
ax.xaxis.set_ticks_position('bottom')

# 将底边框置于数据坐标原点
ax.spines['bottom'].set_position(('data', 0))

# 将右边框和顶边框设置成无色
ax.spines['right'].set_color('None')
ax.spines['top'].set_color('None')

# 用直线连接曲线上各点
plt.plot(x, cos_y, linestyle='--', linewidth=1,
        color='dodgerblue')
plt.plot(x, sin_y, linestyle=':', linewidth=1.2,
        color='orangered')

# 显示图形
plt.show()
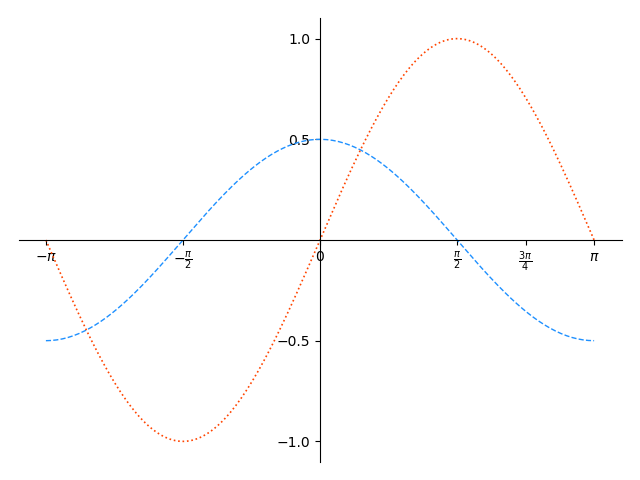
import numpy as np
import matplotlib.pyplot as plt

# 生成曲线上各个点的x,y坐标,然后用一段段直线连起来
x = np.linspace(-np.pi, np.pi, 200)  # 产生一个等差数列

cos_y = np.cos(x) / 2
sin_y = np.sin(x)

# 设置坐标范围
plt.xlim(x.min() * 1.1, x.max() * 1.1)
plt.ylim(min(cos_y.min(), sin_y.min()) * 1.1,
        max(cos_y.max(), sin_y.max()) * 1.1)

# 设置坐标轴刻度标签
plt.xticks([-np.pi, -np.pi / 2, 0, np.pi / 2, np.pi * 3 / 4, np.pi],
          [r',
           r'$\frac{\pi}{2}$', r'$\frac{3\pi}{4}$', r'$\pi$'])
plt.yticks([-1, -0.5, 0.5, 1])

# 将矩形坐标轴改成十字坐标轴:
# 获取当前坐标轴对象
ax = plt.gca()  # get current axis

# 将垂直坐标刻度置于左边框
ax.yaxis.set_ticks_position('none')

# 将左边框置于数据坐标原点
ax.spines['left'].set_position(('data', 0))

# 将水平坐标刻度置于底边框
ax.xaxis.set_ticks_position('none')

# 将底边框置于数据坐标原点
ax.spines['bottom'].set_position(('data', 0))

# 将右边框和顶边框设置成无色
ax.spines['right'].set_color('None')
ax.spines['top'].set_color('None')

# 用直线连接曲线上各点
plt.plot(x, cos_y, linestyle='--', linewidth=1,
        color='dodgerblue')
plt.plot(x, sin_y, linestyle=':', linewidth=1.2,
        color='orangered')

# 显示图形
plt.show()
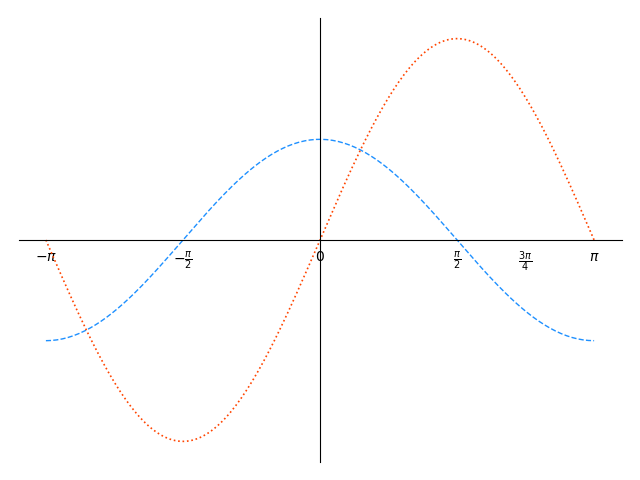
4 显示图例
图例,简而言之,图中对象的标签。
语法:legend(*args, **kwargs)
Call signatures有三种不同的用法
(1)legend()
(2)legend(labels)
(3)legend(handles, labels)
4.1 自动检测图例中的元素 legend()
line, = ax.plot([1, 2, 3], label='Inline label')
ax.legend()
注:
(1)Inline label 内联标签是在图例中显示的名字,需要修改。
(2)line = 与 line, = 是不同的,
当line = 时,[<matplotlib.lines.Line2D object at 0x000001FE32137CF8>]
也即返回值类型为 matplotlib.lines.Line2D object
当line, = 时,Line2D($y=\frac{1}{2}cos(x)$)
(3)既然存在存在line, = 时, 那会不会存在第二个呢,line_one, line_two = 时,会报错
ValueError: not enough values to unpack (expected 2, got 1)
4.2 标注绘图元素 legend(label)
为已存在的图创建图例,每一个图按顺序对应
ax.plot([1, 2, 3])   # 线1
ax.plot([-1, -2, -3]) # 线2
ax.legend([‘line_one', 'line_two'])
注:这种方式的“ 顺序对应 ” ,很容以被混淆easily be mixed up,所以不建议采用
4.3 显示定义图例中的元素legend(handles, labels)
Explicitly defining the elements in the legend
该方法可以有效避免图例与图的混淆关系,
line1, = ax.plot(y1)
line2, = ax.plot(y2)
plt.legend((line1, line2), ('label1', 'label2'))
4.4 在plt.plot()函数中定义label
该种方式不是帮助文档中的内容,但该方式更为简便
ax.plot(y1, label = ' 图例文本1 ')
ax.plot(y2, label = ' 图例文本2 ')
plt.legend()
# plt.legend(loc='图例位置 如 upper left')
4.5 图例函数的语法及设置
matplotlib.pyplot.legend(*args, **kwargs)
这个可以整理一下,目前先学会图例与图的对应显示,图例的位置,
整理时参考:
()matplotlib命令与格式:图例legend语法及设置
()python画图matplotlib的Legend(显示图中的标签)
4.5.1 位置信息loc
默认loc属性值为 “ upper right ”
当然用户可以通过int 、string、或pair of float 定义 legend 的位置
===============   =============
Location String   Location Code
===============   =============
'best'            0
'upper right'     1
'upper left'      2
'lower left'      3
'lower right'     4
'right'           5
'center left'     6
'center right'    7
'lower center'    8
'upper center'    9
'center'          10
===============   =============
5 在图中增加散点
5.1 基本语法
函数scatter() 是在图中绘制散点图的工具
plt.scatter(x,y[,...])
x, y - 位置坐标点,array_like , shape(n, )
在[ ... ] 中的可选参数,optional
s=None, 散点的半径,scalar or array_like, shape (n, ),
若 s = 10, 表示点的半径均为10
若 s = [1, 10],表示与 (x, y) 对应点坐标的大小
c=None, 颜色标记,默认为为B, sequence, or sequence of color,适用多种(4种)标记方式
zoder = default, 从字面意思可知是Z轴的叠放顺序,值越大,越靠上,没查资料,default值不知道。不过为了好看,可以将其设置大一些。散点位于最上面。
marker=None,
cmap=None,(作用是)映射的关键码。
cmap 仅在 c 为浮点数数组(an array of floats,可以把整数数组当成特殊的浮点数数组,在下面的示例中整数数组也可以使用) 时使用
perceptual uniform sequential colormaps:感知均匀的序列化 colormap
sequential colormaps:序列化(连续化)色图 colormap
gray:0-255 级灰度,0:黑色,1:白色,黑底白字;
gray_r:翻转 gray 的显示,如果 gray 将图像显示为黑底白字,gray_r 会将其显示为白底黑字;
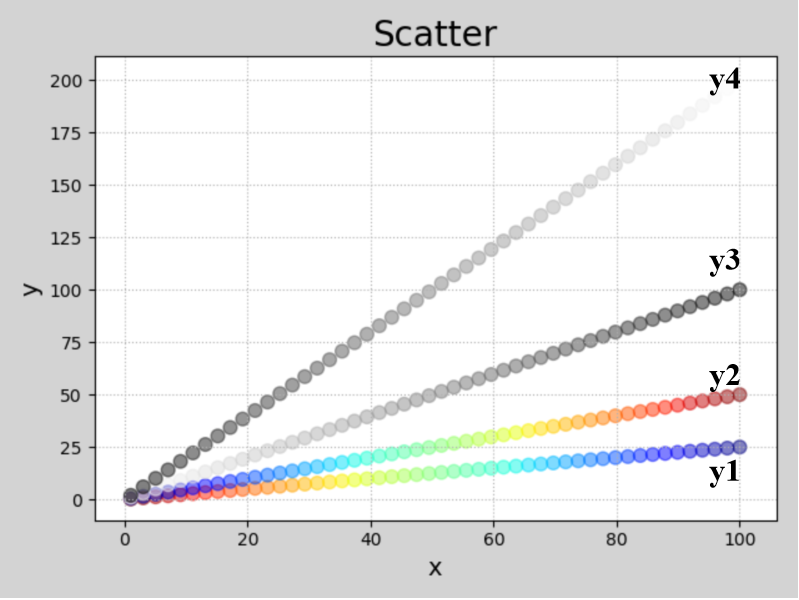
另外还有一种颜色表,在matlab中,imagesc函数绘制彩图时默认的颜色表为 jet (蓝色 --> 红色 ) 。不同的颜色代表高程、振幅等信息,以便于直观分析数据特征。
mabplotlib中的jet与matlab中的jet类似,cmap = ‘jet’,时,小则为蓝,愈大愈红。cmap = ‘jet_r’时则意味数值与对应颜色的反转。
与此对应的取值范围c没有找到,也没有测算出来,当使用np.nan时,该对应点消逝。
注:在下面代码测算时,只要不是np.nan,无论取值大小如何变化,最终的得到的图形颜色(肉眼分辨范围)未改变,初步猜测可能是系统先将值分为进行“端值”匹配对应,然后再等分匹配对应。
参考:colormap中的Jet 颜色倒转、什么是好的颜色表(colormap)?、matplotlib 可视化 —— cmap(colormap)
import numpy as np
import matplotlib.pyplot as plt

# 尽管在此用range与np.linspace等效,
# 但scatter散点函数要求x y的长度一致时,np.linspace的优势就表现出现了,
# 可以直接选择点的个数
# 同时实际用的时候np.linspace的报错率低
# 如在使用range时,x * 2 就会报错。
# TypeError: unsupported operand type(s) for *: 'range' and 'int'
# x = range(1, 100, 2)
x = np.linspace(1,100,50)
y1 = x * 0.25
y2 = x * 0.5
y3 = x * 1
y4 = x * 2
d = np.linspace(1,10000,50)

plt.figure('Scatter', facecolor='lightgray')
plt.title('Scatter', fontsize=20)
plt.xlabel('x', fontsize=14)
plt.ylabel('y', fontsize=14)
plt.tick_params(labelsize=10)
plt.grid(linestyle=':')
plt.scatter(x, y1, s=60, c=d, cmap='jet_r', alpha=0.5)
plt.scatter(x, y2, s=60, c=d, cmap='jet', alpha=0.5)
plt.scatter(x, y3, s=60, c=d, cmap='gray_r', alpha=0.5)
plt.scatter(x, y4, s=60, c=d, cmap='gray', alpha=0.5)

plt.show()
norm=None,
vmin=None,
vmax=None,
alpha=None,
linewidths=None,
verts=None,
edgecolors=None,
hold=None,
data=None,
**kwargs
Help on function scatter in module matplotlib.pyplot:

scatter(x, y, s=None, c=None, marker=None, cmap=None, norm=None, vmin=None, vmax=None, alpha=None, linewidths=None, verts=None, edgecolors=None, hold=None, data=None, **kwargs)
    A scatter plot of *y* vs *x* with varying marker size and/or color.

    Parameters
    ----------
    x, y : array_like, shape (n, )
        The data positions.

    s : scalar or array_like, shape (n, ), optional
        The marker size in points**2.
        Default is ``rcParams['lines.markersize'] ** 2``.

    c : color, sequence, or sequence of color, optional, default: 'b'
        The marker color. Possible values:

        - A single color format string.
        - A sequence of color specifications of length n.
        - A sequence of n numbers to be mapped to colors using *cmap* and
          *norm*.
        - A 2-D array in which the rows are RGB or RGBA.

        Note that *c* should not be a single numeric RGB or RGBA sequence
        because that is indistinguishable from an array of values to be
        colormapped. If you want to specify the same RGB or RGBA value for
        all points, use a 2-D array with a single row.

    marker : `~matplotlib.markers.MarkerStyle`, optional, default: 'o'
        The marker style. *marker* can be either an instance of the class
        or the text shorthand for a particular marker.
        See `~matplotlib.markers` for more information marker styles.

    cmap : `~matplotlib.colors.Colormap`, optional, default: None
        A `.Colormap` instance or registered colormap name. *cmap* is only
        used if *c* is an array of floats. If ``None``, defaults to rc
        ``image.cmap``.

    norm : `~matplotlib.colors.Normalize`, optional, default: None
        A `.Normalize` instance is used to scale luminance data to 0, 1.
        *norm* is only used if *c* is an array of floats. If *None*, use
        the default `.colors.Normalize`.

    vmin, vmax : scalar, optional, default: None
        *vmin* and *vmax* are used in conjunction with *norm* to normalize
        luminance data. If None, the respective min and max of the color
        array is used. *vmin* and *vmax* are ignored if you pass a *norm*
        instance.

    alpha : scalar, optional, default: None
        The alpha blending value, between 0 (transparent) and 1 (opaque).

    linewidths : scalar or array_like, optional, default: None
        The linewidth of the marker edges. Note: The default *edgecolors*
        is 'face'. You may want to change this as well.
        If *None*, defaults to rcParams ``lines.linewidth``.

    verts : sequence of (x, y), optional
        If *marker* is *None*, these vertices will be used to construct
        the marker.  The center of the marker is located at (0, 0) in
        normalized units.  The overall marker is rescaled by *s*.

    edgecolors : color or sequence of color, optional, default: 'face'
        The edge color of the marker. Possible values:

        - 'face': The edge color will always be the same as the face color.
        - 'none': No patch boundary will be drawn.
        - A matplotib color.

        For non-filled markers, the *edgecolors* kwarg is ignored and
        forced to 'face' internally.

    Returns
    -------
    paths : `~matplotlib.collections.PathCollection`

    Other Parameters
    ----------------
    **kwargs : `~matplotlib.collections.Collection` properties

    See Also
    --------
    plot : To plot scatter plots when markers are identical in size and
        color.

    Notes
    -----

    * The `.plot` function will be faster for scatterplots where markers
      don't vary in size or color.

    * Any or all of *x*, *y*, *s*, and *c* may be masked arrays, in which
      case all masks will be combined and only unmasked points will be
      plotted.

    * Fundamentally, scatter works with 1-D arrays; *x*, *y*, *s*, and *c*
      may be input as 2-D arrays, but within scatter they will be
      flattened. The exception is *c*, which will be flattened only if its
      size matches the size of *x* and *y*.

    .. note::
        In addition to the above described arguments, this function can take a
        **data** keyword argument. If such a **data** argument is given, the
        following arguments are replaced by **data[<arg>]**:

        * All arguments with the following names: 'c', 'color', 'edgecolors', 'facecolor', 'facecolors', 'linewidths', 's', 'x', 'y'.
help(plt.scatter)
查看参数可知,其可以设置一个值,表示所有点的属性均统一为该值,也可通过array_like为每一个散点分配属性值。
具体属性值可查看帮助文档,此不枚举细列。
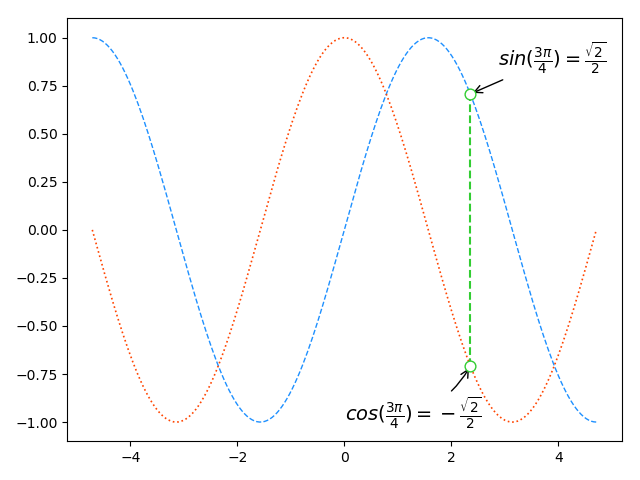
5.2 示例一
mport numpy as np
import matplotlib.pyplot as plt

x = np.linspace(-np.pi*1.5,np.pi*1.5,200)
sin_y = np.sin(x)
cos_y = np.cos(x)

# 计算特殊点的坐标
xo = np.pi * 3 / 4
sin_yo = np.sin(xo)
cos_yo = np.cos(xo)

plt.plot(x, sin_y, linestyle='--', linewidth=1,color='dodgerblue')
plt.plot(x, cos_y, linestyle=':', linewidth=1.2,color='orangered')

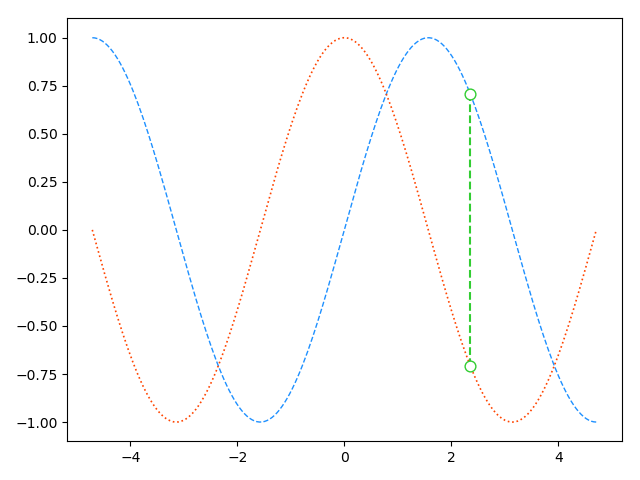
# 绘制特殊点
# plot(x,y)绘制一条线,x值[xo,xo],y值[cos_yo,sin_yo],
# 实际上将两个坐标点(xo, cos_yo), (xo, sin_yo)连接起来
plt.plot([xo, xo], [cos_yo, sin_yo],
         linestyle='--',color='limegreen')
# 绘制
plt.scatter([xo, xo], [cos_yo, sin_yo],
            s=60,edgecolor='limegreen',
            facecolor='white',zorder=10)
# 显示图形
plt.show()
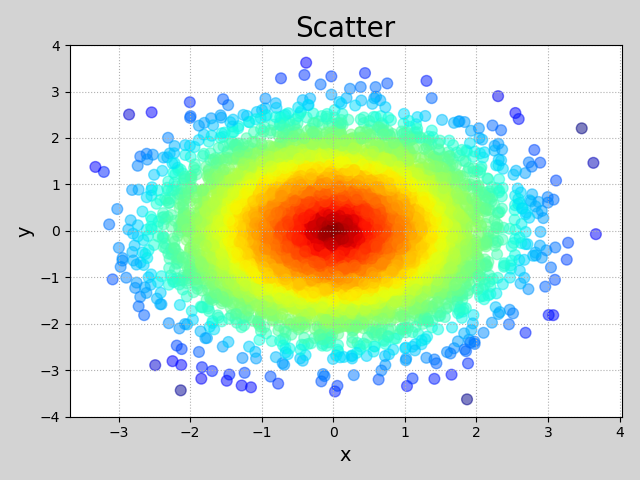
5.3 示例2
import numpy as np
import matplotlib.pyplot as plt

n = 10000
# 产生均值为0标准差为1区间的n个服从正态分布的随机数
x = np.random.normal(0, 1, n)
y = np.random.normal(0, 1, n)

# 获取颜色的分布对应值
c_color = np.sqrt(x**2 + y**2)
print(d)
plt.figure('Scatter', facecolor='lightgray')
plt.title('Scatter', fontsize=20)
plt.xlabel('x', fontsize=14)
plt.ylabel('y', fontsize=14)
plt.tick_params(labelsize=10)
plt.grid(linestyle=':')
plt.scatter(x, y, s=60, c=c_color, cmap='jet_r', alpha=0.5)

plt.show()
6 图中添加注释annotate
对点 xy 进行文本注释
plt.annotate(
    '注释文本',字符串str
    xy=被注释点的坐标,序列,数组,可迭代对象iterable
    xycoords=被注释点的坐标属性,相对位置,有每一个属性值对应位置描述
    xytext=注释文本的坐标,若无,则默认xy坐标点
    textcoords=注释文本坐标的属性,
    fontsize=字体大小,
    arrowprops=dict(arrowstyle=箭头形状,connectionstyle=箭头连线的风格)
)
内容较多,可查看帮助文档
import numpy as np
import matplotlib.pyplot as plt

x = np.linspace(-np.pi*1.5,np.pi*1.5,200)
sin_y = np.sin(x)
cos_y = np.cos(x)

# 计算特殊点的坐标
xo = np.pi * 3 / 4
sin_yo = np.sin(xo)
cos_yo = np.cos(xo)

plt.plot(x, sin_y, linestyle='--', linewidth=1,color='dodgerblue')
plt.plot(x, cos_y, linestyle=':', linewidth=1.2,color='orangered')

# 绘制特殊点
# plot(x,y)绘制一条线,x值[xo,xo],y值[cos_yo,sin_yo],
# 实际上将两个坐标点(xo, cos_yo), (xo, sin_yo)连接起来
plt.plot([xo, xo], [cos_yo, sin_yo],
         linestyle='--',color='limegreen')
# 绘制
plt.scatter([xo, xo], [cos_yo, sin_yo],
            s=60,edgecolor='limegreen',
            facecolor='white',zorder=10)

# 添加注释
plt.annotate(
    r'$cos(\frac{3\pi}{4})=-\frac{\sqrt{2}}{2}$',
    xy=(xo, cos_yo), xycoords='data',
    xytext=(-90, -40), textcoords='offset points',
    fontsize=14, arrowprops=dict(
        arrowstyle='->', connectionstyle='arc3, rad=0.2'))

plt.annotate(
    r'$sin(\frac{3\pi}{4})=\frac{\sqrt{2}}{2}$',
    xy=(xo, sin_yo), xycoords='data',
    xytext=(20, 20), textcoords='offset points',
    fontsize=14, arrowprops=dict(
        arrowstyle='->', connectionstyle='arc3, rad=0'))

# 显示图形
plt.show()
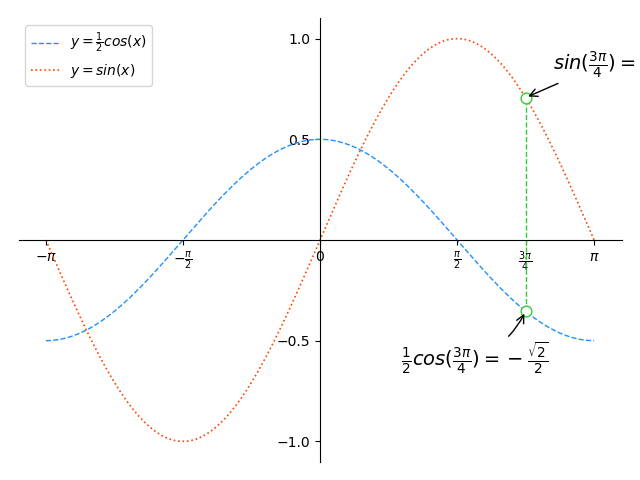
7 实例
生成如下图的代码

import numpy as np
import matplotlib.pyplot as plt

# 生成曲线上各个点的x,y坐标,然后用一段段直线连起来
x = np.linspace(-np.pi, np.pi, 200)  # 产生一个等差数列

cos_y = np.cos(x) / 2
sin_y = np.sin(x)

# 计算特殊点的坐标
xo = np.pi * 3 / 4
yo_cos = np.cos(xo) / 2
yo_sin = np.sin(xo)

# 设置坐标范围
plt.xlim(x.min() * 1.1, x.max() * 1.1)
plt.ylim(min(cos_y.min(), sin_y.min()) * 1.1,
        max(cos_y.max(), sin_y.max()) * 1.1)

# 设置坐标轴刻度标签
plt.xticks([-np.pi, -np.pi / 2, 0, np.pi / 2, np.pi * 3 / 4, np.pi],
          [r',
           r'$\frac{\pi}{2}$', r'$\frac{3\pi}{4}$', r'$\pi$'])

# plt.yticks([])
plt.yticks([-1, -0.5, 0.5, 1])

# 将矩形坐标轴改成十字坐标轴:
# 获取当前坐标轴对象
ax = plt.gca()  # get current axis

# 将垂直坐标刻度置于左边框
ax.yaxis.set_ticks_position('left')

# 将左边框置于数据坐标原点
ax.spines['left'].set_position(('data', 0))

# 将水平坐标刻度置于底边框
ax.xaxis.set_ticks_position('bottom')

# 将底边框置于数据坐标原点
ax.spines['bottom'].set_position(('data', 0))

# 将右边框和顶边框设置成无色
ax.spines['right'].set_color('none')
ax.spines['top'].set_color('none')

# 用直线连接曲线上各点
plt.plot(x, cos_y, linestyle='--', linewidth=1,
        color='dodgerblue', label=r'$y=\frac{1}{2}cos(x)$')
plt.plot(x, sin_y, linestyle=':', linewidth=1.2,
        color='orangered', label=r'$y=sin(x)$')

# 绘制特殊点
plt.plot([xo, xo], [yo_cos, yo_sin], linestyle='--',
        linewidth=1, color='limegreen')
plt.scatter([xo, xo], [yo_cos, yo_sin], s=60,
           edgecolor='limegreen', facecolor='white',
           zorder=3)

# 添加注释
plt.annotate(
    r'$\frac{1}{2}cos(\frac{3\pi}{4})=-\frac{\sqrt{2}}{2}$',
    xy=(xo, yo_cos), xycoords='data',
    xytext=(-90, -40), textcoords='offset points',
    fontsize=14, arrowprops=dict(
        arrowstyle='->', connectionstyle='arc3, rad=0.2'))

plt.annotate(
    r'$sin(\frac{3\pi}{4})=\frac{\sqrt{2}}{2}$',
    xy=(xo, yo_sin), xycoords='data',
    xytext=(20, 20), textcoords='offset points',
    fontsize=14, arrowprops=dict(
        arrowstyle='->', connectionstyle='arc3, rad=0'))

plt.legend(loc='upper left')

# 显示图形
plt.show()
基于matplotlib的数据可视化 - 笔记的更多相关文章
- 基于matplotlib的数据可视化(图形填充fill fill_between) - 笔记(二)
区域填充函数有 fill(*args, **kwargs) 和fill_between() 1 绘制填充多边形fill() 1.1 语法结构 fill(*args, **kwargs) args - ...
- 基于matplotlib的数据可视化 - 饼状图pie
绘制饼状图的基本语法 创建数组 x 的饼图,每个楔形的面积由 x / sum(x) 决定: 若 sum(x) < 1,则 x 数组不会被标准化,x 值即为楔形区域面积占比.注意,该种情况会出现 ...
- 基于matplotlib的数据可视化 - 热图imshow
热图: Display an image on the axes. 可以用来比较两个矩阵的相似程度 mp.imshow(z, cmap=颜色映射,origin=垂直轴向) imshow( X, cma ...
- 基于matplotlib的数据可视化 - 等高线 contour 与 contourf
contour 与contourf 是绘制等高线的利器. contour - 绘制等高线 contourf - 填充等高线 两个的返回值值是一样的(return values are the sam ...
- 基于matplotlib的数据可视化 -
matplotlib.pyplot(as mp or as plt)提供基于python语言的绘图函数 引用方式: import matplotlib.pyplot as mp / as plt 本章 ...
- 基于matplotlib的数据可视化 - 三维曲面图gca
1 语法 ax = plt.gca(projection='3d')ax.plot_surface(x,y,z,rstride=行步距,cstride=列步距,cmap=颜色映射) gca(**kwa ...
- 基于matplotlib的数据可视化 - 柱状图bar
柱状图bar 柱状图常用表现形式为: plt.bar(水平坐标数组,高度数组,宽度比例,ec=勾边色,c=填充色,label=图例标签) 注:当高度值为负数时,柱形向下 1 语法 bar(*args, ...
- matplotlib实现数据可视化
一篇matplotlib库的学习博文.matplotlib对于数据可视化非常重要,它完全封装了MatLab的所有API,在python的环境下和Python的语法一起使用更是相得益彰. 一.库的安装和 ...
- 使用 jupyter-notebook + python + matplotlib 进行数据可视化
上次用 python 脚本中定期查询数据库,监视订单变化,将时间与处理完成订单的数量进行输入写入日志,虽然省掉了人为定时查看数据库并记录的操作,但是数据不进行分析只是数据,要让数据活起来! 为了方便看 ...
随机推荐
- 使用Snap.svg类库实现的抖动式的幻灯播放效果
在线演示 本地下载 这个幻灯中,使用了SVG来生成具有动画弧度的幻灯背景效果,如果你在项目中能够支持现代浏览器的话,尝试一下这个效果吧,很赞! 想了解基础使用,观看这个轻视频吧:Snap.svg处理和 ...
- 创建mysql数据库并指定编码
xplanner的readme.txt里有句话“XPlanner has only been tested on mysql 4.x, myslq 5.0, Tomcat 5.x, java 1.4, ...
- NUMA总结。
vsphere 5.1性能最佳实践http://www.vmware.com/pdf/Perf_Best_Practices_vSphere5.1.pdf vNUMA 要求:硬件版本8以上. 1.整个 ...
- Centos下安装gcc
虚拟机安装了一个CentOS7,发现没有gcc,通过以下命令安装: yum install gcc yum install gcc-c++
- linux中的 IO端口映射和IO内存映射
参考自:http://blog.csdn.net/zyhorse2010/article/details/6590488 CPU地址空间 (一)地址的概念 1)物理地址:CPU地址总线传来的地址,由硬 ...
- sync_binlog
sync_binlogMySQL提供一个sync_binlog参数来控制数据库的binlog刷到磁盘上去.虽然binlog也有binlog cache,但是MySQL并没有控制binlog cache ...
- 整合Tomcat和Nginx实现动静态负载均衡
转载请注明原文地址:http://www.cnblogs.com/ygj0930/p/6386135.html Nginx与tomcat整合可以实现服务器的负载均衡. 在用户的请求发往服务器进行处理时 ...
- JAVA的驼峰和下划线互转帮助类
实体类: import java.io.Serializable; import lombok.AllArgsConstructor; import lombok.Data; import lombo ...
- Linux环境变量加载顺序
01.环境变量文件描述 /etc/profile: 此文件为系统的每个用户设置环境信息,当用户第一次登录时,该文件被执行,并从/etc/profile.d目录的配置文件中搜集shell的设置./etc ...
- centos6.5关闭ipv6
万境归空,道法自然 1.在/etc/modprobe.d/目录下增加一个新的配置文件ipv6.conf cat << EOF > /etc/modprobe.d/ipv6.confa ...
