prometheus 监控ElasticSearch核心指标
ES监控方案
本文主要讲述使用 Prometheus监控ES,梳理核心监控指标并构建 Dashboard ,当集群有异常或者节点发生故障时,可以根据性能图表以高效率的方式进行问题诊断,再对核心指标筛选添加告警。
根据《How to monitor Elasticsearch performance》一文中的介绍:
Elasticsearch本身提供了大量的指标,可以帮助我们进行故障预检,并在遇到诸如节点不可用、JVM OutOfMemoryError和垃圾回收时间过长等问题时采取必要措施。 通常需要监控的几个关键领域是:
- 查询和索引(indexing)性能
- 内存分配和垃圾回收
- 主机级别的系统和网络指标
- 集群健康状态和节点可用性
- 资源饱和度和相关错误
梳理promethues官方的提供的ElasticSearch exporter提供的核心metrics监控以上关键领域
集群健康和节点可用性
通过cluster healthAPI可以获取集群的健康状况,可以把集群的健康状态当做是集群平稳运行的重要信号,一旦状态发生变化则需要引起重视;API返回的一些重要参数指标及对应的prometheus监控项如下
| 返回参数 | 备注 | metric name |
|---|---|---|
| status | 集群状态,green( 所有的主分片和副本分片都正常运行)、yellow(所有的主分片都正常运行,但不是所有的副本分片都正常运行)red(有主分片没能正常运行) | elasticsearch_cluster_health_status |
| number_of_nodes/number_of_data_nodes | 集群节点数/数据节点数 | elasticsearch_cluster_health_number_of_nodes/data_nodes |
| active_primary_shards | 活跃的主分片总数 | elasticsearch_cluster_health_active_primary_shards |
| active_shards | 活跃的分片总数(包括复制分片) | elasticsearch_cluster_health_active_shards |
| relocating_shards | 当前节点正在迁移到其他节点的分片数量,通常为0,集群中有节点新加入或者退出时该值会增加 | elasticsearch_cluster_health_relocating_shards |
| initializing_shards | 正在初始化的分片 | elasticsearch_cluster_health_initializing_shards |
| unassigned_shards | 未分配的分片数,通常为0,当有节点的副本分片丢失该值会增加 | elasticsearch_cluster_health_unassigned_shards |
| number_of_pending_tasks | 只有主节点能处理集群级元数据的更改(创建索引,更新映射,分配分片等),通过pending-tasks API可以查看队列中等待的任务,绝大部分情况下元数据更改的队列基本上保持为零 |
elasticsearch_cluster_health_number_of_pending_tasks |
依据上述监控项,配置集群状态Singlestat面板,健康状态一目了然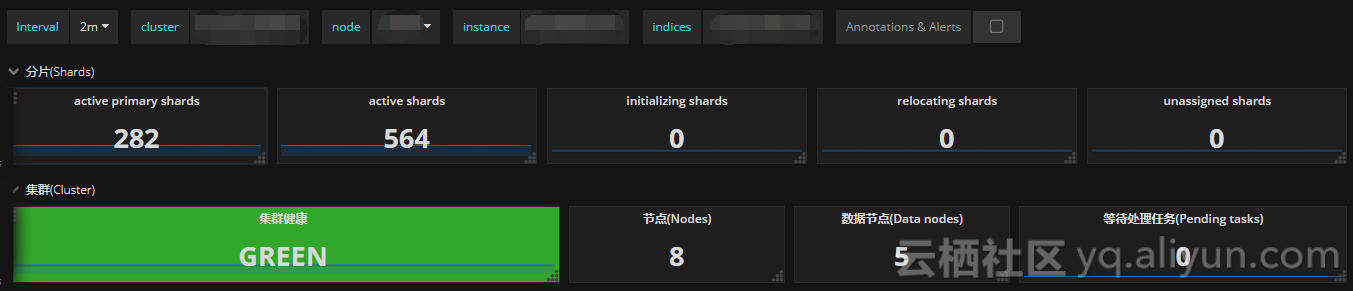
主机级别的系统和网络指标
| metric name | description |
|---|---|
| elasticsearch_process_cpu_percent | Percent CPU used by process CPU使用率 |
| elasticsearch_filesystem_data_free_bytes | Free space on block device in bytes 磁盘可用空间 |
| elasticsearch_process_open_files_count | Open file descriptors ES进程打开的文件描述符 |
| elasticsearch_transport_rx_packets_total | Count of packets receivedES节点之间网络入流量 |
| elasticsearch_transport_tx_packets_total | Count of packets sentES节点之间网络出流量 |
如果CPU使用率持续增长,通常是由于大量的搜索或索引工作造成的负载。可能需要添加更多的节点来重新分配负载。
文件描述符用于节点间的通信、客户端连接和文件操作。如果打开的文件描述符达到系统的限制(一般Linux运行每个进程有1024个文件描述符,生产环境建议调大65535),新的连接和文件操作将不可用,直到有旧的被关闭。
如果ES集群是写负载型,建议使用SSD盘,需要重点关注磁盘空间使用情况。当segment被创建、查询和合并时,Elasticsearch会进行大量的磁盘读写操作。
节点之间的通信是衡量群集是否平衡的关键指标之一,可以通过发送和接收的字节速率,来查看集群的网络正在接收多少流量。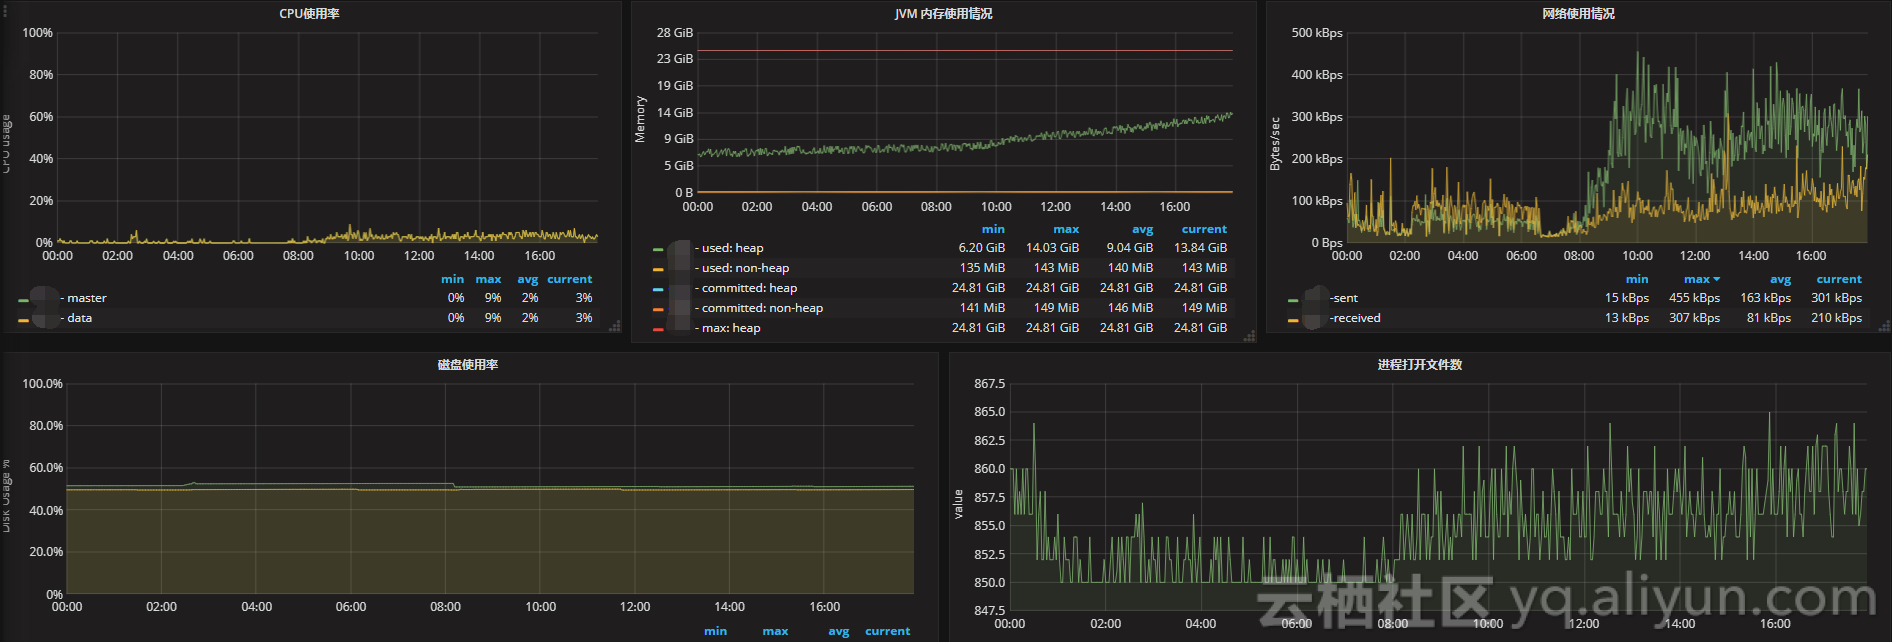
JVM内存和垃圾回收
| metric name | description |
|---|---|
| elasticsearch_jvm_gc_collection_seconds_count | Count of JVM GC runs垃圾搜集数 |
| elasticsearch_jvm_gc_collection_seconds_sum | GC run time in seconds垃圾回收时间 |
| elasticsearch_jvm_memory_committed_bytes | JVM memory currently committed by area最大使用内存限制 |
| elasticsearch_jvm_memory_used_bytes | JVM memory currently used by area 内存使用量 |
主要关注JVM Heap 占用的内存以及JVM GC 所占的时间比例,定位是否有 GC 问题。Elasticsearch依靠垃圾回收来释放堆栈内存,默认当JVM堆栈使用率达到75%的时候启动垃圾回收,添加堆栈设置告警可以判断当前垃圾回收的速度是否比产生速度快,若不能满足需求,可以调整堆栈大小或者增加节点。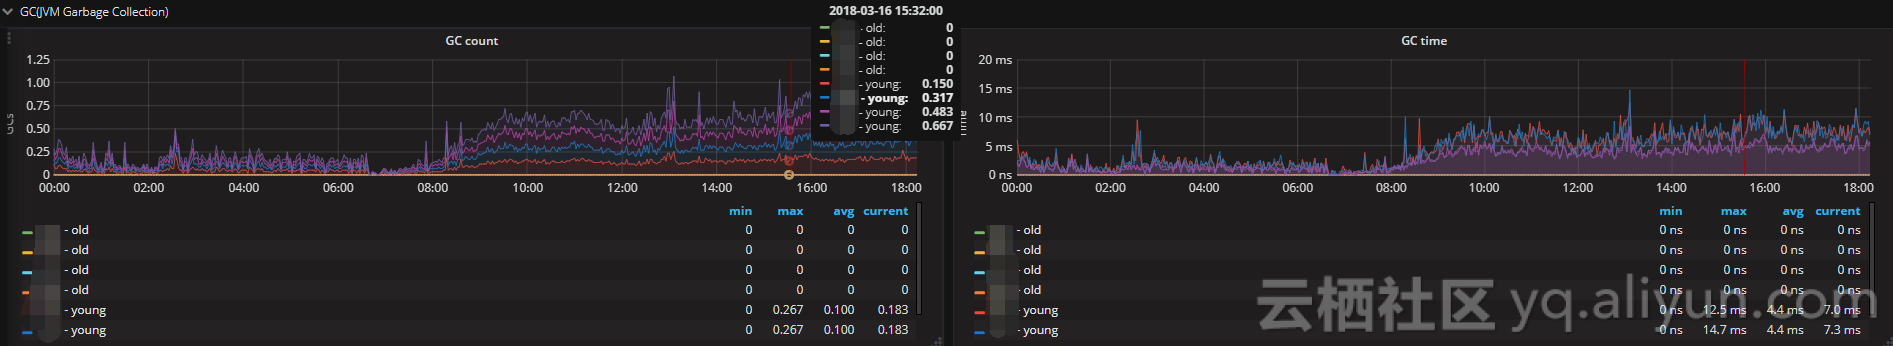
搜索和索引性能
搜索请求
| metric name | description |
|---|---|
| elasticsearch_indices_search_query_total | query总数 |
| elsticsearch_indices_search_query_time_seconds | query时间 |
| elasticsearch_indices_search_fetch_total | fetch总数 |
| elasticsearch_indices_search_fetch_time_seconds | fetch时间 |
索引请求
| metric name | description |
|---|---|
| elasticsearch_indices_indexing_index_total | Total index calls索引index数 |
| elasticsearch_indices_indexing_index_time_seconds_total | Cumulative index time in seconds累计index时间 |
| elasticsearch_indices_refresh_total | Total time spent refreshing in second refresh时间 |
| elasticsearch_indices_refresh_time_seconds_total | Total refreshess refresh数 |
| elasticsearch_indices_flush_total | Total flushes flush数 |
| elasticsearch_indices_flush_time_seconds | Cumulative flush time in seconds累计flush时间 |
将时间和操作数画在同一张图上,左边y轴显示时间,右边y轴显示对应操作计数,ops/time查看平均操作耗时判断性能是否异常。通过计算获取平均索引延迟,如果延迟不断增大,可能是一次性bulk了太多的文档。
Elasticsearch通过flush操作将数据持久化到磁盘,如果flush延迟不断增大,可能是磁盘IO能力不足,如果持续下去最终将导致无法索引数据。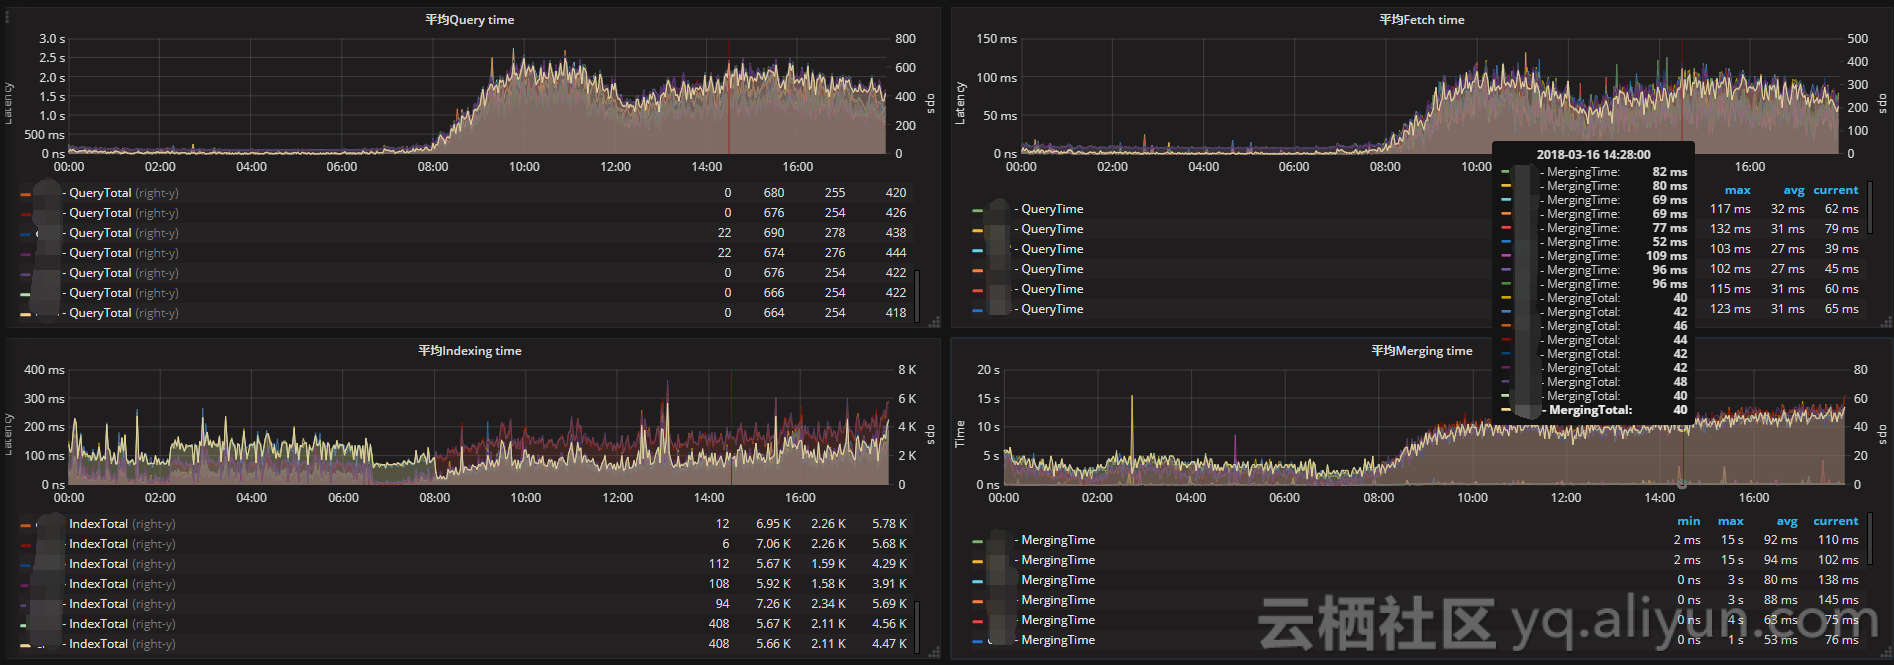
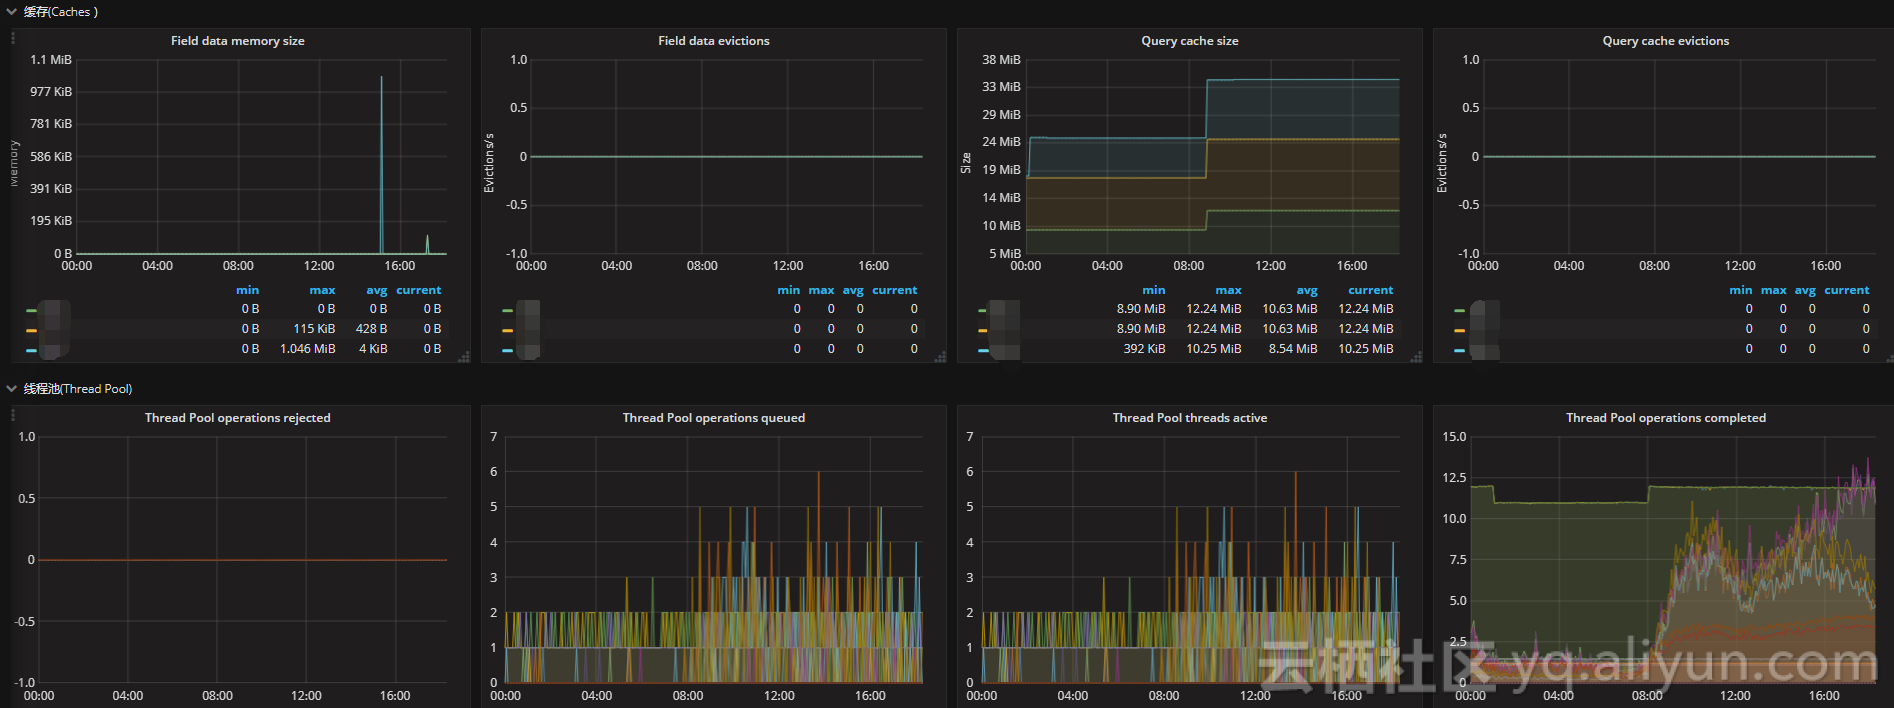
资源饱和度
| metric name | description |
|---|---|
| elasticsearch_thread_pool_queue_count | Thread Pool operations queued 线程池中排队的线程数 |
| elasticsearch_thread_pool_rejected_count | Thread Pool operations rejected 线程池中被拒绝的线程数 |
| elasticsearch_indices_fielddata_memory_size_bytes | Field data cache memory usage in bytes fielddata缓存的大小 |
| elasticsearch_indices_fielddata_evictions | Evictions from filter cache fielddata缓存的驱逐次数 |
| elasticsearch_indices_filter_cache_memory_size_bytes | Filter cache memory usage in bytes 过滤器高速缓存的大小 |
| elasticsearch_indices_filter_cache_evictions | Evictions from filter cache 过滤器缓存的驱逐次数 |
| elasticsearch_cluster_health_number_of_pending_tasks | Cluster level changes which have not yet been executed 待处理任务数 |
| elasticsearch_indices_get_missing_total | Total get missing 丢失文件的请求数 |
| elasticsearch_indices_get_missing_time_seconds | Total time of get missing in seconds 文档丢失的请求时间 |
通过采集以上指标配置视图,Elasticsearch节点使用线程池来管理线程对内存和CPU使用。可以通过请求队列和请求被拒绝的情况,来确定节点是否够用。
每个Elasticsearch节点都维护着很多类型的线程池。一般来讲,最重要的几个线程池是搜索(search),索引(index),合并(merger)和批处理(bulk)。
每个线程池队列的大小代表着当前节点有多少请求正在等待服务。一旦线程池达到最大队列大小(不同类型的线程池的默认值不一样),后面的请求都会被线程池拒绝。
prometheus 监控ElasticSearch核心指标的更多相关文章
- Prometheus监控elasticsearch集群(以elasticsearch-6.4.2版本为例)
部署elasticsearch集群,配置文件可"浓缩"为以下: cluster.name: es_cluster node.name: node1 path.data: /app/ ...
- Prometheus监控node-exporter常用指标含义
一.说明 最近使用Prometheus新搭建监控系统时候发现内存采集时centos6和centos7下内存监控指标采集计算公式不相同,最后采用统一计算方法并整理计算公式如下: 1 100-(node_ ...
- prometheus 监控elasticsearch
1.安装: 如果有elk单独用户,切换到该用户下, wget下载,进入到es安装目录,执行 ./elasticsearch-plugin install file://$(pwd)/../../ela ...
- 基于 prometheus 的微服务指标监控
基于prometheus的微服务指标监控 服务上线后我们往往需要对服务进行监控,以便能及早发现问题并做针对性的优化,监控又可分为多种形式,比如日志监控,调用链监控,指标监控等等.而通过指标监控能清晰的 ...
- Kubernetes 监控:Prometheus Adpater =》自定义指标扩缩容
使用 Kubernetes 进行容器编排的主要优点之一是,它可以非常轻松地对我们的应用程序进行水平扩展.Pod 水平自动缩放(HPA)可以根据 CPU 和内存使用量来扩展应用,前面讲解的 HPA 章节 ...
- Kubernetes 系列(五):Prometheus监控框架简介
由于容器化和微服务的大力发展,Kubernetes基本已经统一了容器管理方案,当我们使用Kubernetes来进行容器化管理的时候,全面监控Kubernetes也就成了我们第一个需要探索的问题.我们需 ...
- Prometheus 监控领域最锋利的“瑞士军刀”
原文:https://mp.weixin.qq.com/s/Cujn6_4w8ZcXCOWpoAStvQ 一.Kubernetes 容器监控的标配—Prometheus 1.简介 Prometheus ...
- Kubernetes集群部署史上最详细(二)Prometheus监控Kubernetes集群
使用Prometheus监控Kubernetes集群 监控方面Grafana采用YUM安装通过服务形式运行,部署在Master上,而Prometheus则通过POD运行,Grafana通过使用Prom ...
- Prometheus监控学习笔记之Prometheus不完全避坑指南
0x00 概述 Prometheus 是一个开源监控系统,它本身已经成为了云原生中指标监控的事实标准,几乎所有 k8s 的核心组件以及其它云原生系统都以 Prometheus 的指标格式输出自己的运行 ...
随机推荐
- GXOI/GZOI2019部分题解
D1T1:与或和 对每位处理,问题变成所有内部不包含0/1的矩阵的个数,单调栈维护即可. #include<cstdio> #include<algorithm> #inclu ...
- VS.NET(C#)--2.9_HTML服务器控件案例
HTML服务区控件案例 UI设计视图 UI源码视图 <>
- Dev GridControl 子集合标题
显示效果: 设置: this.gridView3.OptionsView.ShowViewCaption = true; this.gridView3.ViewCaption = "资产明细 ...
- 【转载】腾讯云安全组如何开放3306端口让Mysql可访问
Mysql数据库的默认端口号为3306,在服务器安装好Mysql数据库后,如果使用的服务器是阿里云或者腾讯云服务器,如果在后台启用了安全组功能,则需要在安全组中对3306端口的入站规则进行放行,只有在 ...
- Django学习笔记 (一) 开发环境配置
Django是一个开放源代码的Web应用框架,由Python写成. 采用了MVC的软件设计模式,即模型M,视图V和控制器C. 1. Python安装 下载地址: http://www.python.o ...
- 多个div并排不换行
1.所有div的父元素不换行 white-space: nowrap; 2.所有div设置为行内元素 display: inline-block; 基于java记账管理系统[尚学堂·百战程序员]
- Ipython 和 python 的区别
IPython是一个python交互shell,它比默认的python shell更易于使用.它支持自动变量完成.自动缩进.bash shell命令,并且内置了许多有用的函数和函数. IPython是 ...
- setTimeout()方法和setInterval()方法
setTimeout方法: 定义和用法: setTimeout() 方法用于在指定的毫秒数后调用函数或计算表达式. tip: 1000 毫秒= 1 秒. tip: 如果你只想重复执行可以使用setI ...
- FreeRTOS 中断配置和临界段
中断屏蔽寄存器 PRIMASK.FAULTMASK和BASEPRI 1.PRIMASK:这是个只有1个位的寄存器.当它置1时, 就关掉所有可屏蔽的异常,只剩下 NMI和硬fault可以响应.它的缺省值 ...
- STM8 LED
时钟分频寄存器(CLK_CKDIVR) 举例 int main() { CLK_HSIPrescalerConfig(CLK_PRESCALER_HSIDIV1); //高速内部时钟1分频 GPIO_ ...