使用xdebug对php做性能分析调优
作为PHP程序员我们或多或少都了解或使用过xdebug。此文章记录安装和配置xdebug,以及如何使用它来分析php程序。
我的机器环境:
mac,php
安装 xdebug
推荐使用 pecl 安装扩展
pecl install xdebug

注:可以选择版本, https://pecl.php.net/package/xdebug
启用和配置
如果不知道php的配置文件,可以用 php --ini 查看
启用 xdebug,添加一个独立的 ext-xdebug.ini 到 php 的配置目录
[xdebug]

zend_extension="xdebug.so"

# profiler功能的开关,默认值0,如果设为1,则每次请求都会生成一个性能报告文件。

# xdebug.profiler_enable=0

# 默认值是0,如果设为1 则当我们的请求中包含 XDEBUG_PROFILE 参数时才会生成性能报告文件

xdebug.profiler_enable_trigger=1

# 分析文件保存目录, 默认是 /var/tmp

xdebug.profiler_output_dir="/var/tmp/xdebug"
现在使用 php -m 能看到 xdebug,并且使用 php --ri xdebug 能看到配置项都生效就ok了。
访问并生成分析文件
使用 fpm 要重启,扩展才能生效
现在我们可以访问php项目,记得在请求参数带上 XDEBUG_PROFILE, 类似 http://127.0.0.1:5671/my?XDEBUG_PROFILE
ok, 现在xdebug应该已经在我们配置的分析文件保存目录产生了文件, 类似
% ll /var/tmp/xdebug

-rw-r--r--  1 user  group    48K  4 29 13:40 cachegrind.out.37947
生成的分析文件直接查看是难以阅读的。所以我们要使用分析查看工具
分析查看工具
使用qcachegrind
要查看分析图表,需要安装 graphviz:
brew install graphviz
安装qcachegrind
brew install qcachegrind
在命令行里使用 qcachegrind 打开它,然后通过它打开要分析的文件。
也可以在命令后直接跟要分析的文 qcachegrind /var/tmp/xdebug/cachegrind.out.37947
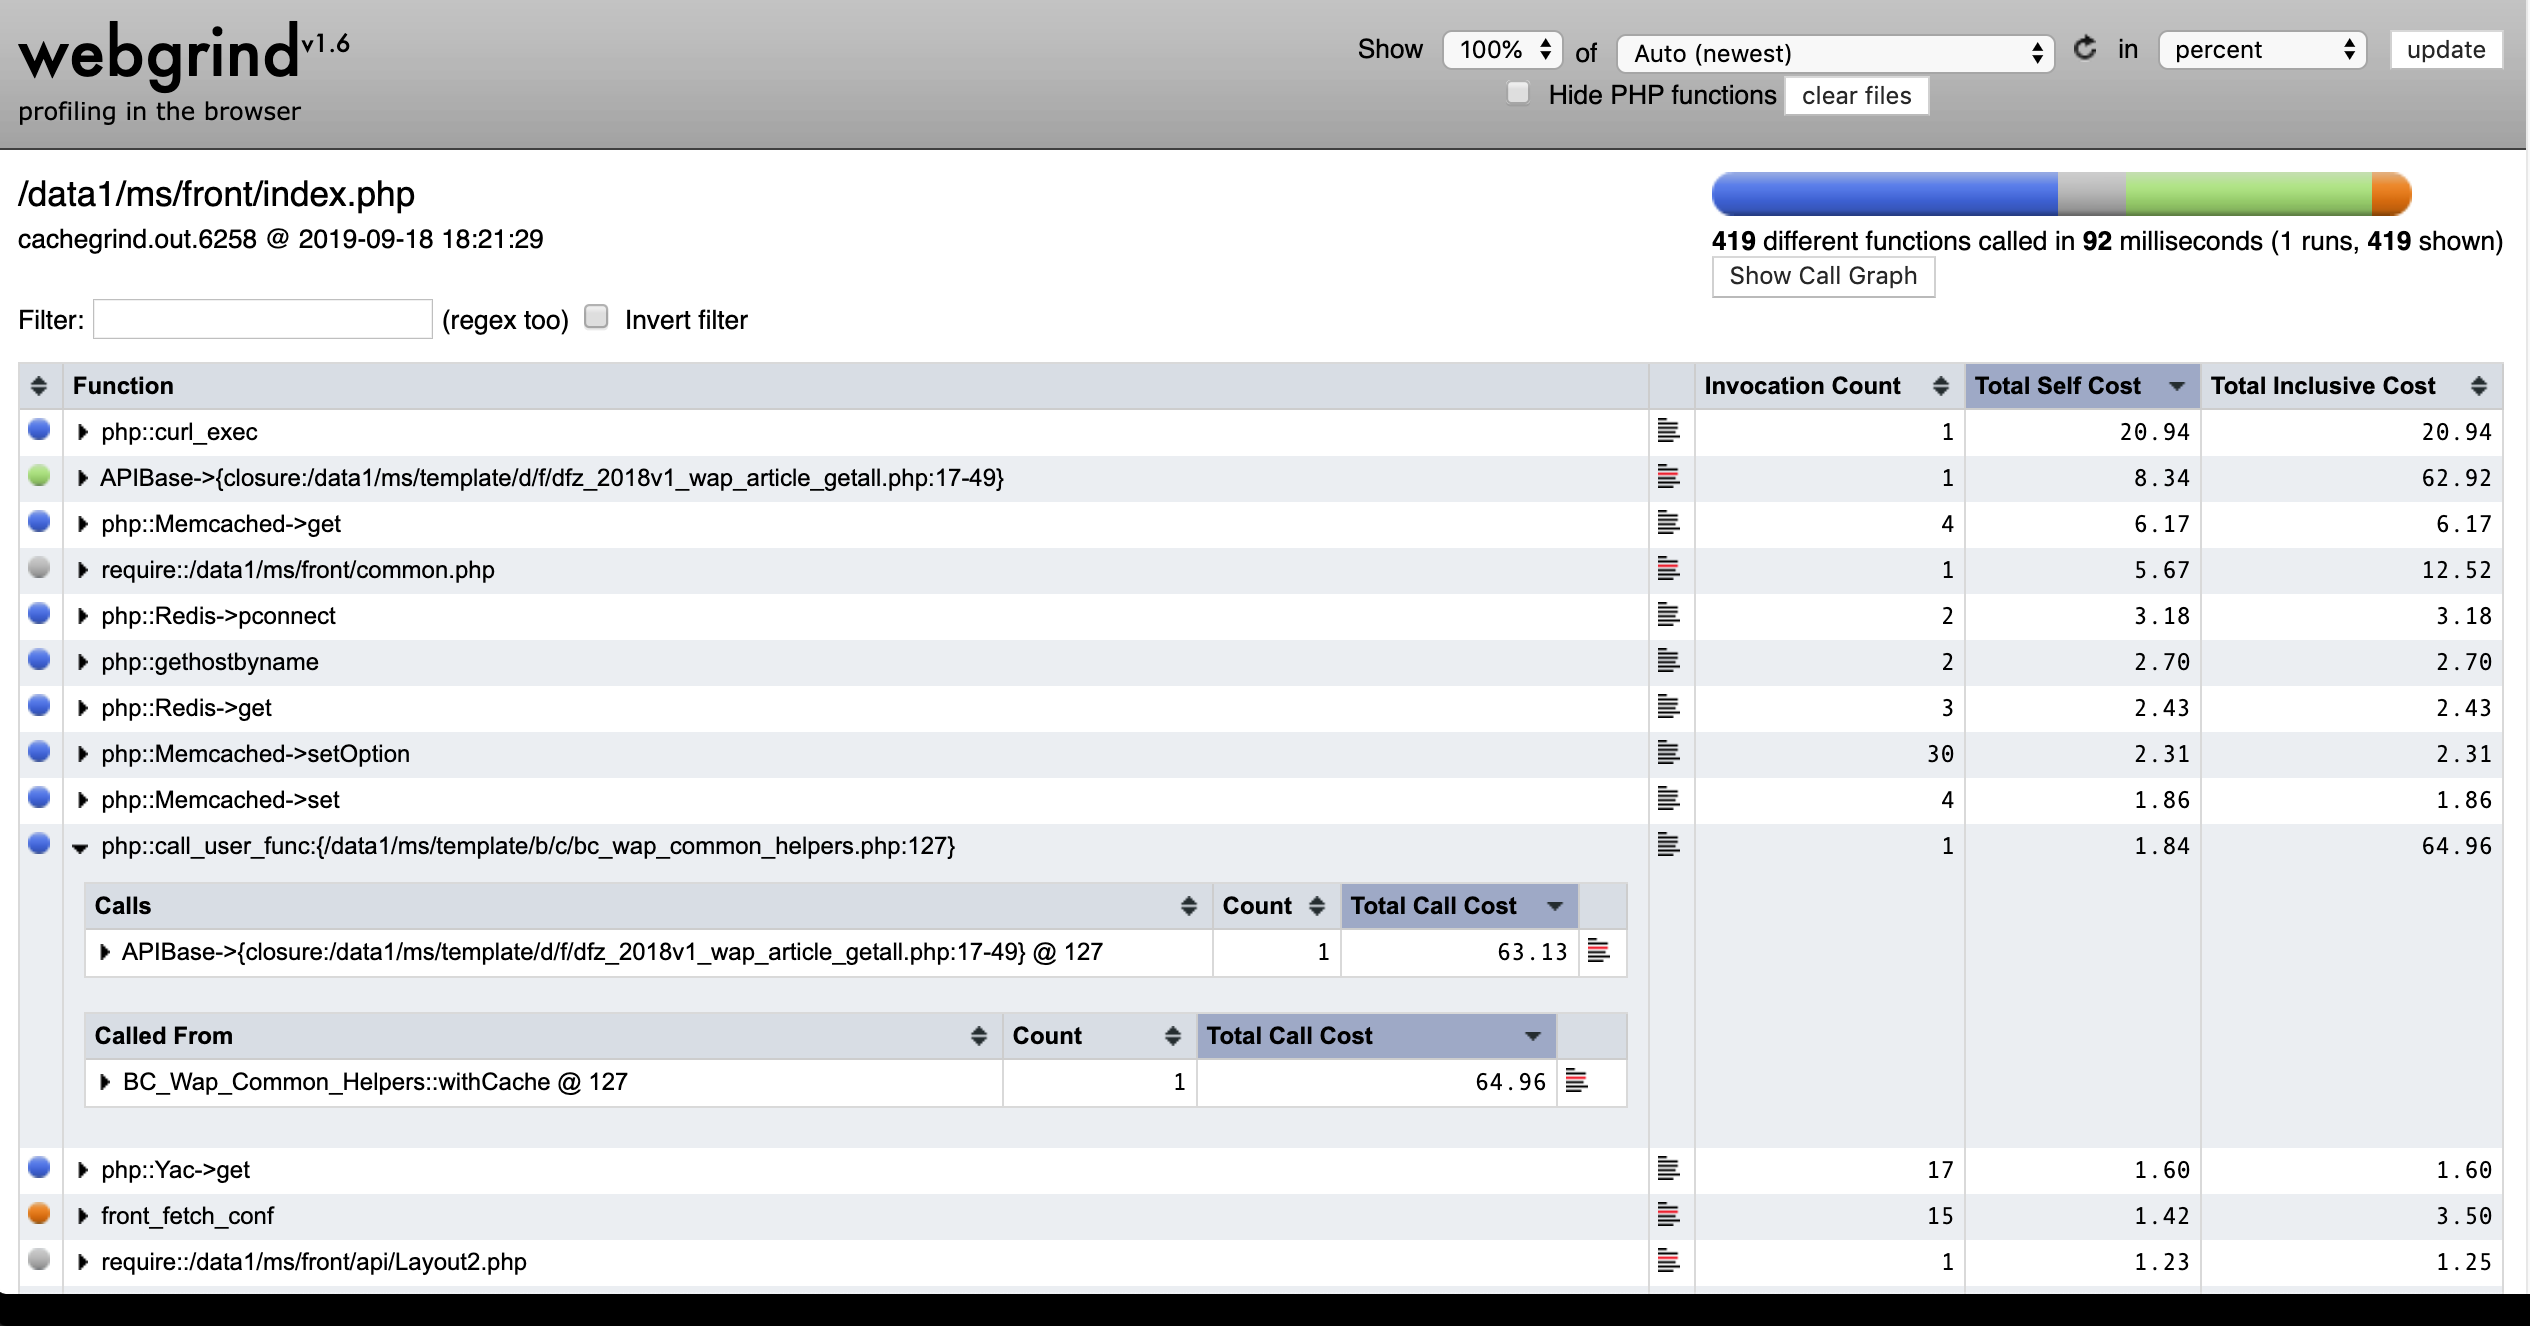
使用webgrind
下载: https://github.com/jokkedk/webgrind
要查看分析图表,同样需要安装 graphviz.
分析的时候 "Call Graph" 功能用不了
- 方法 1
sudo ln -s /usr/local/bin/dot /usr/bin/dot
- 方法 2 修改
config.php
    /**

     * Path to graphviz dot executable

     */

    static $dotExecutable = '/usr/local/bin/dot';

    // static $dotExecutable = '/usr/bin/dot';
运行:
php -S 0.0.0.0:80 index.php
现在,你可以访问: http://localhost


使用xdebug对php做性能分析调优的更多相关文章
- mysql性能瓶颈分析、性能指标、指标搜集方法与性能分析调优工具
本文主要讲解mysql的性能瓶颈分析.性能指标.性能指标信息的搜集工具与方法.分析调优工具的使用. 文章尚未完成. 性能瓶颈: 慢.写速度比读速度慢很多 主要的性能指标: 访问频度, 并发连接量, ...
- Linux性能分析调优工具介绍
1.常用性能分析工具 1)CPU性能分析工具 vmstat ps sar time strace pstree top 2)Memory性能分析工具 vmstat strace top ipcs ip ...
- Linux 性能分析调优 (四)——案例篇:系统中出现大量不可中断进程和僵尸进程怎么办
之前讲到 CPU 使用率的类型.除了上一节提到的用户 CPU 之外,它还包括系统 CPU(比如上下文切换).等待 I/O 的 CPU(比如等待磁盘的响应)以及中断 CPU(包括软中断和硬中断)等. 在 ...
- PHPStorm 初遇 Xdebug (xdebug代码调试及性能分析)
centos 7 下PHP7安装xdebug # 下载xdebug wget https://xdebug.org/files/xdebug-2.7.2.tgz # 解压 tar -xf xdebug ...
- Python:用pyinstrument做性能分析
导引 在计算密集型计算或一些Web应用中,我们常常需要对代码做性能分析.在Python中,最原始的方法即是使用time包中的time函数(该函数以秒为计时单位): from time import s ...
- chrome使用Timeline做性能分析
使用Timeline做性能分析 Timeline面板记录和分析了web应用运行时的所有活动情况,这是研究和查找性能问题的最佳途径.###Timeline面板概览 Timeline面板主要有三个部分构成 ...
- 《linux性能及调优指南》 3.5 网络瓶颈
3.5 Network bottlenecks A performance problem in the network subsystem can be the cause of many prob ...
- 《Linux 性能及调优指南》写在后面的话
感谢飞哥的翻译. 目前飞哥 (http://hi.baidu.com/imlidapeng)的网址已经不能访问了. <Linux 性能及调优指南>这本书的原文地址:http://www.r ...
- Linux服务器性能查看分析调优
一 linux服务器性能查看 1.1 cpu性能查看 1.查看物理cpu个数: cat /proc/cpuinfo |grep "physical id"|sort|uniq|wc ...
随机推荐
- DV型、OV型、EV型证书的主要区别
DV型和OV型证书的区别 DV和OV型证书最大的差别是:DV型证书不包含企业名称信息:而OV型证书包含企业名称信息,以下是两者差别对比表: DV OV 包含企业名称信息 否 是 验证公司名称 ...
- JS高阶---原型面试
测试1: 分析如下 结果如下: 测试2: 测试3: 测试4: .
- 在springboot或者ssm框架或者类似的框架中VO、DTO、DO、PO的概念、区别和用处
该文章主要讨论我们开发过程当中会经常用到的对象:VO.DTO.DO.PO;由于项目和每个人的命名习惯,这里只是对这些概念进行阐述.概念: VO(View Object):视图对象,用于展示层,它的作用 ...
- 简单python爬虫实例
先放上url,https://music.douban.com/chart 这是豆瓣的一个音乐排行榜,这里爬取了左边部分的歌曲排行榜部分,爬虫很简单,就用到了beautifulsoup和request ...
- python -m pip install --upgrade pip
升级pip后报错 TypeError: 'module' object is not callable 原因 存在两个版本的pip 先把原先版本的卸载了: python -m pip uninstal ...
- zz姚班天才少年鬲融凭非凸优化研究成果获得斯隆研究奖
姚班天才少年鬲融凭非凸优化研究成果获得斯隆研究奖 近日,美国艾尔弗·斯隆基金会(The Alfred P. Sloan Foundation)公布了2019年斯隆研究奖(Sloan Research ...
- 微信小程序实现图片放大预览效果
可以直接用微信程序自己的api很方便的实现 核心方法 wx.previewImage: 直接上代码, wxml: <!--pages/prewpicture/prew.wxml--> &l ...
- Push to origin/master was rejected
在IDEA中往码云上传项目的时候出现了如下的错误:Push to origin/master was rejected 因为我是把代码上传到一个新的仓库里面,所以第一次提交的时候和仓库里面的东西不同步 ...
- 求职-DB相关职位常见face题
数据分析是个通用技能,适合各行各业,比如运营.产品.分析等职位都会要求会数据分析. 一.考察对数据分析岗位的理解与职业规划 数据分析师与数据工程师的区别在哪里? 为什么转行, 为什么没在公司内部转岗? ...
- Scrapy框架详解
Python网络爬虫Scrapy框架研究 Scrapy1.0教程 Scrapy笔记(1)- 入门篇 Scrapy笔记(2)- 完整示例 Scrapy笔记(3)- Spider详解 Scrapy笔记(4 ...