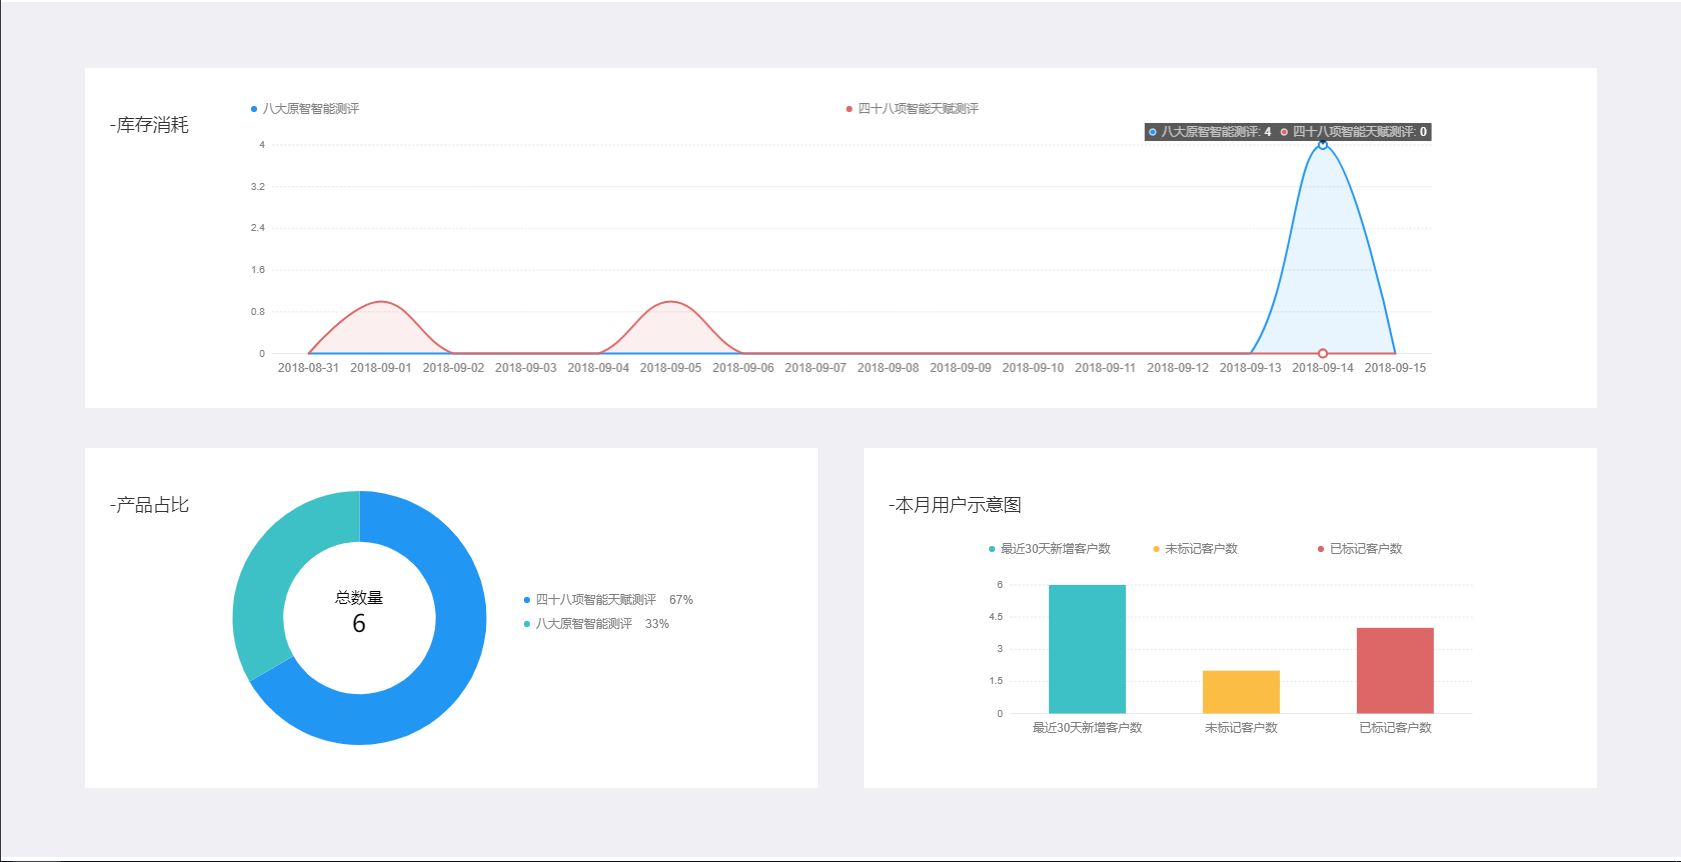
Chart图表整合——面积对比图、扇形图、柱状图
一. chart图表demo网址
网址:http://antv.alipay.com/zh-cn/f2/3.x/demo/index.html
二. 本文主要对面积对比图,扇形图,柱状图三大常见图进行介绍
效果图如下:
html代码:
<!DOCTYPE html>

<html lang="en" dir="ltr">

    <head>

        <meta charset="utf-8">

        <title>demo</title>

        <link rel="stylesheet" href="css/index.css" />

        <script src="js/jquery-3.3.1.min.js"></script>

        <script type="text/javascript" src="js/chart.js" ></script>

        <script src="https://gw.alipayobjects.com/os/antv/assets/f2/3.2.1/f2.min.js"></script>

        <script src="https://gw.alipayobjects.com/os/antv/assets/lib/lodash-4.17.4.min.js"></script>

        <script src="https://gw.alipayobjects.com/os/rmsportal/NjNldKHIVQRozfbAOJUW.js"></script>

    </head>

    <body>

        <div class="instrument-panel">

              <div class="panel-con">

                     <div class="panel-linear">

                              <canvas id="linear"></canvas>

                              <div class="consumption">

                                    <p>-库存消耗</p>

                              </div>

                     </div>

                     <div class="panel-other">

                              <div class="panel-pancake">

                                     <canvas id="mountNode"></canvas>

                                     <div class="product-proportion">

                                              <p>-产品占比</p>

                                     </div>

                              </div>

                              <div class="panel-columnar">

                                     <canvas id="columnar"></canvas>

                                     <div class="user-map">

                                              <p>-本月用户示意图</p>

                                     </div>

                              </div>

                     </div>

              </div>

        </div>

    </body>

</html>
我们在html页面内加入三个画布标签canvas,插入面积对比图,扇形图,柱状图;
css代码:
.instrument-panel{

    display: flex;

    flex-direction: column;

    align-items: center;

}

.instrument-panel .panel-con{

    width: 90%;

    height: 720px;

    display: flex;

    flex-direction: column;

    align-items: center;

    margin: 65px 0px;

}

.instrument-panel .panel-con .panel-linear{

    width: 100%;

    height: 340px;

    background-color: #fff;

    margin-bottom: 40px;

    display: flex;

    align-items: center;

    justify-content: center;

    position: relative;

}

.panel-linear .consumption{

    position: absolute;

    left: 24px;

    top: 44px;

    color: #333;

    font-size: 18px;

}

.panel-linear canvas{

    width: 80%;

    height: 300px;

}

.instrument-panel .panel-con .panel-other{

    width: 100%;

    height: 340px;

    display: flex;

    flex-direction: row;

    align-items: center;

    justify-content: space-between;

}

.panel-con .panel-other .panel-pancake{

    width: 48.5%;

    height: 340px;

    background-color: #fff;

    display: flex;

    align-items: center;

    justify-content: center;

    position: relative;

}

.panel-pancake canvas{

    width: 70%;

    height: 340px;

}

.panel-pancake .product-proportion{

    position: absolute;

    left: 24px;

    top: 44px;

    color: #333;

    font-size: 18px;

}

.panel-con .panel-other .panel-columnar{

    width: 48.5%;

    height: 340px;

    background-color: #fff;

    display: flex;

    align-items: center;

    justify-content: center;

    position: relative;

}

.panel-columnar canvas{

    width: 70%;

    height: 220px;

    margin-top: 40px;

}

.panel-columnar .user-map{

    position: absolute;

    left: 24px;

    top: 44px;

    color: #333;

    font-size: 18px;

}
重点来了,我们使用ajax接口数据实时监测数据的变化,并呈现在图表上面
三. 接口数据形式
1.面积对比图:
{"state": 200, "result": [{"goodsId": 1, "sum": 0, "creatTime": "2018-08-31"}, {"goodsId": 2, "sum": 0, "creatTime": "2018-08-31"}, {"goodsId": 1, "sum": 0, "creatTime": "2018-09-01"}, {"goodsId": 2, "sum": 1, "creatTime": "2018-09-01"}, {"goodsId": 1, "sum": 0, "creatTime": "2018-09-02"}, {"goodsId": 2, "sum": 0, "creatTime": "2018-09-02"}, {"goodsId": 1, "sum": 0, "creatTime": "2018-09-03"}, {"goodsId": 2, "sum": 0, "creatTime": "2018-09-03"}, {"goodsId": 1, "sum": 0, "creatTime": "2018-09-04"}, {"goodsId": 2, "sum": 0, "creatTime": "2018-09-04"}, {"goodsId": 1, "sum": 0, "creatTime": "2018-09-05"}, {"goodsId": 2, "sum": 1, "creatTime": "2018-09-05"}, {"goodsId": 1, "sum": 0, "creatTime": "2018-09-06"}, {"goodsId": 2, "sum": 0, "creatTime": "2018-09-06"}, {"goodsId": 1, "sum": 0, "creatTime": "2018-09-07"}, {"goodsId": 2, "sum": 0, "creatTime": "2018-09-07"}, {"goodsId": 1, "sum": 0, "creatTime": "2018-09-08"}, {"goodsId": 2, "sum": 0, "creatTime": "2018-09-08"}, {"goodsId": 1, "sum": 0, "creatTime": "2018-09-09"}, {"goodsId": 2, "sum": 0, "creatTime": "2018-09-09"}, {"goodsId": 1, "sum": 0, "creatTime": "2018-09-10"}, {"goodsId": 2, "sum": 0, "creatTime": "2018-09-10"}, {"goodsId": 1, "sum": 0, "creatTime": "2018-09-11"}, {"goodsId": 2, "sum": 0, "creatTime": "2018-09-11"}, {"goodsId": 1, "sum": 0, "creatTime": "2018-09-12"}, {"goodsId": 2, "sum": 0, "creatTime": "2018-09-12"}, {"goodsId": 1, "sum": 0, "creatTime": "2018-09-13"}, {"goodsId": 2, "sum": 0, "creatTime": "2018-09-13"}, {"goodsId": 1, "sum": 4, "creatTime": "2018-09-14"}, {"goodsId": 2, "sum": 0, "creatTime": "2018-09-14"}, {"goodsId": 1, "sum": 0, "creatTime": "2018-09-15"}, {"goodsId": 2, "sum": 0, "creatTime": "2018-09-15"}]}
2.扇形图:
{"state": 200, "result": [{"goodsId": 2, "sum": 4}, {"goodsId": 1, "sum": 2}]}
3.柱状图:
{"state": 200, "result": {"sum_lastmonth": 6, "marked": 4, "unmarked": 2}}
js代码:
$(function() {

    linear(); //线形图

    pancake(); // 饼形图

    columnar(); //柱形图

})

function linear() {

    var sellerId = getCookie("sellerId");

    var sellerId = {

        "sellerId": sellerId,

    }

    $.ajax({

        url: "https://www.xxxxxx.cn/xxxxx/xxxxx/", //15天新用户统计

        data: sellerId,

        type: "get",

        success: function(data) {

            var newclient = JSON.parse(data).result;

//            console.log(newclient);

            for(var i=0;i<newclient.length;i++){

                newclient[i].creatTime=newclient[i].creatTime.slice(0,10);

                newclient[i].goodsId=(newclient[i].goodsId+'').replace('1','格林童话');

                newclient[i].goodsId=(newclient[i].goodsId+'').replace('2','阿里巴巴与四十大盗');

            }

            var data=newclient;

//          console.log(data);

            var chart = new F2.Chart({

                id: 'linear',

                pixelRatio: window.devicePixelRatio

            });

            chart.source(data);

            chart.scale('creatTime', {

                tickCount: 15

            });

            chart.scale('sum', {

                tickCount: 6

            });

            chart.axis('creatTime', {

                label: {

                   fontSize:12

                }

            });

            chart.area().position('creatTime*sum').color('goodsId', ['#2196F3', '#DD6666']).shape('smooth');

            chart.line().position('creatTime*sum').color('goodsId', ['#2196F3', '#DD6666']).shape('smooth');

            chart.render();

        },error: function() {

        }

    })

}

function pancake() {

    var sellerId = getCookie("sellerId");

    var sellerId = {

        "sellerId": sellerId,

    }

    $.ajax({

        url: "https://www.xxxxxxx.cn/xxxxxx/xxxxxxx/", //报告种类统计

        data: sellerId,

        type: "get",

        success: function(data) {

            //打印出数组

            var bookresult=JSON.parse(data).result;

            var sums=0;

            for(var i=0;i<bookresult.length;i++){

                bookresult[i].goodsId=(bookresult[i].goodsId+'').replace('1','格林童话');

                bookresult[i].goodsId=(bookresult[i].goodsId+'').replace('2','阿里巴巴与四十大盗');

                sums+=bookresult[i].sum;

            }

//          console.log(sums)

            var data=bookresult;

            var map = {};

            data.map(function(obj) {

                map[obj.goodsId] = Math.round((obj.sum)/sums*100) + '%';

            });

            var chart = new F2.Chart({

                id: 'mountNode',

                pixelRatio: window.devicePixelRatio,

                padding: [20, 'auto']

            });

            chart.source(data, {

                sum: {

                    formatter: function formatter(val) {

                        return val + '%';

                    }

                }

            });

            chart.tooltip(false);

            chart.legend({

                position: 'right',

                itemFormatter: function itemFormatter(val) {

                    return val + '    ' + map[val];

                }

            });

            chart.coord('polar', {

                transposed: true,

                innerRadius: 0.6,

                radius: 0.85

            });

            chart.axis(false);

            chart.interval().position('a*sum').color('goodsId', ['#2196F3', '#3DC1C7']).adjust('stack');

            chart.guide().html({

                position: ['50%', '46%'],

                html: '<div style="width: 250px;height: 40px;text-align: center;">' + '<div style="font-size: 16px">总数量</div>' + '<div style="font-size: 24px">'+sums+'</div>' + '</div>'

            });

            chart.render();

        },

        error: function() {

        }

    })

}

function columnar() {

    var sellerId = getCookie("sellerId");

    var sellerId = {

        "sellerId": sellerId,

    }

    $.ajax({

        url: "https://www.xxxxxxx.cn/xxxxx/xxxxxxx/", //近一个月用户 标记与未标记统计

        data: sellerId,

        type: "get",

        success: function(data) {

            //获取最近30天新增客户数

            var addperson = JSON.parse(data).result.sum_lastmonth;

            //获取未标记客户数

            var unmark = JSON.parse(data).result.unmarked;

            //获取已标记客户数

            var mark = JSON.parse(data).result.marked;

            var data = [{

                sign: '最近30天新增客户数',

                quality: addperson

            }, {

                sign: '未标记客户数',

                quality: unmark

            }, {

                sign: '已标记客户数',

                quality: mark

            }];

            var chart = new F2.Chart({

                id: 'columnar',

                pixelRatio: window.devicePixelRatio

            });

            chart.source(data, {

                quality: {

                    tickCount: 5

                }

            });

            chart.tooltip({

                showItemMarker: false,

                onShow: function onShow(ev) {

                    var items = ev.items;

                    items[0].name = null;

                    items[0].name = items[0].title;

                }

            });

            chart.axis('sign', {

                label: {

                   fontSize:12

                }

            });

            chart.interval().position('sign*quality').color('sign', ['#3DC1C7', '#FCBD44', '#DD6666']);

            chart.render();

        },

        error: function() {

        }

    })

}
有什么不懂的欢迎在下面留言,一起进步。。。。。。
Chart图表整合——面积对比图、扇形图、柱状图的更多相关文章
- C# 绘制统计图(柱状图, 折线图, 扇形图)【转载】
统计图形种类繁多, 有柱状图, 折线图, 扇形图等等, 而统计图形的绘制方法也有很多, 有Flash制作的统计图形, 有水晶报表生成统计图形, 有专门制图软件制作, 也有编程语言自己制作的:这里我们用 ...
- C# 绘制统计图(柱状图, 折线图, 扇形图)
统计图形种类繁多, 有柱状图, 折线图, 扇形图等等, 而统计图形的绘制方法也有很多, 有Flash制作的统计图形, 有水晶报表生成统计图形, 有专门制图软件制作, 也有编程语言自己制作的:这里我们用 ...
- Asp.net 用 Graphics 统计图(柱状图, 折线图, 扇形图)
统计图形种类繁多, 有柱状图, 折线图, 扇形图等等, 而统计图形的绘制方法也有很多, 有Flash制作的统计图形, 有水晶报表生成统计图形, 有专门制图软件制作, 也有编程语言自己制作的:这里我们用 ...
- 一秒钟教会你如何 使用jfreechart制作图表,扇形图,柱形图,线型图,时序图,附上详细代码,直接看效果
今天有小伙伴问到我怎么使用jfreeChat生成图标,去年就有一个这方便的的总结,今天再遇到,就总结出来,供大家参考: 第一个: 创建柱状图,效果图如下: 柱状图代码如下: package cn.xf ...
- 帆软报表(finereport)图表——扇形图/等弧度的玫瑰图
扇形图/等弧度的玫瑰图,展示的是展示数据所占的比例,需要所有数据的和加起来为1. 下面利用一个实例说明玫瑰图的用法和设置起始角度和终止角度,操作如下: 1.配置一个内置数据集 新增一个等弧度的玫瑰图模 ...
- 百度echarts扇形图每个区块增加点击事件
效果图:操作人员要求 :我想看这个扇形图对应的 页面信息,给我加个链接跳转:原先的chart.js发现没有api,后来改用百度的echart.js <!DOCTYPE html> < ...
- 06. Matplotlib 2 |折线图| 柱状图| 堆叠图| 面积图| 填图| 饼图| 直方图| 散点图| 极坐标| 图箱型图
1.基本图表绘制 plt.plot() 图表类别:线形图.柱状图.密度图,以横纵坐标两个维度为主同时可延展出多种其他图表样式 plt.plot(kind='line', ax=None, figsiz ...
- Java设置PPT的扇形图,与内嵌Excel联动
/** * 设置饼图的主方法 * @param slide 图表 * @param index 图标位置 * @param data 需要设置的数据 * @param titles 关联Excel的标 ...
- 【基于WinForm+Access局域网共享数据库的项目总结】之篇二:WinForm开发扇形图统计和Excel数据导出
篇一:WinForm开发总体概述与技术实现 篇二:WinForm开发扇形图统计和Excel数据导出 篇三:Access远程连接数据库和窗体打包部署 [小记]:最近基于WinForm+Access数据库 ...
随机推荐
- docker怎么导出导入镜像
https://blog.csdn.net/dest_dest/article/details/80612231 把某个docker镜像保存到本地文件,命令如下docker save -o 镜像名.t ...
- c# .NET RSA结合AES加密服务端和客户端请求数据
这几天空闲时间就想研究一下加密,环境是web程序,通过js请求后台返回数据,我想做的事js在发送请求前将数据加密,服务端收到后解密,待服务端处理完请求后,将处理结果加密返回给客户端,客户端在解密,于是 ...
- ASP.NET中Onclick和OnserverClick事件的区别 (转)
对于服务器按钮控件(即<asp:Button>类型的按钮): 服务器响应事件:OnClick 客户端响应属性:OnClientClick 对于html按钮控件(即<input typ ...
- dokcer 的export 、improt和save 、load
export .improt 是对容器操作也就是类似于虚拟机的快照 save .load 是针对于镜像操作的..
- 关于mysql中[Err] 1451 -Cannot delete or update a parent row: a foreign key constraint fails
mysql> SET FOREIGN_KEY_CHECKS = 0; Query OK, 0 rows affected (0.02 sec) mysql> delete from r ...
- HTTP协议基础(未完待续)
一.超文本传输协议 超文本传输协议(Hypertext Transfer Protocol,HTTP)是一种用于分布式.协作式和超媒体信息系统的应用层协议.HTTP是万维网的数据通信的基础. 设计HT ...
- 【12c OCP】最新CUUG OCP-071考试题库(51题)
------------------------------------------------------- 51.(12-10)choose the best answer: Evaluate t ...
- “全栈2019”Java第九十七章:在方法中访问局部内部类成员详解
难度 初级 学习时间 10分钟 适合人群 零基础 开发语言 Java 开发环境 JDK v11 IntelliJ IDEA v2018.3 文章原文链接 "全栈2019"Java第 ...
- Java io流完成复制粘贴功能
JAVA 中io字节输入输出流 完成复制粘贴功能: public static void main(String[] args) throws Exception{ // 创建输入流要读 ...
- leecode刷题(20)-- 删除链表中的节点
leecode刷题(20)-- 删除链表中的节点 删除链表中的节点 描述: 请编写一个函数,使其可以删除某个链表中给定的(非末尾)节点,你将只被给定要求被删除的节点. 现有一个链表 -- head = ...