(转) Graph-powered Machine Learning at Google
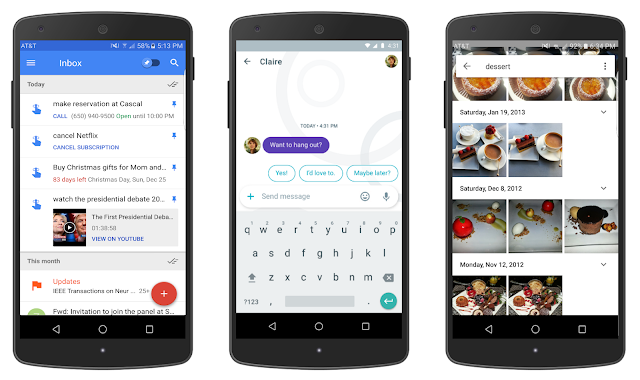
Recently, there have been significant advances in Machine Learning that enable computer systems to solve complex real-world problems. One of those advances is Google’s large scale,graph-based machine learning platform, built by the Expander team in Google Research. A technology that is behind many of the Google products and features you may use everyday, graph-based machine learning is a powerful tool that can be used to power useful features such as reminders in Inbox and smart messaging in Allo, or used in conjunction with deep neural networks to power the latest image recognition system in Google Photos.
Learning with Minimal Supervision
Much of the recent success in deep learning, and machine learning in general, can be attributed to models that demonstrate high predictive capacity when trained on large amounts of labeled data -- often millions of training examples. This is commonly referred to as “supervised learning” since it requires supervision, in the form of labeled data, to train the machine learning systems. (Conversely, some machine learning methods operate directly on raw data without any supervision, a paradigm referred to as unsupervised learning.)
However, the more difficult the task, the harder it is to get sufficient high-quality labeled data. It is often prohibitively labor intensive and time-consuming to collect labeled data for every new problem. This motivated the Expander research team to build new technology for powering machine learning applications at scale and with minimal supervision.
Expander’s technology draws inspiration from how humans learn to generalize and bridge the gap between what they already know (labeled information) and novel, unfamiliar observations (unlabeled information). Known as “semi-supervised” learning, this powerful technique enables us to build systems that can work in situations where training data may be sparse. One of the key advantages to a graph-based semi-supervised machine learning approach is the fact that (a) one models labeled and unlabeled data jointly during learning, leveraging the underlying structure in the data, (b) one can easily combine multiple types of signals (for example, relational information from Knowledge Graph along with raw features) into a single graph representation and learn over them. This is in contrast to other machine learning approaches, such as neural network methods, in which it is typical to first train a system using labeled data with features and then apply the trained system to unlabeled data.
Graph Learning: How It Works
At its core, Expander’s platform combines semi-supervised machine learning with large-scale graph-based learning by building a multi-graph representation of the data with nodes corresponding to objects or concepts and edges connecting concepts that share similarities. The graph typically contains both labeled data (nodes associated with a known output category or label) and unlabeled data (nodes for which no labels were provided). Expander’s framework then performs semi-supervised learning to label all nodes jointly by propagating label information across the graph.
However, this is easier said than done! We have to (1) learn efficiently at scale with minimal supervision (i.e., tiny amount of labeled data), (2) operate over multi-modal data (i.e., heterogeneous representations and various sources of data), and (3) solve challenging prediction tasks (i.e., large, complex output spaces) involving high dimensional data that might be noisy.
One of the primary ingredients in the entire learning process is the graph and choice of connections. Graphs come in all sizes, shapes and can be combined from multiple sources. We have observed that it is often beneficial to learn over multi-graphs that combine information from multiple types of data representations (e.g., image pixels, object categories and chat response messages for PhotoReply in Allo). The Expander team’s graph learning platform automatically generates graphs directly from data based on the inferred or known relationships between data elements. The data can be structured (for example, relational data) or unstructured (for example, sparse or dense feature representations extracted from raw data).
To understand how Expander’s system learns, let us consider an example graph shown below.
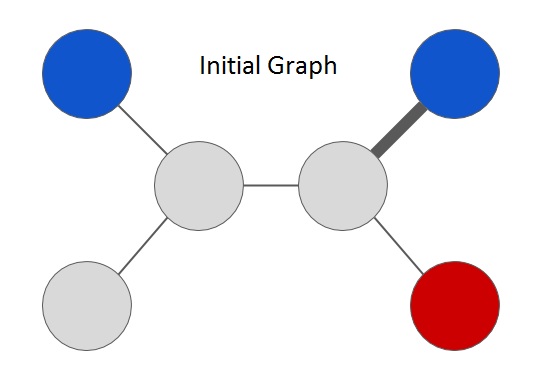
There are two types of nodes in the graph: “grey” represents unlabeled data whereas the colored nodes represent labeled data. Relationships between node data is represented via edges and thickness of each edge indicates strength of the connection. We can formulate the semi-supervised learning problem on this toy graph as follows: predict a color (“red” or “blue”) for every node in the graph. Note that the specific choice of graph structure and colors depend on the task. For example, as shown in this research paper we recently published, a graph that we built for the Smart Reply feature in Inbox represents email messages as nodes and colors indicate semantic categories of user responses (e.g., “yes”, “awesome”, “funny”).
The Expander graph learning framework solves this labeling task by treating it as an optimization problem. At the simplest level, it learns a color label assignment for every node in the graph such that neighboring nodes are assigned similar colors depending on the strength of their connection. A naive way to solve this would be to try to learn a label assignment for all nodes at once -- this method does not scale to large graphs. Instead, we can optimize the problem formulation by propagating colors from labeled nodes to their neighbors, and then repeating the process. In each step, an unlabeled node is assigned a label by inspecting color assignments of its neighbors. We can update every node’s label in this manner and iterate until the whole graph is colored. This process is a far more efficient way to optimize the same problem and the sequence of iterations converges to a unique solution in this case. The solution at the end of the graph propagation looks something like this:
 |
| Semi-supervised learning on a graph |
In practice, we use complex optimization functions defined over the graph structure, which incorporate additional information and constraints for semi-supervised graph learning that can lead to hard, non-convex problems. The real challenge, however, is to scale this efficiently to graphs containing billions of nodes, trillions of edges and for complex tasks involving billions of different label types.
To tackle this challenge, we created an approach outlined in Large Scale Distributed Semi-Supervised Learning Using Streaming Approximation, published last year. It introduces astreaming algorithm to process information propagated from neighboring nodes in a distributed manner that makes it work on very large graphs. In addition, it addresses other practical concerns, notably it guarantees that the space complexity or memory requirements of the system stays constant regardless of the difficulty of the task, i.e., the overall system uses the same amount of memory regardless of whether the number of prediction labels is two (as in the above toy example) or a million or even a billion. This enables wide-ranging applications for natural language understanding, machine perception, user modeling and even joint multimodallearning for tasks involving multiple modalities such as text, image and video inputs.
Language Graphs for Learning Humor
As an example use of graph-based machine learning, consider emotion labeling, a language understanding task in Smart Reply for Inbox, where the goal is to label words occurring in natural language text with their fine-grained emotion categories. A neural network model is first applied to a text corpus to learn word embeddings, i.e., a mathematical vector representation of the meaning of each word. The dense embedding vectors are then used to build a sparse graph where nodes correspond to words and edges represent semantic relationship between them. Edge strength is computed using similarity between embedding vectors — low similarity edges are ignored. We seed the graph with emotion labels known a priori for a few nodes (e.g., laugh is labeled as “funny”) and then apply semi-supervised learning over the graph to discover emotion categories for remaining words (e.g., ROTFL gets labeled as “funny” owing to its multi-hop semantic connection to the word “laugh”).
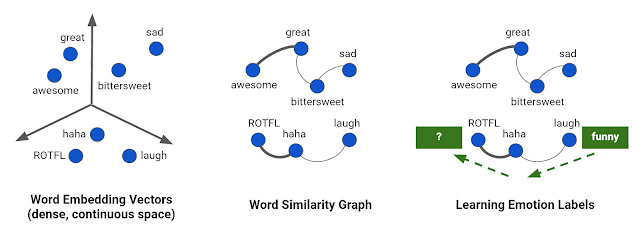 |
| Learning emotion associations using graph constructed from word embedding vectors |
For applications involving large datasets or dense representations that are observed (e.g., pixels from images) or learned using neural networks (e.g., embedding vectors), it is infeasible to compute pairwise similarity between all objects to construct edges in the graph. The Expander team solves this problem by leveraging approximate, linear-time graph construction algorithms.
Graph-based Machine Intelligence in Action
The Expander team’s machine learning system is now being used on massive graphs (containing billions of nodes and trillions of edges) to recognize and understand concepts in natural language, images, videos, and queries, powering Google products for applications likereminders, question answering, language translation, visual object recognition, dialogue understanding, and more.
We are excited that with the recent release of Allo, millions of chat users are now experiencing smart messaging technology powered by the Expander team’s system for understanding and assisting with chat conversations in multiple languages. Also, this technology isn’t used only for large-scale models in the cloud - as announced this past week, Android Wear has opened up anon-device Smart Reply capability for developers that will provide smart replies for any messaging application. We’re excited to tackle even more challenging Internet-scale problems with Expander in the years to come.
Acknowledgements
We wish to acknowledge the hard work of all the researchers, engineers, product managers, and leaders across Google who helped make this technology a success. In particular, we would like to highlight the efforts of Allan Heydon, Andrei Broder, Andrew Tomkins, Ariel Fuxman, Bo Pang, Dana Movshovitz-Attias, Fritz Obermeyer, Krishnamurthy Viswanathan, Patrick McGregor, Peter Young, Robin Dua, Sujith Ravi and Vivek Ramavajjala.

(转) Graph-powered Machine Learning at Google的更多相关文章
- Machine Learning Done Wrong
Machine Learning Done Wrong Statistical modeling is a lot like engineering. In engineering, there ar ...
- 学习笔记之Machine Learning Crash Course | Google Developers
Machine Learning Crash Course | Google Developers https://developers.google.com/machine-learning/c ...
- Teaching Your Computer To Play Super Mario Bros. – A Fork of the Google DeepMind Atari Machine Learning Project
Teaching Your Computer To Play Super Mario Bros. – A Fork of the Google DeepMind Atari Machine Learn ...
- Google's Machine Learning Crash Course #01# Introducing ML & Framing & Fundamental terminology
INDEX Introducing ML Framing Fundamental machine learning terminology Introducing ML What you learn ...
- Graph machine learning 工具
OGB: Open Graph Benchmark https://ogb.stanford.edu/ https://github.com/snap-stanford/ogb OGB is a co ...
- Google's Machine Learning Crash Course #02# Descending into ML
INDEX How do we know if we have a good line Linear Regression Training and Loss How do we know if we ...
- 【机器学习Machine Learning】资料大全
昨天总结了深度学习的资料,今天把机器学习的资料也总结一下(友情提示:有些网站需要"科学上网"^_^) 推荐几本好书: 1.Pattern Recognition and Machi ...
- 机器学习(Machine Learning)&深度学习(Deep Learning)资料
<Brief History of Machine Learning> 介绍:这是一篇介绍机器学习历史的文章,介绍很全面,从感知机.神经网络.决策树.SVM.Adaboost到随机森林.D ...
- FAQ: Machine Learning: What and How
What: 就是将统计学算法作为理论,计算机作为工具,解决问题.statistic Algorithm. How: 如何成为菜鸟一枚? http://www.quora.com/How-can-a-b ...
随机推荐
- 查看rpm和war包内容
解压rpm包的内容:(没有安装,就像解压tgz包一样rpm包)rpm2cpio *.rpm | cpio -div 解压war包的内容: jar -xvf project.war 解压到当前目录
- iframe 子页面获取父页面的元素并且控制样式
父页面的代码 <div id="div5" style="position:relative;height:500px;"> ...
- C#窗体 WinForm 对话框,流
一.对话框 ColorDialog:颜色选择控件 private void button1_Click(object sender, EventArgs e) { //显示颜色选择器 colorDia ...
- 手动实现WCF[转]
由于应用程序开发中一般都会涉及到大量的增删改查业务,所以这个程序将简单演示如何在wcf中构建简单的增删改查服务.我们知道WCF是一组通讯服务框架,我将解决方案按大范围划分为服务端,客户端通过服务寄宿程 ...
- iOS开发拓展篇—UIDynamic(捕捉行为)
iOS开发拓展篇—UIDynamic(捕捉行为) 一.简介 可以让物体迅速冲到某个位置(捕捉位置),捕捉到位置之后会带有一定的震动 UISnapBehavior的初始化 - (instancetype ...
- 学习Django
1.安装 命令:pip install Django 安装慢且有异常:HTTPSConnectionPool(host='pypi.python.org', port=443): Read timed ...
- UOJ Test Round 1
第一题: 题目大意: 给出N个字符串,字符串的前面部分都是字母且都是一样的,后面部分是数字,按照后面的数字排序.N<=10000 解题过程: 1.第一题是真良心,一开始的做法是把后面的数字分离出 ...
- jquery事件代理
在jQuery中,事件代理是指:把事件绑定到父级元素,然后等待事件通过DOM冒泡到该元素时再执行. 在事件侦听过程中有两种触发事件的方式:事件捕获和事件冒泡.事件冒泡更快,效率更高. 事件捕获:事件在 ...
- WinRT知识积累2之MessageDialog应用代码
private void NavigationHelper_SaveState(object sender, SaveStateEventArgs e) { // TODO: 在此处保存页面的唯一状态 ...
- android studio 改变代码提示的方法
移通152余继彪 在android studio中 默认代码提示的功能是ctrl+空格,这样的提示会和输入法造成冲突,所以要改变 改变的方法就是file—seting——Keymap然后搜索basic ...