一元回归1_基础(python代码实现)
python机器学习-乳腺癌细胞挖掘(博主亲自录制视频)
https://study.163.com/course/introduction.htm?courseId=1005269003&utm_campaign=commission&utm_source=cp-400000000398149&utm_medium=share

机器学习,项目统计联系QQ:231469242
目录
1.基本概念
2.SSE/SSR/SST可视化
3.简单回归分为两类
4.一元回归公式
5.估计的回归公式
6.最小二乘法得到回归线应该穿过中心点
7.预测值
8.误差项
9.斜率公式
10.截距公式
11. 决定系数R**2
12.线性关系检验
13.相关系数检验
14.残差
15.被调整的R平方(The Adjusted R2 Value)
16.回归系数的标准误
17.残差分析
18.平均值和个别值的置信区间
19.OLS参数解读
20.一元回归共线性
21.bootstrap

相关系数简介编辑
 计算公式
计算公式值域等级解释编辑
https://docs.scipy.org/doc/scipy-0.14.0/reference/generated/scipy.stats.linregress.html


1.基本概念
因变量:
用了被预测的变量,y表示
自变量:
用来预测或解释得一个或多个变量,x表示
线性关系
正线性相关:一个变量数值增加,另一个变量的数值也增加
负线性相关:一个变量数值增加,另一个变量是指随之减少
完全线性相关:两个变量观测点完全落在直线上(函数关系)
非线性相关:一个变量数值增加,另一个变量数值可能增加或减少,无规律


2.SSE/SSR/SST可视化

3.简单回归分为两类
1.只有一个变量
2.有一个独立变量 independent variable,一个dependent variable

4.一元回归公式
B0是截距
B1是slope斜率
aaarticlea/png;base64,iVBORw0KGgoAAAANSUhEUgAAACwAAAAjCAIAAABgsH+DAAAEjUlEQVRYhe2WW2gcZRTHz8xuk7hNU9KQXUSFpqUUNT6oWKmCkFpfmoZeUCvUgmLACtaKoaE29FGktSD1QVBsjCEohWyjNHub2Wsum+zufOd8M3ufvUySJtRWkWCTPvswSWpCnrKLKdKP8zznN+d/vv//A0beTS/YdIJHEP83CAU9/xEEct/mT0JBj0Lr/nEVxrA+BHKzsZeRj5EPucQ12exHqo80HyN3Al1ckxLMTaqkoAe5T0HPhqVZF8KHXELuZyQzkhWU1GRQL04Y08r0LZyZxelbWDJi5al4yZjM5ke0VKDKEMi9jCQkmZFfS0Wy+WhOn+jrv9p1rvNQ+6s7dzXV2UC0wrYG2Pu0460TB7rPvz8WHTLnUS0I8ysSI5l40Jim8Qn30eNt9Q1gsQKIAAAgAAggWkG0gGCBOhsEw9erCOFh5EHuTTAP8YAxRTeHB5rttaIFttTAjqYtH3S+PTLmyuUT2Vw8ryuTMc+Xlz7r/PBIsRxl3FstCDdys6RMbvy77y8/ZgNBBBDh+JsHA6Ebs3NpvRjXUhEtGUmmRtLZ0UIpmsqEUpmQSVAhhIeRm5GL0TAjdzobDoaHdrY8brUCAJx4p71s8Jwe42qIkd8UC0lmJCOXFFwj5QYh/kXAh5MZ/9xt9eAb+0z5973cyjCczU+qWlhBWUEpwXwKSoxkRhIjacON10CYBC7GbzJ+s2REe/uuiFYAANECAz9/WyjFSQ2uzEBBPyOz5GpCKORS0IXcxTVvyYg90/oUAFissGu3448/y2UDS2VWKCUKxVihmNCLCb0Qz+YnUplRNRlU0ENqpSirIFKZwE/9X9u2giAACNDVdUaSfxt09g06fxx09g46r5nlvNHrHLp249cfMrlRtpRhFfn3khwKuhgNpzKhT86+B0tHAABRBEEAQVy6JqZJgACCBY4cey2njytYhSA1F9OjoBvJly/ETr57zERobKxvaXmi2b7d7thmd9TbHVvtDpvdUdvsqG1qttY3wKXL3elsmJGv8ox94BPI/dl8rKPjIAggWuBCz6f3Fu4s3r+7eP/Oct1eWJy7tzi7cH92/m9jagbVpN8MuapBcC2oJsf2v/K8IAIAnP/8TLFESBG2VGFGIUYhRkEFZUZ+5DIjr4LVhkAKtz6325Sj5+LZXD7B1QjyIFIIKYQ8yCjAyK/gKodYlmPjNKsgiEde2tcqCAAA57pPG9Mq8iAjmWGAYWDFHhRcp9lq96xgJ9KZaPvhNlEEADh6/PXf7+ZULWR61DLBWo9a2cpKdHmQHcilTDZ6+qNTogUAoLYOJHlwZjalJUdiCYlrYeQBNRnJ6RPF8qReHCdVMruaL7HKd8KMD28yPepyX2/cUWOuRW0dXP3mi0w2ZkxphSJLZ6JcjQy7Bg6173e5+/XiJCO58q1cC0FqYGpa/erKxYbtomlXNTWwZ8+ThzsOtHe0vfDi3h1NdRYrWKxwoedjvRBfDpTq3I4V35W0VFgvxJxDfc+2tpgJYrGCKRCIYNsKJ091uD2/6MV4NjdeFZNg5AXlITgwP//XptcjiIcK4h+Zvl1TL+KuqQAAAABJRU5ErkJggg==" alt="" />是误差项,一个随机变量,它是除x和y之间的线性关系以外的随机因素对y的影响。是不能由x和y之间的线性关系所解释的y的变异

5.估计的回归公式
最小二乘法得到估计的回归公式
如果我们知道总体参数斜率和截距,我们就可以使用简单线性回归公式。
真实情况,我们不能得到总体参数。所以我们用样本参数来得到估算的斜率和截距

斜率为0的直线,SSE=SST

6.最小二乘法得到回归线应该穿过中心点
最小二乘法得到回归线应该穿过中心点(变量1的平均值,变量2的平均值)

最小二乘法:
SSE最小的方法就是最小二乘法
 ..
..
7.预测值
只有一个变量:平均数

点估计(两个变量)

平均值和个别值的预测


8.误差项
aaarticlea/png;base64,iVBORw0KGgoAAAANSUhEUgAAACwAAAAjCAIAAABgsH+DAAAEjUlEQVRYhe2WW2gcZRTHz8xuk7hNU9KQXUSFpqUUNT6oWKmCkFpfmoZeUCvUgmLACtaKoaE29FGktSD1QVBsjCEohWyjNHub2Wsum+zufOd8M3ufvUySJtRWkWCTPvswSWpCnrKLKdKP8zznN+d/vv//A0beTS/YdIJHEP83CAU9/xEEct/mT0JBj0Lr/nEVxrA+BHKzsZeRj5EPucQ12exHqo80HyN3Al1ckxLMTaqkoAe5T0HPhqVZF8KHXELuZyQzkhWU1GRQL04Y08r0LZyZxelbWDJi5al4yZjM5ke0VKDKEMi9jCQkmZFfS0Wy+WhOn+jrv9p1rvNQ+6s7dzXV2UC0wrYG2Pu0460TB7rPvz8WHTLnUS0I8ysSI5l40Jim8Qn30eNt9Q1gsQKIAAAgAAggWkG0gGCBOhsEw9erCOFh5EHuTTAP8YAxRTeHB5rttaIFttTAjqYtH3S+PTLmyuUT2Vw8ryuTMc+Xlz7r/PBIsRxl3FstCDdys6RMbvy77y8/ZgNBBBDh+JsHA6Ebs3NpvRjXUhEtGUmmRtLZ0UIpmsqEUpmQSVAhhIeRm5GL0TAjdzobDoaHdrY8brUCAJx4p71s8Jwe42qIkd8UC0lmJCOXFFwj5QYh/kXAh5MZ/9xt9eAb+0z5973cyjCczU+qWlhBWUEpwXwKSoxkRhIjacON10CYBC7GbzJ+s2REe/uuiFYAANECAz9/WyjFSQ2uzEBBPyOz5GpCKORS0IXcxTVvyYg90/oUAFissGu3448/y2UDS2VWKCUKxVihmNCLCb0Qz+YnUplRNRlU0ENqpSirIFKZwE/9X9u2giAACNDVdUaSfxt09g06fxx09g46r5nlvNHrHLp249cfMrlRtpRhFfn3khwKuhgNpzKhT86+B0tHAABRBEEAQVy6JqZJgACCBY4cey2njytYhSA1F9OjoBvJly/ETr57zERobKxvaXmi2b7d7thmd9TbHVvtDpvdUdvsqG1qttY3wKXL3elsmJGv8ox94BPI/dl8rKPjIAggWuBCz6f3Fu4s3r+7eP/Oct1eWJy7tzi7cH92/m9jagbVpN8MuapBcC2oJsf2v/K8IAIAnP/8TLFESBG2VGFGIUYhRkEFZUZ+5DIjr4LVhkAKtz6325Sj5+LZXD7B1QjyIFIIKYQ8yCjAyK/gKodYlmPjNKsgiEde2tcqCAAA57pPG9Mq8iAjmWGAYWDFHhRcp9lq96xgJ9KZaPvhNlEEADh6/PXf7+ZULWR61DLBWo9a2cpKdHmQHcilTDZ6+qNTogUAoLYOJHlwZjalJUdiCYlrYeQBNRnJ6RPF8qReHCdVMruaL7HKd8KMD28yPepyX2/cUWOuRW0dXP3mi0w2ZkxphSJLZ6JcjQy7Bg6173e5+/XiJCO58q1cC0FqYGpa/erKxYbtomlXNTWwZ8+ThzsOtHe0vfDi3h1NdRYrWKxwoedjvRBfDpTq3I4V35W0VFgvxJxDfc+2tpgJYrGCKRCIYNsKJ091uD2/6MV4NjdeFZNg5AXlITgwP//XptcjiIcK4h+Zvl1TL+KuqQAAAABJRU5ErkJggg==" alt="" />是误差项,一个随机变量,它是除x和y之间的线性关系以外的随机因素对y的影响。是不能由x和y之间的线性关系所解释的y的变异
误差项应满足
正态性+方差齐性+独立性

在回归模型中,误差项是期望值为0,方差相等且服从正态分布的一个独立随机变量。如果关于误差项的假定不成立的话,所做的检验站不住脚。确定有关误差项假定的方法之一就是残差分析
残差分析图

9.斜率公式
slope斜率的公式


10.截距公式
因为最好的模型会穿越中心点(变量1的平均值,变量2的平均值),利用斜率和中心点可以得到截距

11. 决定系数R**2
相关关系correlation:
影响一个变量的因素有多个,造成两个变量关系不确定性。变量之间不确定的关系称为相关关系。
即一个变量不能决定另一个变量,而是多个变量共同决定另一个变量发展。
相关系数:
变量之间关系强度
决定系数R**2
=SSR/SSE
SSR占据SST空间越大,R**2值越大

12.线性关系检验
建立模型前,我们已经假定x和y是线性关系,但假设是否成功需要检验后才能证实。
线性关系检验简称为F检验,它用于检验自变量x和因变量y之间线性关系是否显著。
如何判断决定模型是否匹配?用方差分析来算F值,即SSR/SSE的F值概率是否低于0.05
SSE自由度为n-2(变量个数-2)
SSR自由度为1(两个变量自由度为2-1=1)


SST,SSR,SSE的可视化

13.相关系数检验
如果决定系数R**2显著,还要结合样本量考虑参数估计是否适用于总体,如果样本量太小,或R值太小,则不适用与总体
这时用t检验t=(r*math.sqrt(n-2))/(math.sqrt(1-r**2)), 自由度为n-2

.
14.残差
真实值y1与估算值y~1之差
e=y1-(y~1)

残差平方和就是SSE
|参数估计值-真实值|**2 相加就是SSE

残差平方和
如果一个简单线性模型较好匹配数据,则SSE会最小
简单线性回归目标是创造一个线性模型,其残差平方和最小

SSE公式


练习
http://book.2cto.com/201512/58842.html
餐饮系统中可以统计得到不同菜品的日销量数据,数据示例如表3-7所示。

数据详见:demo/data/catering_sale_all.xls
分析这些菜品销售量之间的相关性可以得到不同菜品之间的关系,比如是替补菜品、互补菜品或者没有关系,为原材料采购提供参考。其Python代码如代码清单3-4所示。
代码清单3-4 餐饮销量数据相关性分析
#-*- coding: utf-8 -*-

#餐饮销量数据相关性分析

from __future__ import print_function

import pandas as pd

catering_sale = '../data/catering_sale_all.xls' #餐饮数据,含有其他属性

data = pd.read_excel(catering_sale, index_col = u'日期') #读取数据,指定“日期”列为索引列

data.corr() #相关系数矩阵,即给出了任意两款菜式之间的相关系数

data.corr()[u'百合酱蒸凤爪'] #只显示“百合酱蒸凤爪”与其他菜式的相关系数

data[u'百合酱蒸凤爪'].corr(data[u'翡翠蒸香茜饺']) #计算“百合酱蒸凤爪”与“翡翠蒸香茜饺”的相关系数

代码详见:demo/code/correlation_analyze.py
上面的代码给出了3种不同形式的求相关系数的运算。运行代码,可以得到任意两款菜式之间的相关系数,如运行“data.corr()[u'百合酱蒸凤爪']”可以得到下面的结果。
>>> data.corr()[u'百合酱蒸凤爪']
百合酱蒸凤爪     1.000000

翡翠蒸香茜饺     0.009206

金银蒜汁蒸排骨    0.016799

乐膳真味鸡      0.455638

蜜汁焗餐包      0.098085

生炒菜心       0.308496

铁板酸菜豆腐     0.204898

香煎韭菜饺      0.127448

香煎萝卜糕     -0.090276

原汁原味菜心     0.428316

Name: 百合酱蒸凤爪, dtype: float64
从上面的结果可以看到,如果顾客点了“百合酱蒸凤爪”,则和点“翡翠蒸香茜饺”“金银蒜汁蒸排骨”“香煎萝卜糕”“铁板酸菜豆腐”“香煎韭菜饺”等主食类的相关性比较低,反而点“乐膳真味鸡”“生炒菜心”“原汁原味菜心”的相关性比较高。
R方仅用于样本数据,对于整体数据,R方没有啥用
调整R方永远小于R方
如果增加了越来越多无用的变量,调整R方变小;
如果增加了越来越多有用变量,调整R方变大。
R方公式
The formula is:


当给模型增加自变量时,复决定系数也随之逐步增大,当自变量足够多时总会得到模型拟合良好,而实际却可能并非如此。于是考虑对R2进行调整,记为Ra2,称调整后复决定系数。
R2=SSR/SST=1-SSE/SST
Ra2=1-(SSE/dfE)/(SST/dfT)
Why you should not use R2 to compare models
R2 quantifies how well a model fits the data, so it seems as though it would be an easy way to compare models. It sure sounds easy -- pick the model with the larger R2. The problem with this approach is that there is no penalty for adding more parameters. So the model with more parameters will bend and twist more to come nearer the points, and so almost always has a higher R2. If you use R2 as the criteria for picking the best model, you'd almost always pick the model with the most parameters.
The adjusted R2 accounts for the number of parameters fit
The adjusted R2 always has a lower value than R2 (unless you are fitting only one parameter). The equations below show why.

The equations above show how the adjusted R2 is computed. The sum-of-squares of the residuals from the regression line or curve have n-K degrees of freedom, where n is the number of data points and K is the number of parameters fit by the regression. The total sum-of-squares is the sum of the squares of the distances from a horizontal line through the mean of all Y values. Since it only has one parameter (the mean), the degrees of freedom equals n-1. The adjusted R2 is larger than the ordinary R2 whenever K is greater than 1.
Using adjusted R2 and a quick and dirty way to compare models
A quick and easy way to compare models is to choose the one with the smaller adjusted R2. Choose to report this value on the Diagnostics tab.
Comparing models with adjusted R2 is not a standard method for comparing nonlinear models (it is standard for multiple linear regression), and we suggest that you use the extra-sum-of-square F test or comparing AICc instead. If you do compare models by comparing adjusted R2, make sure that identical data, weighted identically, are used for all fits.
Adjusted R2 in linear regression
Prism doesn't report the adjusted R2 with linear regression, but you can fit a straight line with nonlinear regression.
If X and Y are not linearly related at all, the best fit slope is expected to be 0.0. If you analyzed many randomly selected samples, half the samples would have a slope that is positive and half the samples would have a negative slope. But in all these cases, R2 would be positive (or zero). R2 can never be negative (unless you constrain the slope or intercept so it is forced to fit worse than a horizontal line). In contrast, the adjusted R2 can be negative. If you analyzed many randomly selected samples, you'd expect the adjusted R2 to be positive in half the samples and negative in the other half.
Here is a simple way to think about the distinction. The R2 quantifies the linear relationship in the sample of data you are analyzing. Even if there is no underlying relationship, there almost certainly is some relationship in that sample. The adjusted R2 is smaller than R2 and is your best estimate of the degree of relationship in the underlying population.
Adjusted R2 / Adjusted R-Squared: What is it used for?
Statistics Definitions > Adjusted r2
Watch the video or read the article below:
Adjusted R2: Overview
Adjusted R2 is a special form of R2, the coefficient of determination.

The adjusted R2 has many applications in real life. Image: USCG
R2 shows how well terms (data points) fit a curve or line. Adjusted R2 also indicates how well terms fit a curve or line, but adjusts for the number of terms in a model. If you add more and more useless variablesto a model, adjusted r-squared will decrease. If you add more useful variables, adjusted r-squared will increase.
Adjusted R2 will always be less than or equal to R2. You only need R2 when working with samples. In other words, R2 isn’t necessary when you have data from an entire population.
where:
- N is the number of points in your data sample.
- K is the number of independent regressors, i.e. the number of variables in your model, excluding the constant.
If you already know R2 then it’s a fairly simple formula to work. However, if you do not already have R2 then you’ll probably not want to calculate this by hand! (If you must, see How to Calculate the Coefficient of Determination). There are many statistical packages that can calculated adjusted r squared for you. Adjusted r squared is given as part of Excel regression output. See: Excel regression analysis output explained.
Meaning of Adjusted R2
Both R2 and the adjusted R2 give you an idea of how many data points fall within the line of the regression equation. However, there is one main difference between R2 and the adjusted R2: R2 assumes that every single variable explains the variation in the dependent variable. The adjusted R2 tells you the percentage of variation explained by only the independent variables that actually affect the dependent variable.
How Adjusted R2 Penalizes You
The adjusted R2 will penalize you for adding independent variables (K in the equation) that do not fit the model. Why? In regression analysis, it can be tempting to add more variables to the data as you think of them. Some of those variables will be significant, but you can’t be sure that significance is just by chance. The adjusted R2 will compensate for this by that penalizing you for those extra variables.
Problems with R2 that are corrected with an adjusted R2
- R2 increases with every predictor added to a model. As R2 always increases and never decreases, it can appear to be a better fit with the more terms you add to the model. This can be completely misleading.
- Similarly, if your model has too many terms and too many high-order polynomials you can run into the problem of over-fitting the data. When you over-fit data, a misleadingly high R2 value can lead to misleading projections.
 ,其中n为样本容量,k为待估参数个数,i为样本中的个体编号;
 ,其中n为样本容量,k为待估参数个数,i为样本中的个体编号。
Here is why the objective function defined as -2 Log likelihood
The log function is monotonic and makes it easy to calculate. Some software do it in minimum that is why there a negative sign(-). My guess is because a regression problem is defined to minimize sum of error square. The number 2 is there for ease for hypothesis testing when one needs it, because 2*( loglikehood ration) is of chi square distribution with # df.


np.sum( np.diff( result.resid.values )**2.0 )

Out[18]: 3.1437096272928842

DW = np.sum( np.diff( result.resid.values )**2.0 )/result.ssr

DW

Out[20]: 1.9753463429714668

print('Durbin-Watson: {:.5f}'.format( DW ))

Durbin-Watson: 1.97535

D.W统计量在2左右说明残差是服从正态分布的,若偏离2太远,那么你所构建的模型的解释能力就要受影响了.
在线性回归中,我们总是假设残差是彼此独立的(不相关)。如果违反相互独立假设 ,一些模型的拟合结果就会成问题。例如,误差项之间的正相关往往会放大系数 t 值,从而使预测变量显得重要 ,而事实上它们可能并不重要。
Durbin-Watson 统计量通过确定两个相邻误差项的相关性是否为零来检验回归残差是否存在自相关。该检验以误差均由一阶自回归过程生成的假设为基础。要从检验中得出结论,根据样本量n和自变量数目k'查DW分布表,得下临界值LD 和上临界值UD,并依下列准则判断残差的自相关情形:
(1)如果0<DW< LD ,则拒绝零假设,残差存在一阶正自相关。DW越接近于0,正自相关性越强。
(2)如果LD <DW< UD ,则无法判断是否有自相关。
(3)如果UD <DW<4-UD ,则接受零假设,残差不存在一阶正自相关。DW越接近2,判断无自相关性把握越大。
(4)如果4-UD <DW<4-LD ,则无法判断是否有自相关。
(5)如果4-LD <DW<4,则拒绝零假设,残差存在一阶负自相关。DW越接近于4,负自相关性越强。
详细的检验表(请右键另存为):
T=6-100 (.TXT)
T=100-200 (.TXT)
T=200-500 (.TXT)
T=500-2000 (.TXT)
Durbin-Waterson Test 检验表


The condition number measures the sensitivity of a function’s output to its input.
When two predictor variables are highly correlated, which is called multicollinearity,
the coefficients or factors of those predictor variables can fluctuate erratically for
small changes in the data or the model. Ideally, similar models should be similar,
i.e., have approximately equal coefficients. Multicollinearity can cause numerical
matrix inversion to crap out, or produce inaccurate results (see Kaplan 2009). One
approach to this problem in regression is the technique of ridge regression, which is
available in the Python package sklearn.
We calculate the condition number by taking the eigenvalues of the product of
the predictor variables (including the constant vector of ones) and then taking the
square root of the ratio of the largest eigenvalue to the smallest eigenvalue. If the
condition number is greater than 30, then the regression may have multicollinearity.

- 外文名Akaike information criterion
赤池信息量准则[1] 是由日本统计学家赤池弘次创立的,以熵的概念基础确定。
赤池信息量准则,即Akaike information criterion、简称AIC,是衡量统计模型拟合优良性的一种标准,是由日本统计学家赤池弘次创立和发展的。赤池信息量准则建立在熵的概念基础上,可以权衡所估计模型的复杂度和此模型拟合数据的优良性。
公式:
AICc和AICu
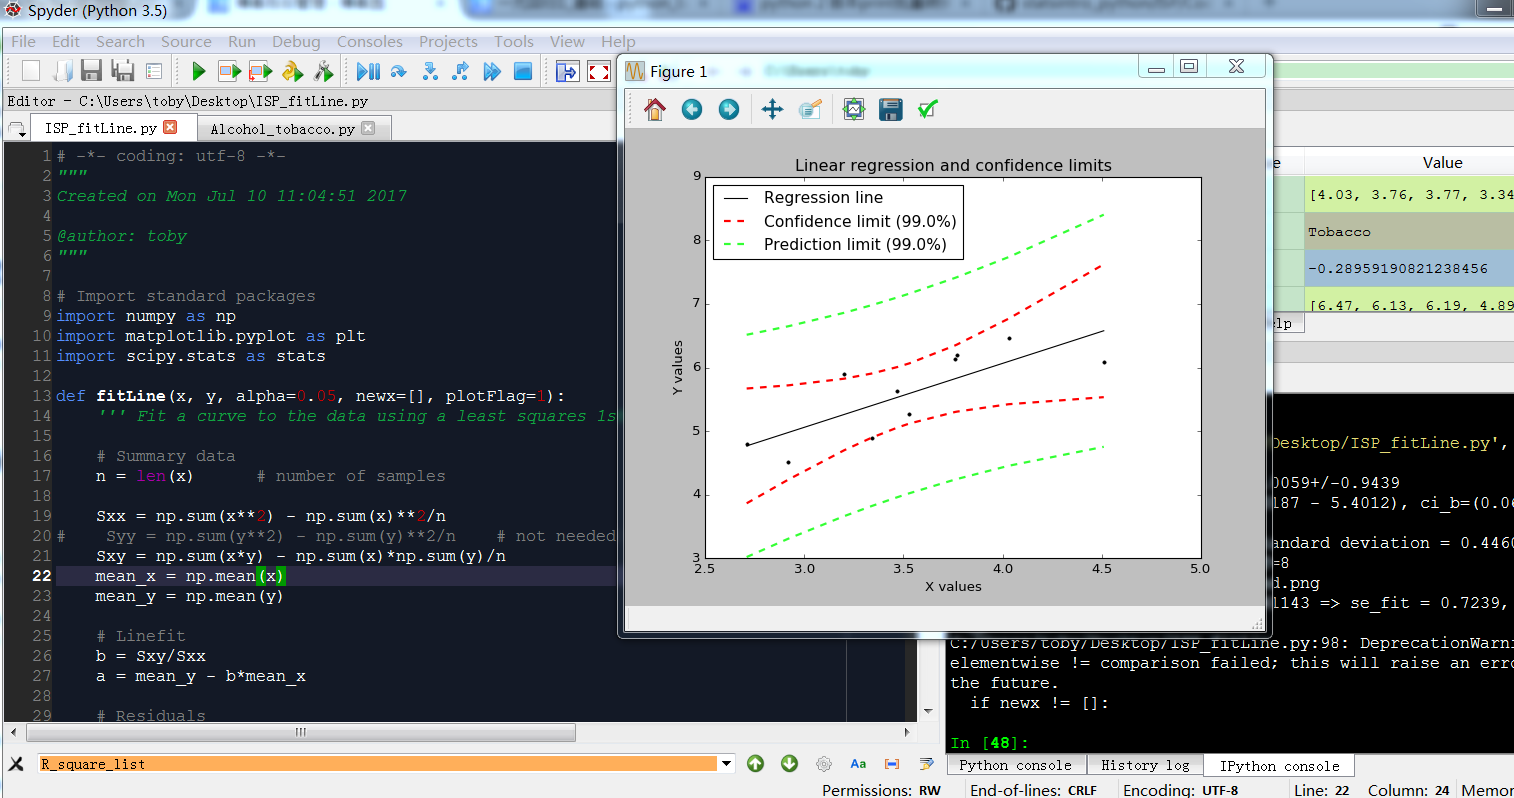
# -*- coding: utf-8 -*-

"""

Created on Mon Jul 10 11:04:51 2017

@author: toby

"""

# Import standard packages

import numpy as np

import matplotlib.pyplot as plt

import scipy.stats as stats

def fitLine(x, y, alpha=0.05, newx=[], plotFlag=1):

    ''' Fit a curve to the data using a least squares 1st order polynomial fit '''

    # Summary data

    n = len(x)             # number of samples

    Sxx = np.sum(x**2) - np.sum(x)**2/n

#    Syy = np.sum(y**2) - np.sum(y)**2/n    # not needed here

    Sxy = np.sum(x*y) - np.sum(x)*np.sum(y)/n

    mean_x = np.mean(x)

    mean_y = np.mean(y)

    # Linefit

    b = Sxy/Sxx

    a = mean_y - b*mean_x

    # Residuals

    fit = lambda xx: a + b*xx

    residuals = y - fit(x)

    var_res = np.sum(residuals**2)/(n-2)

    sd_res = np.sqrt(var_res)

    # Confidence intervals

    se_b = sd_res/np.sqrt(Sxx)

    se_a = sd_res*np.sqrt(np.sum(x**2)/(n*Sxx))

    df = n-2                            # degrees of freedom

    tval = stats.t.isf(alpha/2., df)    # appropriate t value

    ci_a = a + tval*se_a*np.array([-1,1])

    ci_b = b + tval*se_b*np.array([-1,1])

    # create series of new test x-values to predict for

    npts = 100

    px = np.linspace(np.min(x),np.max(x),num=npts)

    se_fit     = lambda x: sd_res * np.sqrt(  1./n + (x-mean_x)**2/Sxx)

    se_predict = lambda x: sd_res * np.sqrt(1+1./n + (x-mean_x)**2/Sxx)

    print(('Summary: a={0:5.4f}+/-{1:5.4f}, b={2:5.4f}+/-{3:5.4f}'.format(a,tval*se_a,b,tval*se_b)))

    print(('Confidence intervals: ci_a=({0:5.4f} - {1:5.4f}), ci_b=({2:5.4f} - {3:5.4f})'.format(ci_a[0], ci_a[1], ci_b[0], ci_b[1])))

    print(('Residuals: variance = {0:5.4f}, standard deviation = {1:5.4f}'.format(var_res, sd_res)))

    print(('alpha = {0:.3f}, tval = {1:5.4f}, df={2:d}'.format(alpha, tval, df)))

    # Return info

    ri = {'residuals': residuals,

        'var_res': var_res,

        'sd_res': sd_res,

        'alpha': alpha,

        'tval': tval,

        'df': df}

    if plotFlag == 1:

        # Plot the data

        plt.figure()

        plt.plot(px, fit(px),'k', label='Regression line')

        #plt.plot(x,y,'k.', label='Sample observations', ms=10)

        plt.plot(x,y,'k.')

        x.sort()

        limit = (1-alpha)*100

        plt.plot(x, fit(x)+tval*se_fit(x), 'r--', lw=2, label='Confidence limit ({0:.1f}%)'.format(limit))

        plt.plot(x, fit(x)-tval*se_fit(x), 'r--', lw=2 )

        plt.plot(x, fit(x)+tval*se_predict(x), '--', lw=2, color=(0.2,1,0.2), label='Prediction limit ({0:.1f}%)'.format(limit))

        plt.plot(x, fit(x)-tval*se_predict(x), '--', lw=2, color=(0.2,1,0.2))

        plt.xlabel('X values')

        plt.ylabel('Y values')

        plt.title('Linear regression and confidence limits')

        # configure legend

        plt.legend(loc=0)

        leg = plt.gca().get_legend()

        ltext = leg.get_texts()

        plt.setp(ltext, fontsize=14)

        # show the plot

        outFile = 'regression_wLegend.png'

        plt.savefig(outFile, dpi=200)

        print('Image saved to {0}'.format(outFile))

        plt.show()

    if newx != []:

        try:

            newx.size

        except AttributeError:

            newx = np.array([newx])

        print(('Example: x = {0}+/-{1} => se_fit = {2:5.4f}, se_predict = {3:6.5f}'\

        .format(newx[0], tval*se_predict(newx[0]), se_fit(newx[0]), se_predict(newx[0]))))

        newy = (fit(newx), fit(newx)-se_predict(newx), fit(newx)+se_predict(newx))

        return (a,b,(ci_a, ci_b), ri, newy)

    else:

        return (a,b,(ci_a, ci_b), ri)

def Draw_confidenceInterval(x,y):

    x=np.array(x)

    y=np.array(y)

    goodIndex = np.invert(np.logical_or(np.isnan(x), np.isnan(y)))

    (a,b,(ci_a, ci_b), ri,newy) = fitLine(x[goodIndex],y[goodIndex], alpha=0.01,newx=np.array([1,4.5]))

y=[6.47,6.13,6.19,4.89,5.63,4.52,5.89,4.79,5.27,6.08]

x=[4.03,3.76,3.77,3.34,3.47,2.92,3.20,2.71,3.53,4.51]

Draw_confidenceInterval(x,y)
# -*- coding: utf-8 -*-

#斯皮尔曼等级相关(Spearman’s correlation coefficient for ranked data)

import math,pylab,scipy

import numpy as np

import scipy.stats as stats

from scipy.stats import t

from scipy.stats import f

import pandas as pd

import matplotlib.pyplot as plt

from statsmodels.stats.diagnostic import lillifors

import normality_check

import statsmodels.formula.api as sm

x=[4.03,3.76,3.77,3.34,3.47,2.92,3.20,2.71,3.53,4.51]

y=[6.47,6.13,6.19,4.89,5.63,4.52,5.89,4.79,5.27,6.08]

list_group=[x,y]

sample=len(x)

#显著性

a=0.05

#数据可视化

plt.plot(x,y,'ro')

#斯皮尔曼等级相关,非参数检验

def Spearmanr(x,y):

    print("use spearmanr,Nonparametric tests")

    #样本不一致时,发出警告

    if len(x)!=len(y):

        print ("warming,the samples are not equal!")

    r,p=stats.spearmanr(x,y)

    print("spearman r**2:",r**2)

    print("spearman p:",p)

    if sample<500 and p>0.05:

        print("when sample < 500,p has no mean(>0.05)")

        print("when sample > 500,p has mean")

#皮尔森 ,参数检验

def Pearsonr(x,y):

    print("use Pearson,parametric tests")

    r,p=stats.pearsonr(x,y)

    print("pearson r**2:",r**2)

    print("pearson p:",p)

    if sample<30:

        print("when sample <30,pearson has no mean")

#皮尔森 ,参数检验,带有详细参数

def Pearsonr_details(x,y,xLabel,yLabel,formula):

    n=len(x)

    df=n-2

    data=pd.DataFrame({yLabel:y,xLabel:x})

    result = sm.ols(formula, data).fit()

    print(result.summary())

    #模型F分布显著性分析

    print('\n')

    print("linear relation Significant test:...................................")

    #如果F检验的P值<0.05,拒绝H0,x和y无显著关系,H1成立,x和y有显著关系

    if result.f_pvalue<0.05:

        print ("P value of f test<0.05,the linear relation is right.")

    #R的显著检验

    print('\n')

    print("R significant test:...................................")

    r_square=result.rsquared

    r=math.sqrt(r_square)

    t_score=r*math.sqrt(n-2)/(math.sqrt(1-r**2))

    t_std=t.isf(a/2,df)

    if t_score<-t_std or t_score>t_std:

        print ("R is significant according to its sample size")

    else:

        print ("R is not significant")

    #残差分析

    print('\n')

    print("residual error analysis:...................................")

    states=normality_check.check_normality(result.resid)

    if states==True:

        print("the residual error are normal distributed")

    else:

        print("the residual error are not normal distributed")

    #残差偏态和峰态

    Skew = stats.skew(result.resid, bias=True)

    Kurtosis = stats.kurtosis(result.resid, fisher=False,bias=True)

    if round(Skew,1)==0:

        print("residual errors normality Skew:in middle,perfect match")

    elif  round(Skew,1)>0:

        print("residual errors normality Skew:close right")

    elif  round(Skew,1)<0:

        print("residual errors normality Skew:close left")

    if round(Kurtosis,1)==3:

        print("residual errors normality Kurtosis:in middle,perfect match")

    elif  round(Kurtosis,1)>3:

        print("residual errors normality Kurtosis:more peak")

    elif  round(Kurtosis,1)<3:

        print("residual errors normality Kurtosis:more flat")

    #自相关分析autocorrelation

    print('\n')

    print("autocorrelation test:...................................")

    DW = np.sum( np.diff( result.resid.values )**2.0 )/ result.ssr

    if round(DW,1)==2:

        print("Durbin-Watson close to 2,there is no autocorrelation.OLS model works well")

    #共线性检查

    print('\n')

    print("multicollinearity test:")

    conditionNumber=result.condition_number

    if conditionNumber>30:

        print("conditionNumber>30,multicollinearity exists")

    else:

        print("conditionNumber<=30,multicollinearity not exists")

    #绘制残差图,用于方差齐性检验

    Draw_residual(list(result.resid))

'''

result.rsquared

Out[28]: 0.61510660055413524

'''

#kendalltau非参数检验

def Kendalltau(x,y):

    print("use kendalltau,Nonparametric tests")

    r,p=stats.kendalltau(x,y)

    print("kendalltau r**2:",r**2)

    print("kendalltau p:",p)

#选择模型

def R_mode(x,y,xLabel,yLabel,formula):

    #正态性检验

    Normal_result=normality_check.NormalTest(list_group)

    print ("normality result:",Normal_result)

    if len(list_group)>2:

        Kendalltau(x,y)

    if Normal_result==False:

        Spearmanr(x,y)

        Kendalltau(x,y)

    if Normal_result==True:

        Pearsonr_details(x,y,xLabel,yLabel,formula)

#调整的R方

def Adjust_Rsquare(r_square,n,k):

    adjust_rSquare=1-((1-r_square)*(n-1)*1.0/(n-k-1))

    return adjust_rSquare

'''

n=len(x)

n=10

k=1

 r_square=0.615

 Adjust_Rsquare(r_square,n,k)

Out[11]: 0.566875

'''

#绘图

def Plot(x,y,yLabel,xLabel,Title):

    plt.plot(x,y,'ro')

    plt.ylabel(yLabel)

    plt.xlabel(xLabel)

    plt.title(Title)

    plt.show()

#绘图参数

yLabel='Alcohol'

xLabel='Tobacco'

Title='Sales in Several UK Regions'

Plot(x,y,yLabel,xLabel,Title)

formula='Alcohol ~ Tobacco'

#绘制残点图

def Draw_residual(residual_list):

    x=[i for i in range(1,len(residual_list)+1)]

    y=residual_list

    pylab.plot(x,y,'ro')

    pylab.title("draw residual to check wrong number")

    # Pad margins so that markers don't get clipped by the axes,让点不与坐标轴重合

    pylab.margins(0.3)

    #绘制网格

    pylab.grid(True)

    pylab.show()

R_mode(x,y,xLabel,yLabel,formula)

'''

result.fittedvalues表示预测的y值阵列

result.fittedvalues

Out[42]:

0    6.094983

1    5.823391

2    5.833450

3    5.400915

4    5.531682

5    4.978439

6    5.260090

7    4.767201

8    5.592035

9    6.577813

dtype: float64

#计算残差的偏态

S = stats.skew(result.resid, bias=True)

Out[44]: -0.013678125910039975

K = stats.kurtosis(result.resid, fisher=False,bias=True)

K

Out[47]: 1.5271300905736027

'''


# -*- coding: utf-8 -*-

'''Simple linear models.

- "model_formulas" is based on examples in Kaplan's book "Statistical Modeling".

- "polynomial_regression" shows how to work with simple design matrices, like MATLAB's "regress" command.

'''

# Copyright(c) 2015, Thomas Haslwanter. All rights reserved, under the CC BY-SA 4.0 International License

# Import standard packages

import numpy as np

import pandas as pd

# additional packages

from statsmodels.formula.api import ols

import statsmodels.regression.linear_model as sm

from statsmodels.stats.anova import anova_lm

def model_formulas():

    ''' Define models through formulas '''

    # Get the data:

    # Development of world record times for the 100m Freestyle, for men and women.

    data = pd.read_csv('swim100m.csv')

    # Different models

    model1 = ols("time ~ sex", data).fit()  # one factor

    model2 = ols("time ~ sex + year", data).fit()   # two factors

    model3 = ols("time ~ sex * year", data).fit()   # two factors with interaction

    # Model information

    print((model1.summary()))

    print((model2.summary()))

    print((model3.summary()))

    # ANOVAs

    print('----------------- Results ANOVAs: Model 1 -----------------------')

    print((anova_lm(model1)))

    print('--------------------- Model 2 -----------------------------------')

    print((anova_lm(model2)))

    print('--------------------- Model 3 -----------------------------------')

    model3Results = anova_lm(model3)

    print(model3Results)

    # Just to check the correct run

    return model3Results['F'][0] # should be 156.1407931415788

def polynomial_regression():

    ''' Define the model directly through the design matrix.

        Similar to MATLAB's "regress" command.

        '''

    # Generate the data: a noisy second order polynomial

    # To get reproducable values, I provide a seed value

    np.random.seed(987654321)

    t = np.arange(0,10,0.1)

    y = 4 + 3*t + 2*t**2 + 5*np.random.randn(len(t))

    # --- >>> START stats <<< ---

    # Make the fit. Note that this is another "OLS" than the one in "model_formulas",

    # as it works directly with the design matrix!

    M = np.column_stack((np.ones(len(t)), t, t**2))

    res = sm.OLS(y, M).fit()

    # --- >>> STOP stats <<< ---

    # Display the results

    print('Summary:')

    print((res.summary()))

    print(('The fit parameters are: {0}'.format(str(res.params))))

    print('The confidence intervals are:')

    print((res.conf_int()))

    return res.params # should be [ 4.74244177,  2.60675788,  2.03793634]

if __name__ == '__main__':

    model_formulas()

    polynomial_regression()

durbin-waston:值太小,autocorrelation同相关明显

durbin-waston:值太小,autocorrelation同相关明显
condition number太大:远远高于30,多重共线明显

Scikits.bootstrap provides bootstrap confidence interval algorithms for scipy.
At present, it is rather feature-incomplete and in flux. However, the functions that have been written should be relatively stable as far as results.
Much of the code has been written based off the descriptions from Efron and Tibshirani's Introduction to the Bootstrap, and results should match the results obtained from following those explanations. However, the current ABC code is based off of the modified-BSD-licensed R port of the Efron bootstrap code, as I do not believe I currently have a sufficient understanding of the ABC method to write the code independently.
In any case, please contact me (Constantine Evans <cevans@evanslabs.org>) with any questions or suggestions. I'm trying to add documentation, and will be adding tests as well. I'm especially interested, however, in how the API should actually look; please let me know if you think the package should be organized differently.
The package is licensed under the Modified BSD License.
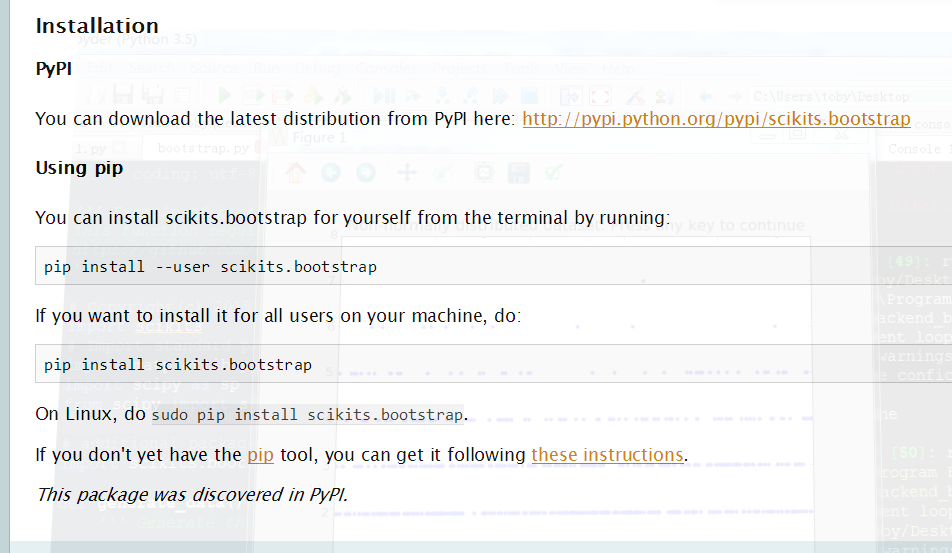
pip install scikits.bootstrap
# -*- coding: utf-8 -*-

''' Example of bootstrapping the confidence interval for the mean of a sample distribution

This function requires "bootstrap.py", which is available from

https://github.com/cgevans/scikits-bootstrap

'''

# Copyright(c) 2015, Thomas Haslwanter. All rights reserved, under the CC BY-SA 4.0 International License

import scikits

# Import standard packages

import matplotlib.pyplot as plt

import scipy as sp

from scipy import stats

# additional packages

import scikits.bootstrap as bootstrap

def generate_data():

    ''' Generate the data for the bootstrap simulation '''

    # To get reproducable values, I provide a seed value

    sp.random.seed(987654321)

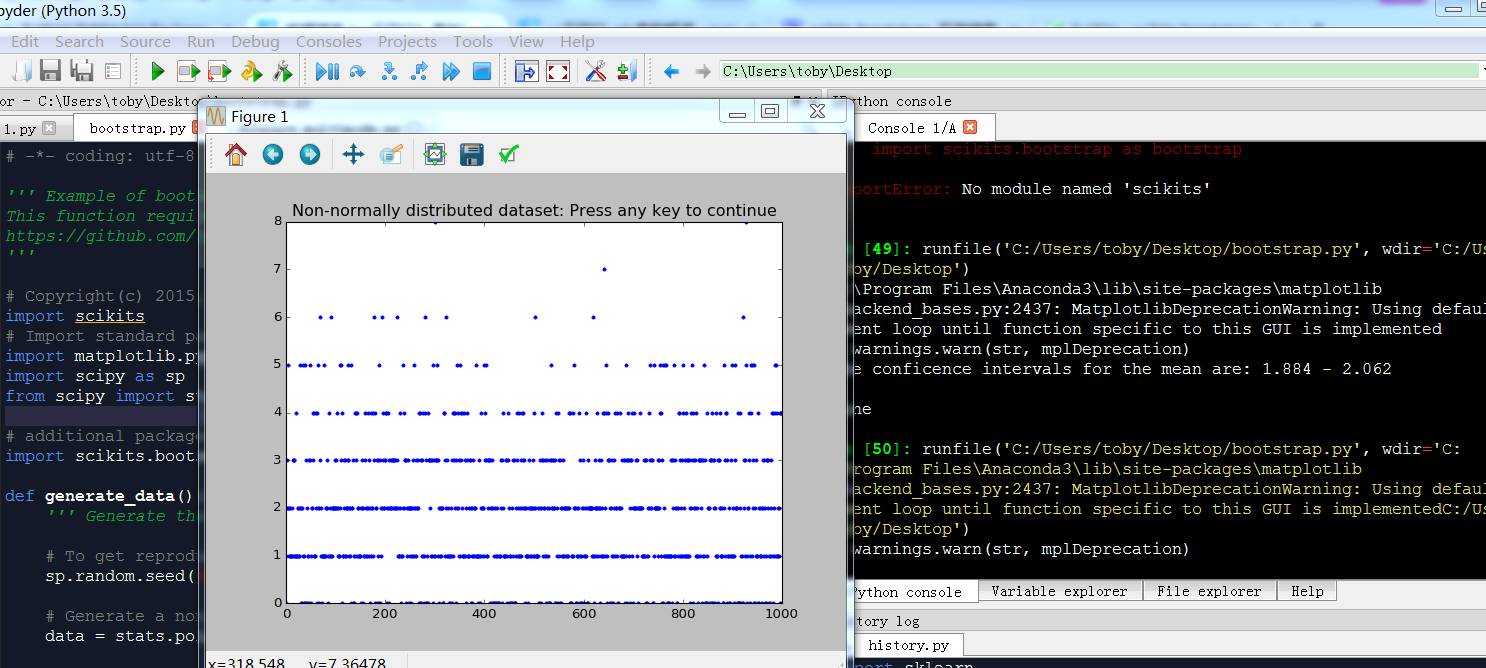
    # Generate a non-normally distributed datasample

    data = stats.poisson.rvs(2, size=1000)

    # Show the data

    plt.plot(data, '.')

    plt.title('Non-normally distributed dataset: Press any key to continue')

    plt.waitforbuttonpress()

    plt.close()

    return(data)

def calc_bootstrap(data):

    ''' Find the confidence interval for the mean of the given data set with bootstrapping. '''

    # --- >>> START stats <<< ---

    # Calculate the bootstrap

    CIs = bootstrap.ci(data=data, statfunction=sp.mean)

    # --- >>> STOP stats <<< ---

    # Print the data: the "*" turns the array "CIs" into a list

    print(('The conficence intervals for the mean are: {0} - {1}'.format(*CIs)))

    return CIs

if __name__ == '__main__':

    data = generate_data()

    calc_bootstrap(data)

    input('Done')

bootstrapping 解决不知道分布情况下,计算平均值的置信区间

python信用评分卡建模(附代码,博主录制)

一元回归1_基础(python代码实现)的更多相关文章
- 逻辑回归原理(python代码实现)
Logistic Regression Classifier逻辑回归主要思想就是用最大似然概率方法构建出方程,为最大化方程,利用牛顿梯度上升求解方程参数. 优点:计算代价不高,易于理解和实现. 缺点: ...
- 【机器学习速成宝典】模型篇03逻辑斯谛回归【Logistic回归】(Python版)
目录 一元线性回归.多元线性回归.Logistic回归.广义线性回归.非线性回归的关系 什么是极大似然估计 逻辑斯谛回归(Logistic回归) 多类分类Logistic回归 Python代码(skl ...
- 机器学习/逻辑回归(logistic regression)/--附python代码
个人分类: 机器学习 本文为吴恩达<机器学习>课程的读书笔记,并用python实现. 前一篇讲了线性回归,这一篇讲逻辑回归,有了上一篇的基础,这一篇的内容会显得比较简单. 逻辑回归(log ...
- python基础:测量python代码的运行时间
Python社区有句俗语:“python自己带着电池” ,别自己写计时框架.Python 2.3 具备一个叫做 timeit 的完美计时工具可以测量python代码的运行时间. timeit模块 ti ...
- python基础autopep8__python代码规范
关于PEP 8 PEP 8,Style Guide for Python Code,是Python官方推出编码约定,主要是为了保证 Python 编码的风格一致,提高代码的可读性. 官网地址:http ...
- python基础===autopep8__python代码规范
关于PEP 8 PEP 8,Style Guide for Python Code,是Python官方推出编码约定,主要是为了保证 Python 编码的风格一致,提高代码的可读性. 官网地址:http ...
- python代码注释 - python基础入门(4)
在 python改变世界,从hello world开始 中我们已经完成了第一个python程序,代码是有了,关键是好像好不知道写的啥玩意? 一.什么是代码注释 代码注释就是给一段代码加上说明,表明这段 ...
- 『无为则无心』Python基础 — 4、Python代码常用调试工具
目录 1.Python的交互模式 2.IDLE工具使用说明 3.Sublime3工具的安装与配置 (1)Sublime3的安装 (2)Sublime3的配置 4.使用Sublime编写并调试Pytho ...
- Python代码样例列表
扫描左上角二维码,关注公众账号 数字货币量化投资,回复“1279”,获取以下600个Python经典例子源码 ├─algorithm│ Python用户推荐系统曼哈顿算法实现.py│ ...
随机推荐
- HBASE学习笔记(三)
一. 1.预切割:在创建表的时候,预先对表进行region切割.切割线就是rowkey $hbase> create '] $hbase>create 'ns2:t3',SPLITS=&g ...
- 阿里服务器+Centos7.4+Tomcat+JDK部署
适用对象 本文档介绍如何使用一台基本配置的云服务器 ECS 实例部署 Java web 项目.适用于刚开始使用阿里云进行建站的个人用户. 配置要求 这里列出的软件版本仅代表写作本文档使用的版本.操作时 ...
- wpf Textbox 回车就换行
将 TextWrapping 属性设置为 Wrap 会导致输入的文本在到达 TextBox 控件的边缘时换至新行,必要时会自动扩展 TextBox 控件以便为新行留出空间. 将 AcceptsRetu ...
- inux下:热插拔和模块是什么
一.何为模块? 文件系统.设备驱动程序.网络协议都可以理解为模块.模块本质也是普通的软件系统. 二.热插拔 硬件层面:只在不断电.不关闭系统的情况下增加或者删除对应部件,比如电源.硬盘.一些高端设备硬 ...
- java.util.Arrays (JDK 1.7)
1.asList //返回由指定数组支持的固定大小的列表,返回的列表是可序列化的 public static <T> List<T> asList(T... a) { retu ...
- Nagios监控系统部署(源码)(四)
Nagios监控系统部署(源码) 1. 概述2. 部署Nagios2.1 创建Nagios用户组2.2 下载Nagios和Nagios-plugin源码2.3 编译安装3. 部署Nagios-pl ...
- 上传大文件(100G)的解决方案
4GB以上超大文件上传和断点续传服务器的实现 随着视频网站和大数据应用的普及,特别是高清视频和4K视频应用的到来,超大文件上传已经成为了日常的基础应用需求. 但是在很多情况下,平台运营方并没有大文件上 ...
- luoguP3723 HNOI2017 礼物
链接 首先,两个手环增加非负整数亮度,等于其中一个增加一个整数亮度,可以为负. 令增加量为\(x\),旋转以后的原数列为,那么在不考虑转圈圈的情况下,现在的费用就是: \[\sum_{i=1}^n\l ...
- mysql<七>
-- ########## 01.集合逻辑 ########## -- MySQL中,只实现了一种集合逻辑:逻辑与,有两种用法:UNION 和 UNION ALL -- 临时表1 CREATE TAB ...
- GET和POST请求的区别和使用场景
本质上的区别: GET请求.处理.响应过程中只是产生一个TCP数据包,而POST请求会产生两个TCP数据包. 更具体地说,GET请求过程中头和请求正文数据一起到服务器端, 而POST请求过程中, ...
