pandas 进行excel绘图
python主流绘图工具:matplotlib ,seaborn,pandas ,openpyxl ,xslwriter
openpyxl :首先说下这个官网的demo,看的有点懵,没有具体说明多个图在一个excel引用不通ws Rererence 只是简单的一个deepcopy 用的一点懵逼,反正我是没看懂,其次多sheet写入也未做拓展,
看了下博客哪些水军一篇粘贴复制毫无新意:
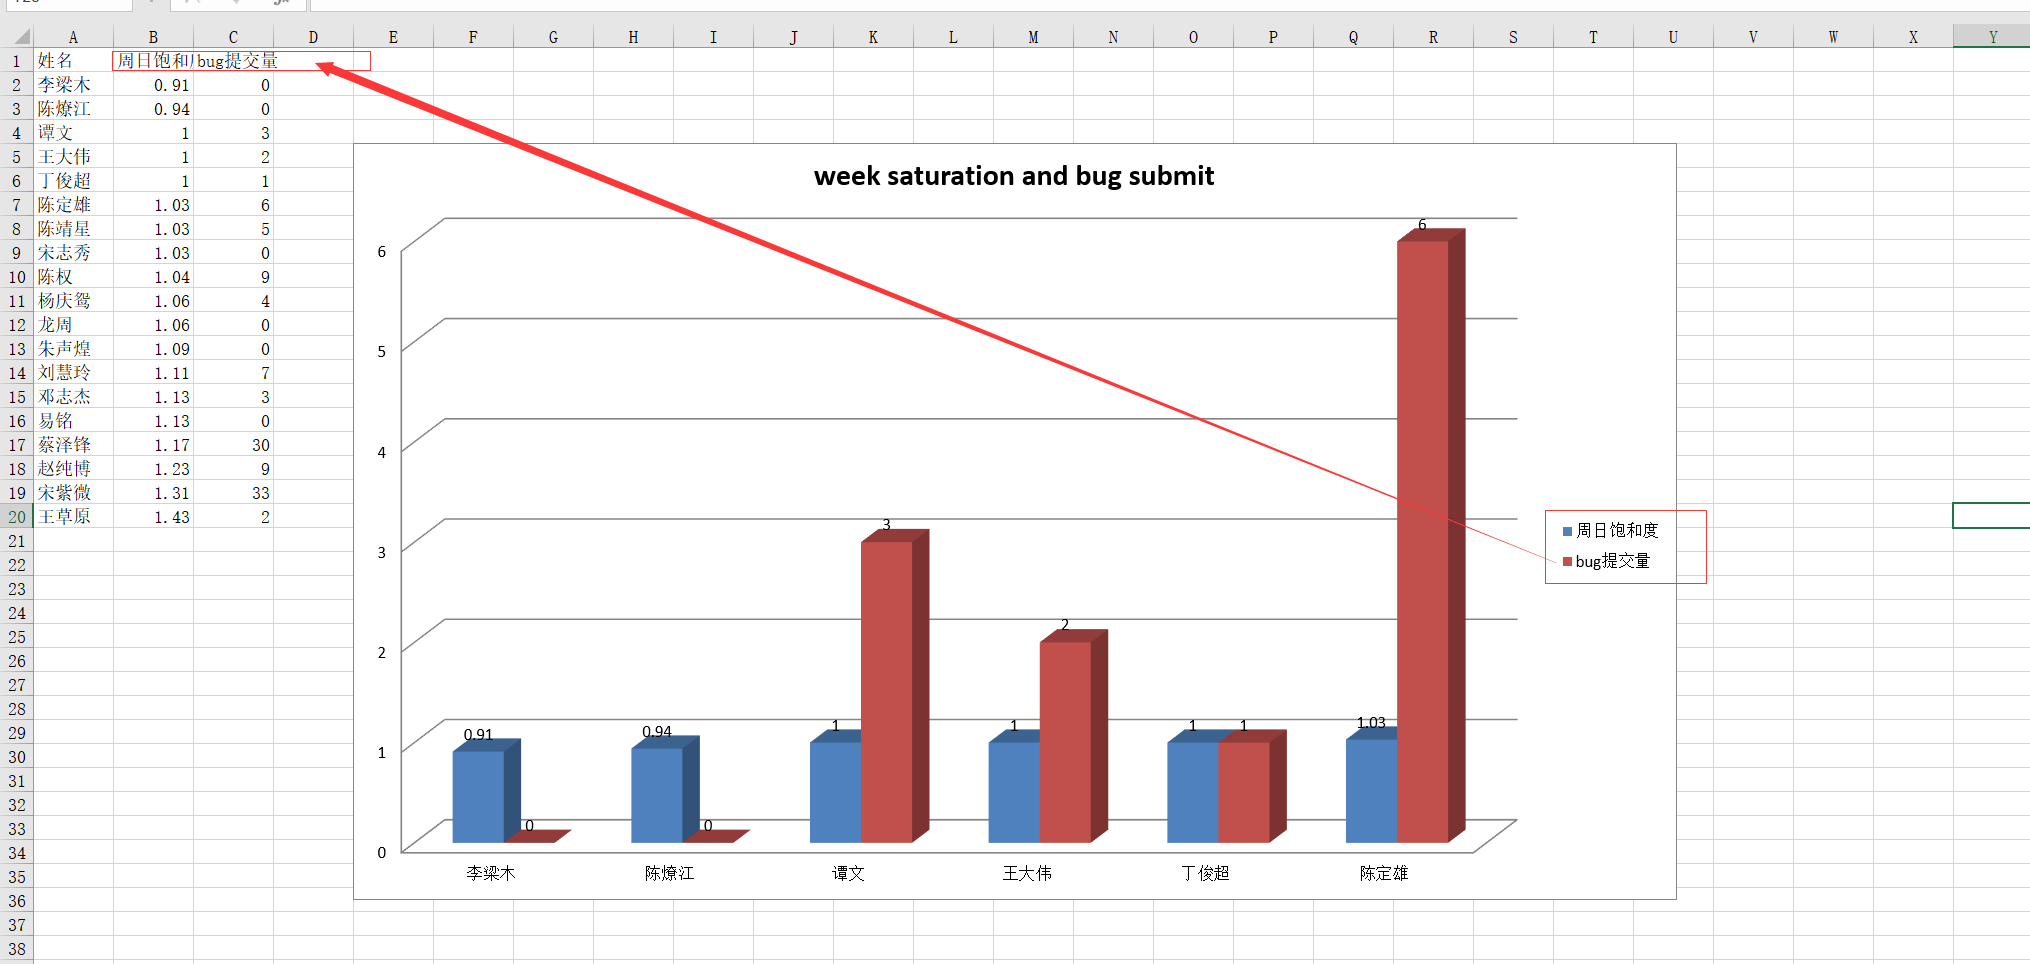
下面以openpyxl 3d bar 柱状图为例:演示效果多sheet 生成柱状图:
官网:https://openpyxl.readthedocs.io/en/latest/charts/bar.html#d-bar-charts
from openpyxl import Workbook

from openpyxl.chart import (

    Reference,

    Series,

    BarChart3D,

)

def bar_3d(configurations: dict):

    """"

    paint 3d bar in the excel ,

    configuration={"data":None,"Title":None,"sheet_name":None,"index":None}

    data:[

    [姓名,column1,column2],

    [value_name,value_col1,value_col2],

    [value_name2,value_column2,value_column2]

    ]

    """

    wb = Workbook()

    for configuration in configurations:

        sheet = configuration["sheet_name"]

        ws = wb.create_sheet(sheet, index=configuration["index"])

        rows = configuration["data"]

        rows.insert(0, configuration["axis_x"])

        for row in rows:

            ws.append(row)

        data = Reference(ws, min_col=2, min_row=1, max_col=3, max_row=7)

        titles = Reference(ws, min_col=1, min_row=2, max_row=7)

        chart = BarChart3D()

        chart.title = configuration["Title"]

        chart.add_data(data=data, titles_from_data=True)

        chart.set_categories(titles)

        chart.height=16

        chart.width=28

        chart.shape="box"

        ws.add_chart(chart, "E5")

    save_path = "test_static.xlsx"

    wb.save(save_path)
解释参数:configurations 是一个存放许多configranition 的列表:每个configration 结构如注释:
configuration={"data":None,"Title":None,"sheet_name":None,"index":None}

    data:[

    [value_name,value_col1,value_col2],

    [value_name2,value_column2,value_column2]

    ]
data就是要写入的数据包含header 和value,data[0]是表头,data[1:]全部是数据,index代表插入excel的sheet的index也就是第几个sheet,Title是绘制柱状图的title:
chart.height是图表的高度,width是宽度,add_chart 是插入chart 方法“E5"指定在excel插入位置,
rows.insert(0, configuration["axis_x"]) 这里插入是type分类的名称也就是rows.insert(0,[姓名,column1,column2])
,看个实际效果吧这个type就对应周日饱和,和bug提交量两列
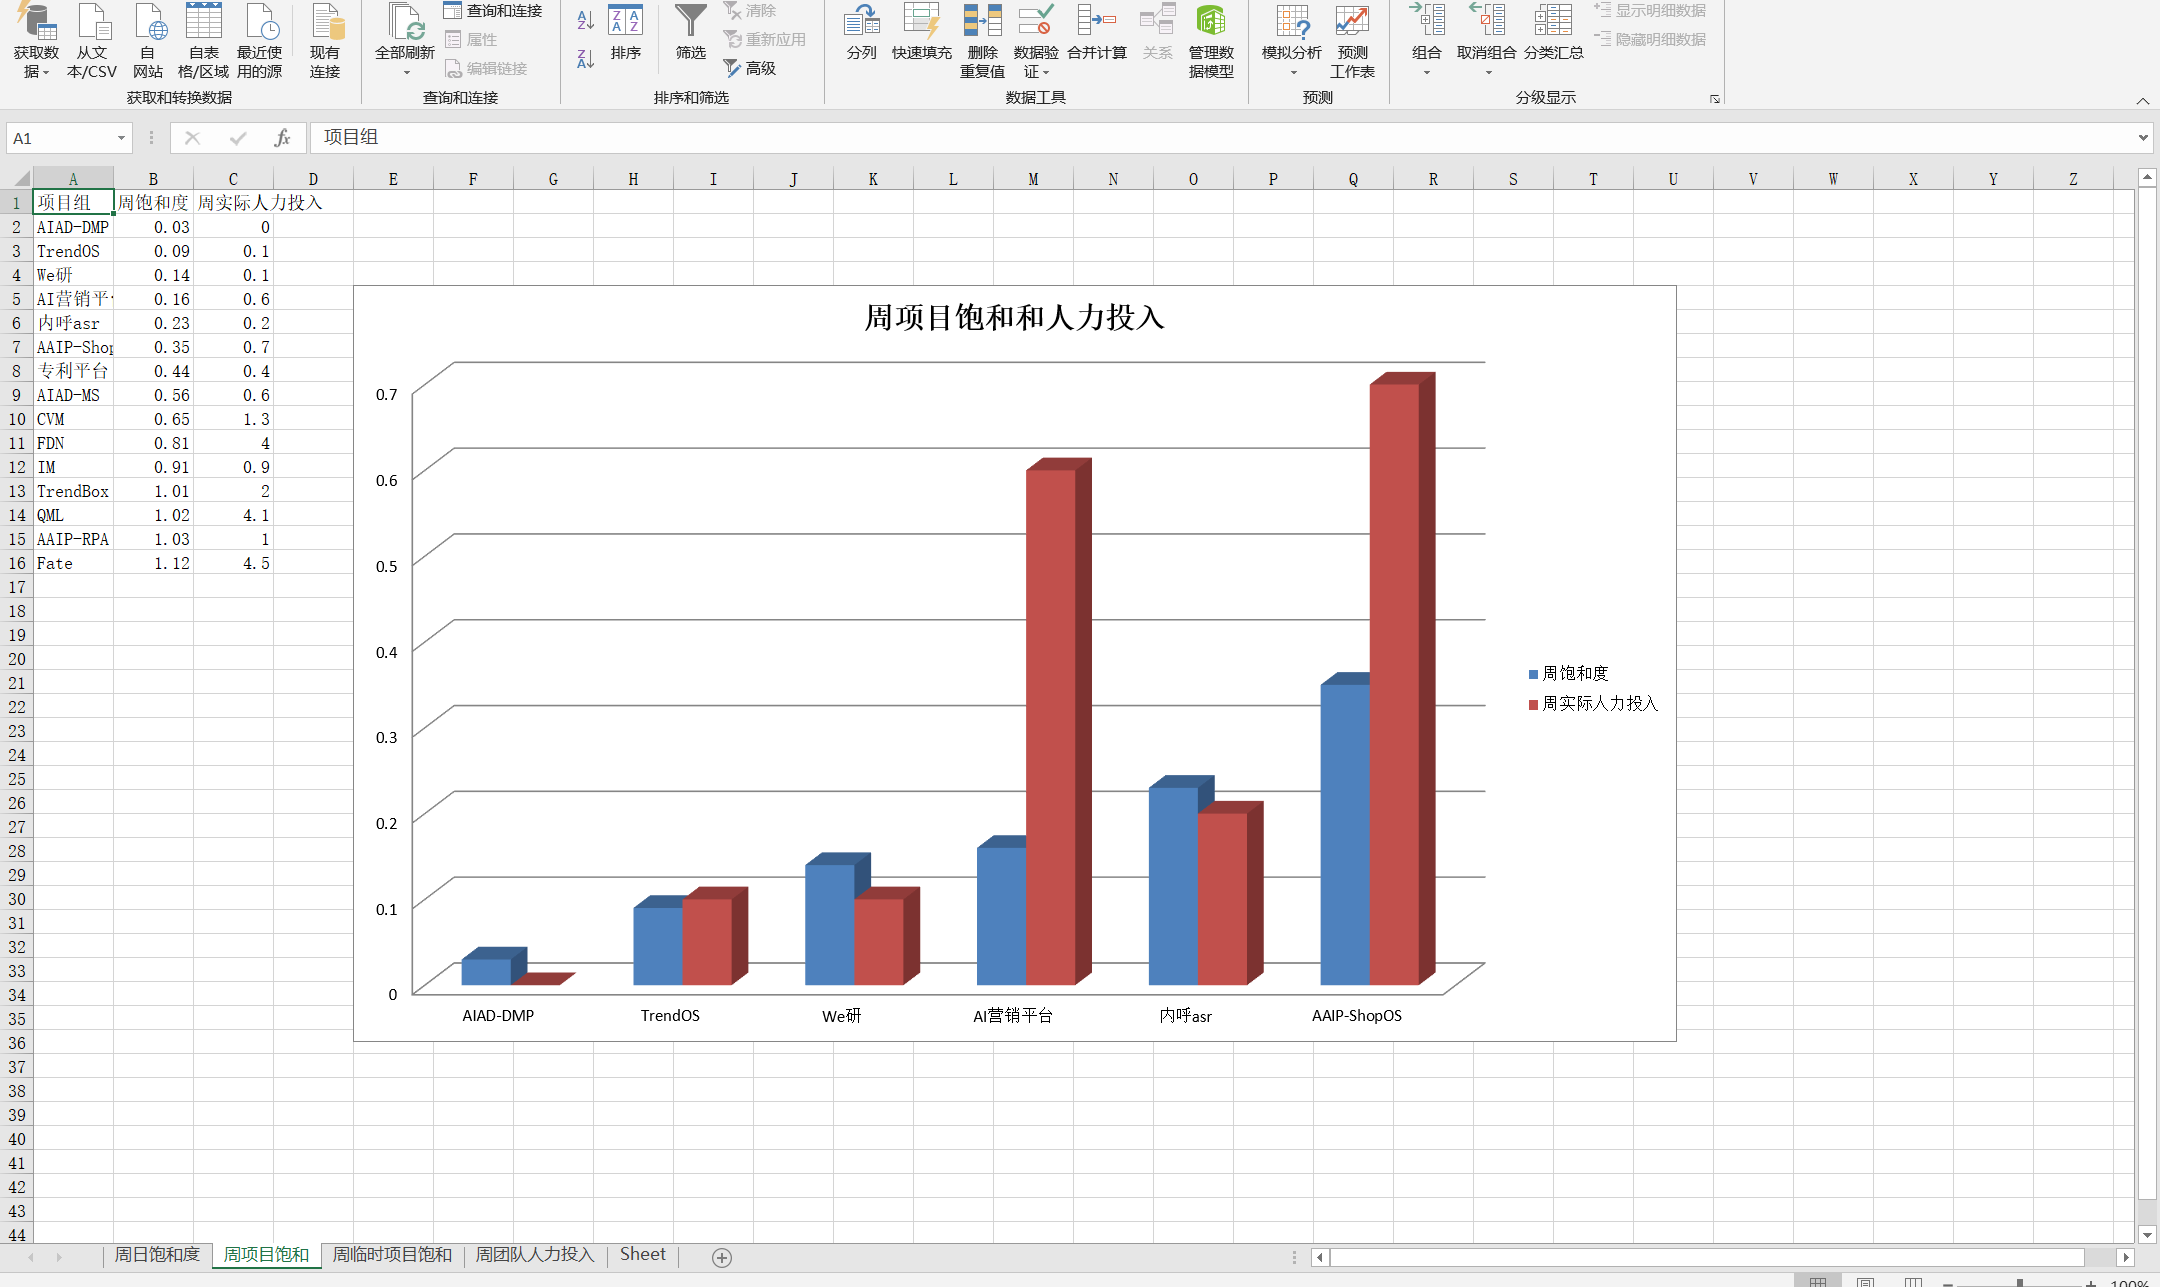
多个sheet查看:
第二部分:使用pandas 绘图结合xslwriter:
官网:https://xlsxwriter.readthedocs.io/example_pandas_chart_columns.html
我就直接上代码了数据自己造了个用pandas:
import pandas as pd

def panda_chart(df_list, cols, title_x, title_y):

    """

    data of narray

    index of data_frame:  [0,1,2,3]

    cols numbers of static columns

    """

    writer = pd.ExcelWriter('pandas_chart_columns2.xlsx', engine='xlsxwriter')

    for i, df in enumerate(df_list):

        # df = pd.DataFrame(data, index=None, columns=["姓名", "饱和度", "人力"])

        sheet_name = f'Sheet{i}'

        df.to_excel(writer, sheet_name=sheet_name,index=False)

        workbook = writer.book

        worksheet = writer.sheets[sheet_name]

        chart = workbook.add_chart({'type': 'column'})

        # set colors for the chart each type .

        colors = ['#E41A1C', '#377EB8']  # , '#4DAF4A', '#984EA3', '#FF7F00']

        # Configure the series of the chart from the dataframe data.

        for col_num in range(1, cols + 1):

            chart.add_series({

                'name':       [f'{sheet_name}', 0, col_num],

                'categories': [f'{sheet_name}', 1, 0, 4, 0],  # axis_x start row ,start col,end row ,end col

                'values':     [f'{sheet_name}', 1, col_num, 4, col_num],  # axis_y value of

                'fill':       {'color':  colors[col_num - 1]},  # each type color choose

                'overlap': -10,

            })

        # Configure the chart axes.

        chart.set_x_axis({'name': f'{title_x}'})

        chart.set_y_axis({'name': f'{title_y}', 'major_gridlines': {'visible': False}})

        chart.set_size({'width': 900, 'height': 400})

        # Insert the chart into the worksheet.

        worksheet.insert_chart('H2', chart)

    writer.save()

if __name__ == '__main__':

    data=[("a",2,4),("b",5,7)]

    df = pd.DataFrame(data, index=None, columns=["姓名", "饱和度", "人力"])

    panda_chart([df],2,"title x","title y")

pandas 进行excel绘图的更多相关文章
- 深入理解pandas读取excel,txt,csv文件等命令
pandas读取文件官方提供的文档 在使用pandas读取文件之前,必备的内容,必然属于官方文档,官方文档查阅地址 http://pandas.pydata.org/pandas-docs/versi ...
- Python利用pandas处理Excel数据的应用
Python利用pandas处理Excel数据的应用 最近迷上了高效处理数据的pandas,其实这个是用来做数据分析的,如果你是做大数据分析和测试的,那么这个是非常的有用的!!但是其实我们平时在做 ...
- 51-python3 pandas读写excel
转载自:https://blog.csdn.net/brink_compiling/article/details/76890198?locationNum=7&fps=1 0. 前言Pyth ...
- pandas 将excel一列拆分成多列重新保存
利用pd.read_excel 做到将第二列“EVT-LBL”按“-”分割后重新加三列在df后面 1 读取表格df 2. 分割第二列短横连接的数字,保存到df2---- 参考:str.spilt( ...
- 【python基础】利用pandas处理Excel数据
参考:https://www.cnblogs.com/liulinghua90/p/9935642.html 一.安装第三方库xlrd和pandas 1:pandas依赖处理Excel的xlrd模块, ...
- Python 使用Pandas读取Excel的学习笔记
这里介绍Python中使用Pandas读取Excel的方法 一.软件环境: OS:Win7 64位 Python 3.7 二.文件准备 1.项目结构: 2.在当前实验文件夹下建立一个Source文件夹 ...
- 机器学习之数据预处理,Pandas读取excel数据
Python读写excel的工具库很多,比如最耳熟能详的xlrd.xlwt,xlutils,openpyxl等.其中xlrd和xlwt库通常配合使用,一个用于读,一个用于写excel.xlutils结 ...
- pandas read excel文件碰到的一个小问题
今天利用pandas读取excel时,爆出如下错误: 代码为: import pandas as pd db_eua=pd.read_excel('db_eua.xlsx',sheetname='EU ...
- Python用Pandas读写Excel
Pandas是python的一个数据分析包,纳入了大量库和一些标准的数据模型,提供了高效地操作大型数据集所需的工具.Pandas提供了大量能使我们快速便捷地处理数据的函数和方法. Pandas官方文档 ...
随机推荐
- Sentence by defender
也许,人在旅途,不是你看清了多少事,而是你看轻了多少事.
- ElementUI的el-table的多选的取消选择和筛选的取消所有过滤器之ref冲突问题
写此文的缘由:现如今,网络上,没有同下的解释形式(或者在外网,所以我没找到,或者大佬觉得太简单所以不屑解释).然而,我认为这是对VUE+ElementUI的底层框架的理解深入化问题.(为什么要深入理解 ...
- Jmeter-第三方插件安装
1.插件下载 官方地址https://jmeter-plugins.org/install/Install/ 网盘地址链接: https://pan.baidu.com/s/1E4lnMWDGPWCN ...
- 2019-08-22 纪中NOIP模拟A&B组
T1 [JZOJ3229] 回文子序列 题目描述 回文序列是指左右对称的序列.我们会给定一个N×M的矩阵,你需要从这个矩阵中找出一个P×P的子矩阵,使得这个子矩阵的每一列和每一行都是回文序列. 数据范 ...
- C语言 Char* 和Char 用法
分类专栏: C语言 版权声明:本文为博主原创文章,遵循CC 4.0 BY-SA版权协议,转载请附上原文出处链接和本声明. 本文链接:https://blog.csdn.net/imxlw00/ar ...
- 使用pycharm搜索框和正则表达式匹配内容
使用pycharm搜索框和正则表达式匹配内容原创薯饼__ 最后发布于2019-03-04 19:28:53 阅读数 660 收藏展开有时候我们要在爬虫网站中匹配各种各样的文本块,以获取需要的信息,每一 ...
- Alice and Hairdresser
Alice's hair is growing by leaps and bounds. Maybe the cause of it is the excess of vitamins, or may ...
- loj6278 数列分块入门题2
题意:支持区间加,询问区间中元素排名 维护两个域.一个域维护原序列,一个域维护快内排序序列. 每次修改后更新快内排序序列. 修改时O(sqrt(n)log(sqrt(n))) 询问时O(sqrt(n) ...
- SIFT算法原理(3)-确定关键点的主方位,构建关键点描述符
介绍官网:https://docs.opencv.org/3.0-beta/doc/py_tutorials/py_feature2d/py_sift_intro/py_sift_intro.html ...
- 巨杉TechDay回顾 | 技术人的夏天 · 就是这么燃!
在All in Cloud的云计算时代,业务和应用正在不断“云化”,在此过程中云原生(Cloud Native)理念应运而生.作为云化改造的重要部分,云数据库因其天生的弹性扩展能力以及灵活.易用等特点 ...