Prometheus普罗米修斯快速入门
欢迎来到普罗米修斯!
Prometheus是一个监控平台,通过从监控目标的抓取HTTP端点上获取指标。
本指南将展示如何使用和安装Promethues,配置和监视第一个资源。还将下载并安装导出器Exporter,它是在主机和服务上公开时间序列数据的工具。第一个Exporter程序是Promethues本身,它提供大量关于内存使用、垃圾回收等等各种主机级别指标。
一、安装Prometheus
1、下载Prometheus Server
官方下载地址:https://prometheus.io/download/
下载二进制包"prometheus-{version}.linux-amd64.tar.gz"即可!
2、安装Prometheus Server
将二进制包解压到指定目录后,即可完成安装。
root@localhost:~# mkdir /usr/local/promethus

root@localhost:~# tar xzvf prometheus-2.24.0.linux-amd64.tar.gz -C /usr/local/promethus/
3、配置Prometheus Server
在启动Prometheus之前,需要先配置它。
Prometheus配置是YAML格式。在安装完成后会附带一个名为"prometheus.yml"的示例配置文件,这是一个很好的开始。
示例配置文件中有三个配置块:
- global,全局配置块,控制Prometheus Server的全局配置。
- rule_files,加载规则文件配置,rule_files块指定要加载的任何规则文件的位置。
- scrape_configs,抓取配置,控制Prometheus要监视的资源。
root@localhost:/usr/local/promethus/prometheus-2.24.0.linux-amd64# vim prometheus.yml

# 全局配置(global)

global:

  scrape_interval:     15s # 设置抓取间隔时间,默认是1分钟。

  evaluation_interval: 15s # 评估规则间隔时间,默认是1分钟,Prometheus通过使用规则来创建新的时间序列或

                           # 者触发警报。

  # 抓取超时时间"scrape_timeout"在全局配置块(global)中默认是10s。

# 警报管理器(Alertmanager)配置

alerting:

  alertmanagers:

  - static_configs:

    - targets:

      # - alertmanager:9093

# 加载规则(rule)并根据全局中的设置的'evaluation_interval'定期评估它们。

rule_files:

  # - "first_rules.yml"

  # - "second_rules.yml"

# 抓取(scrape)配置

# 这里只有Prometheus本身。由于Prometheus还将关于自身的数据公开为HTTP端点,因此它可以抓取并监视其自身的

# 运行状况。

scrape_configs:

  # 作业名称(job name)

  # 作业名称将作为标签 `job=<job_name>` 添加到从该配置中提取的任何时间序列中。

  - job_name: 'prometheus'

    # 指标的路径metrics_path默认是'/metrics'

    # 访问协议方案scheme默认是'http'。

    # 静态配置

    # 监控目标(target):在本地端口9090上。

    static_configs:

    - targets: ['localhost:9090']
3、启动Prometheus Server
切换到Prometheus目录下指定配置文件运行即可,如果想要在全局运行,请使用全局路径。
默认情况下Prometheus的时序数据存储在"./data"目录下,可以使用"--storage.tsdb.path"选项手动指定时序数据存储目录。
root@localhost:~# cd /usr/local/promethus/prometheus-2.24.0.linux-amd64

root@localhost:/usr/local/promethus/prometheus-2.24.0.linux-amd64# ./prometheus --config.file=./prometheus.yml --storage.tsdb.path=./data
4、访问到WEB控制台
服务启动完成后,可以通过"主机IP:9090"访问到有关于Prometheus自身的状态页(WEB控制台)。给它几秒钟的时间它就会从自己的HTTP端点上采集数据。
可以访问"主机IP:9090/metrics"来导航到指标端点来验证Prometheus是否为自己提供了指标。
root@localhost:~# curl localhost:9090/metrics

go_gc_duration_seconds{quantile="0"} 9.521e-05

go_gc_duration_seconds{quantile="0.25"} 0.000166067

go_gc_duration_seconds{quantile="0.5"} 0.000210993

go_gc_duration_seconds{quantile="0.75"} 0.00023996

go_gc_duration_seconds{quantile="1"} 0.000354466

go_gc_duration_seconds_sum 0.01531654

go_gc_duration_seconds_count 72

...
二、在表达式浏览器中使用PromQL查询时间序列
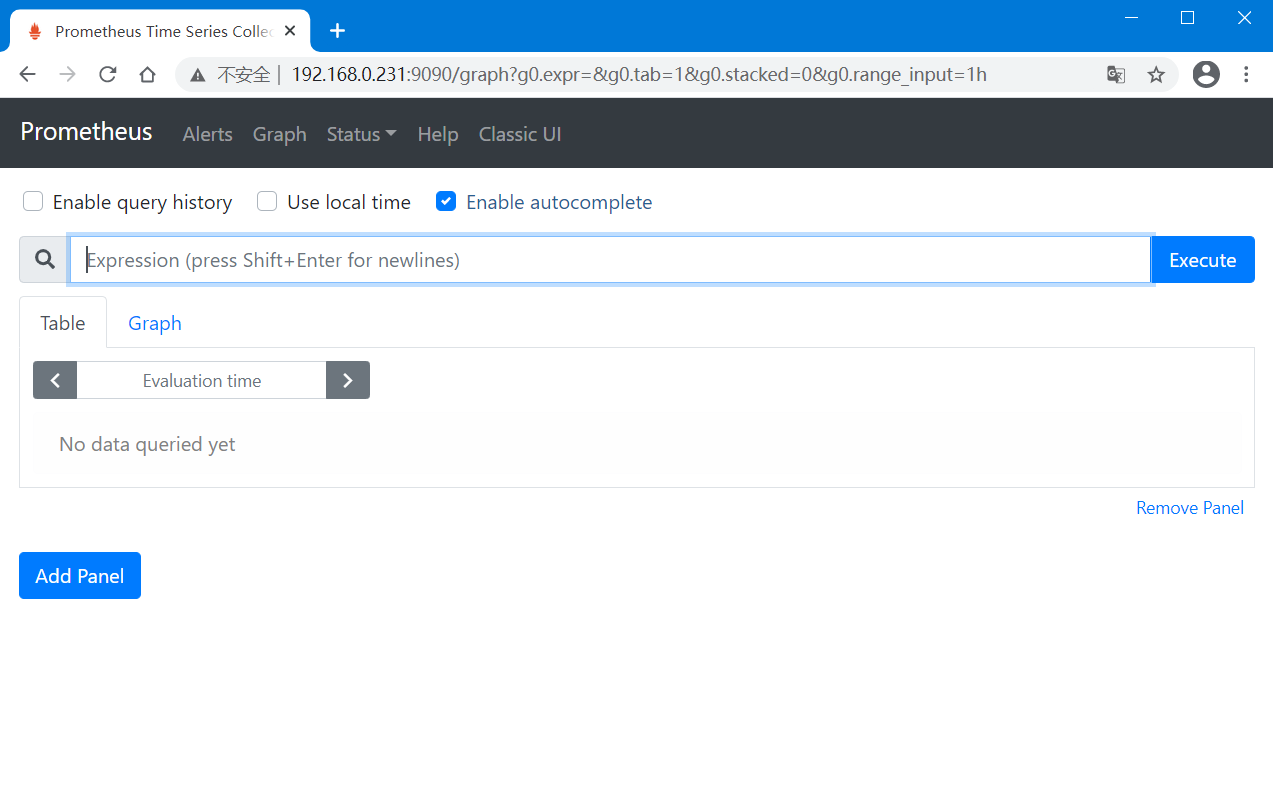
表达式浏览器(Expression Browser),Prometheus提供了一个WEB UI页面,可以使用PromQL表达式来查询和操作时序数据。
筛选时间序列
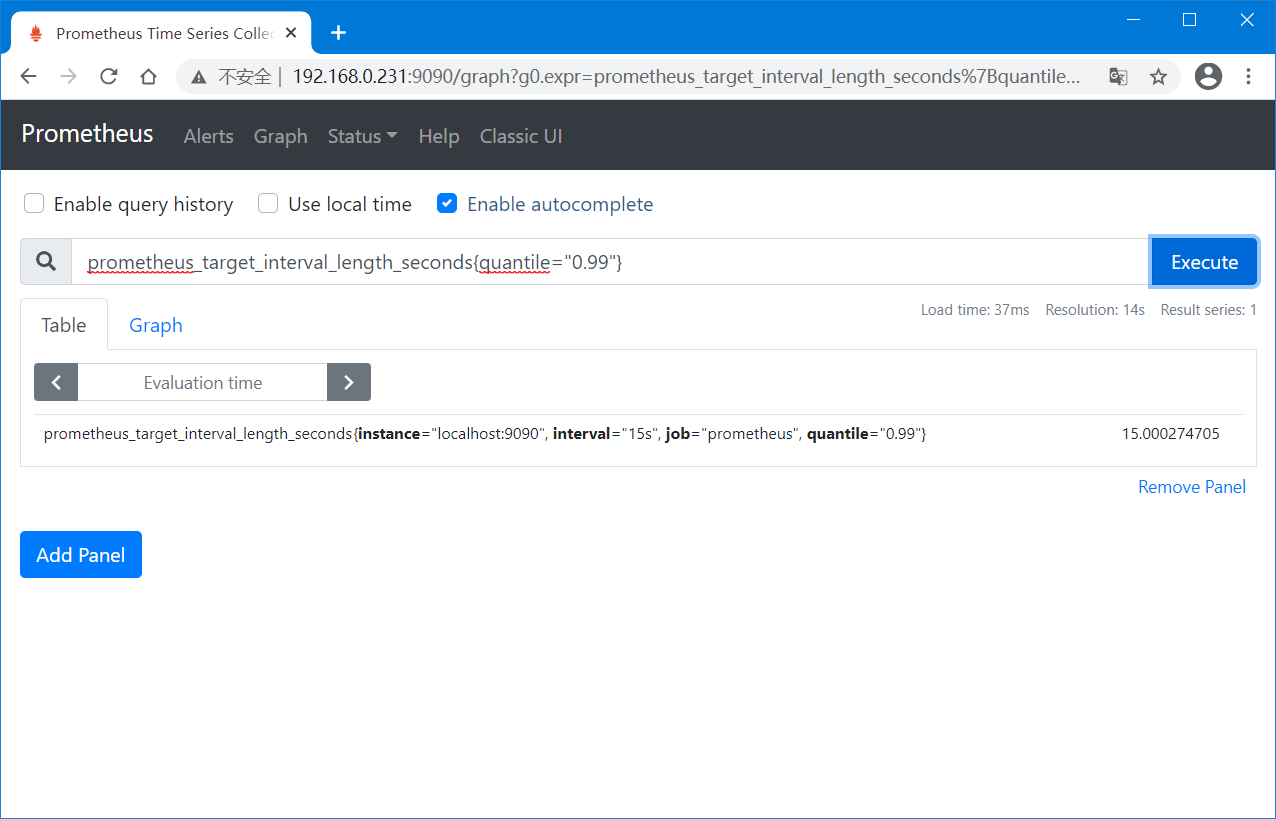
比如想要查看Prometheus采集指标的实际间隔时间,在WEB控制台的"Gtaph"页的搜索栏输入要搜索的指标"prometheus_target_interval_length_seconds",然后点击"Execute"即可获取到不同的时间序列数据。

如果只对0.99延迟的时间序列感兴趣的话(满足条件的时间序列),则可以使用"prometheus_target_interval_length_seconds{quantile="0.99"}",基于标签值不同来筛选出特定的时间序列。
一行时间序列由多个"标签"和左侧的值组成。
如果想要统计指标的数量时,则可以使用表达式"count(prometheus_target_interval_length_seconds)"。

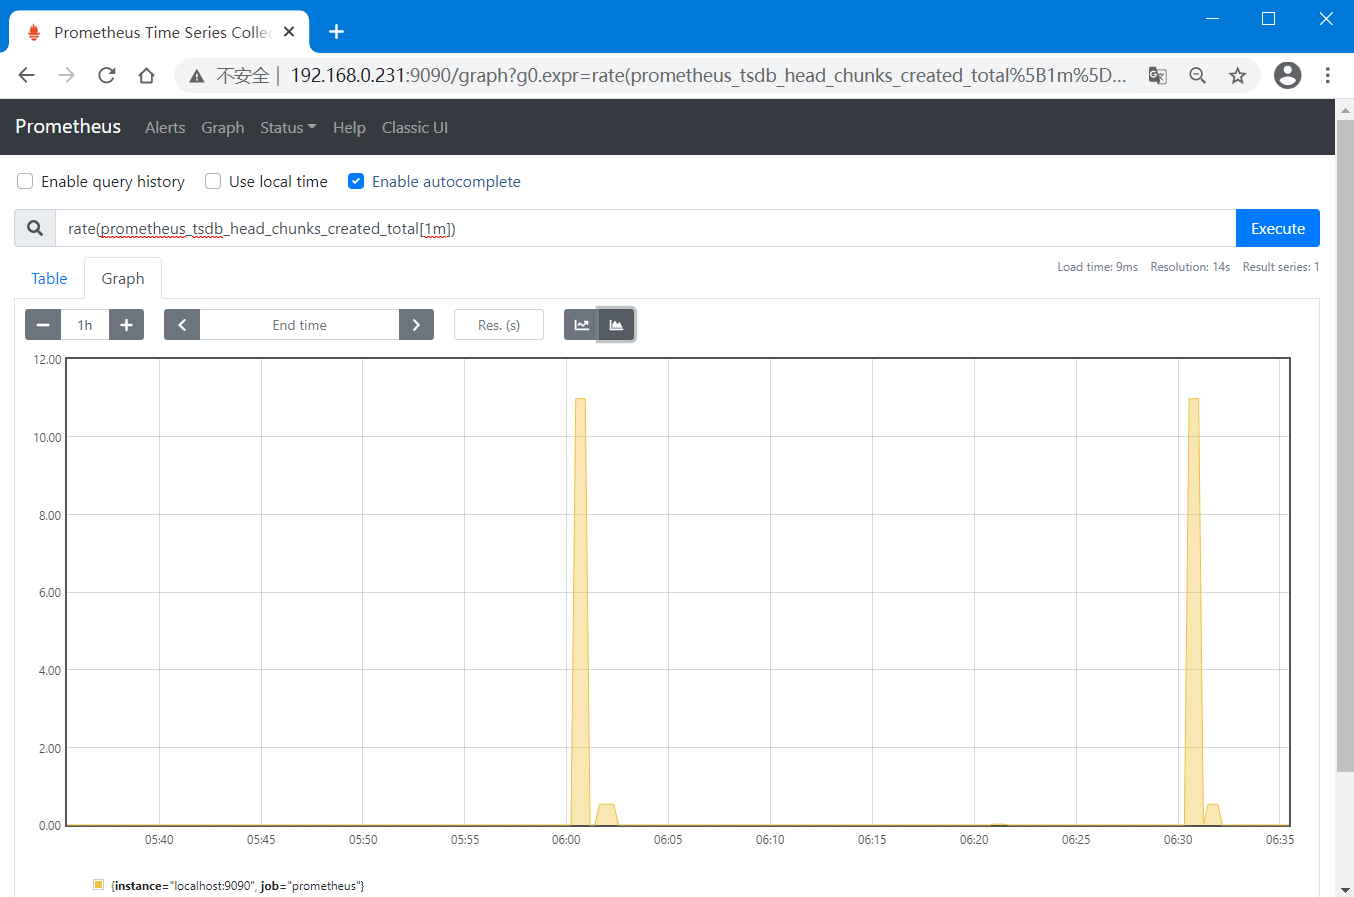
绘制图形
Prometheus还支持使用图形表达式来基于时间序列数据来自动绘制图形。
在WEB控制台"http://主机IP:9090/graph"点击"Graph"选项即可。
比如,想要绘制Prometheus创建数据块的每秒速率的图形,则可以使用表达式"rate(prometheus_tsdb_head_chunks_created_total[1m])"。
三、使用Exporter采集数据
添加一些新的监控目标(Target)用于演示。
添加一个节点导出器(Node Exporter)作为目标(Target),我们需要先安装它。
使用Node Exporter可以监视Linux主机指标,它公开了各种各样的硬件和内核相关指标。
官方下载地址:https://prometheus.io/download/#node_exporter
1、安装Node Exporter
root@localhost:~# tar xzvf node_exporter-1.0.1.linux-amd64.tar.gz -C /usr/local/promethus/

root@localhost:~# cd /usr/local/promethus/node_exporter-1.0.1.linux-amd64/
2、启动Node Exporter
这将会在主机上启动一个HTTP端点,我们也可以直接访问这个端点来获取到指标。
root@localhost:/usr/local/promethus/node_exporter-1.0.1.linux-amd64# ./node_exporter --web.listen-address 127.0.0.1:8080

root@localhost:~# ss -alunpt |grep 8080

tcp    LISTEN     0      128    127.0.0.1:8080                  *:*                   users:(("node_exporter",pid=17413,fd=3))

root@localhost:~# curl localhost:8080/metrics

promhttp_metric_handler_requests_total{code="200"} 1

promhttp_metric_handler_requests_total{code="500"} 0

promhttp_metric_handler_requests_total{code="503"} 0

...
3、配置Prometheus Server
在Prometheus Server配置文件的"scrape_configs"中,添加一个作业,目标指向Node Exporter。
root@localhost:~# cd /usr/local/promethus/prometheus-2.24.0.linux-amd64

root@localhost:/usr/local/promethus/prometheus-2.24.0.linux-amd64# vim prometheus.yml

scrape_configs:

...

  # monitor linux node

  - job_name: 'node'

    static_configs:

      - targets: ['localhost:8080']    # 指定目标,关联Node Exporter

        labels:                        # 添加一个标签,用于识别数据。

          group: 'production'
4、重启Prometheus Server
root@localhost:/usr/local/promethus/prometheus-2.24.0.linux-amd64# ./prometheus --config.file=./prometheus.yml --storage.tsdb.path=./data
5、测试
打开浏览器,访问到WEB控制台,输入表达式"node_cpu_seconds_total"已获取到关于主机CPU使用的相关指标的时序数据。此时已验证Prometheus Server从Node Exporter上获取到相关的监控数据。

四、配置Recoding Rules聚合数据
配置规则将抓取到的数据聚合到新的时间序列中。
尽管可以直接使用表达式从目标中获取到数据,但是当聚合数千个时间序列的时候,查询可能会变慢,所以为了提供查询效率,Prometheus允许通过将表达式预录成一个规则(rule),并每隔一段时间(由"evaluation_interval"控制)应用一次规则,将应用规则生成的数据写入到新的时间序列中。
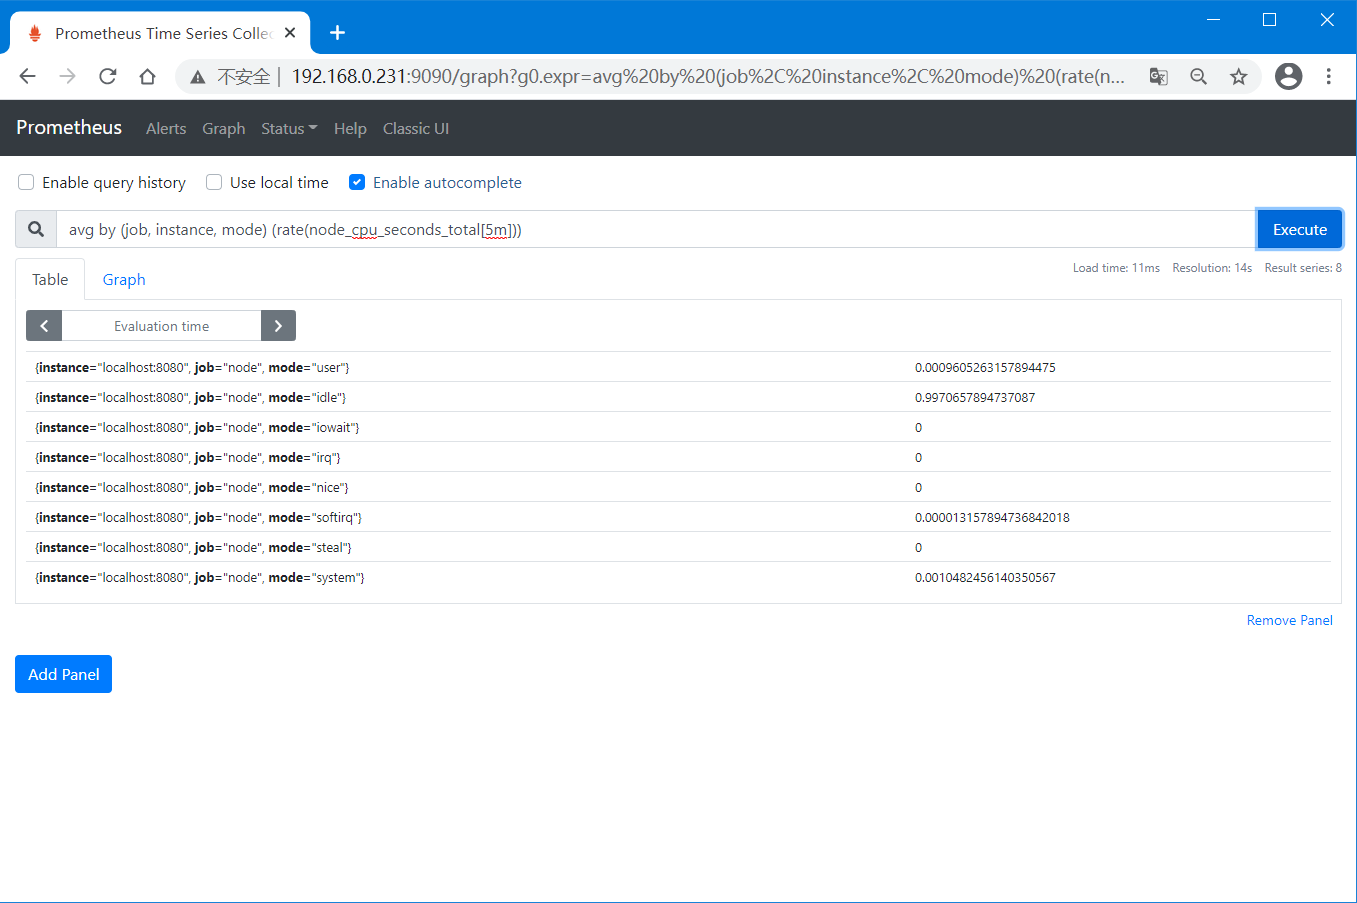
假设我们想要记录5分钟内所有CPU的每秒速率(node_cpu_seconds_total)的平均值,并且保留job、instance和mode标签,则我们可以使用下面表达式
avg by (job, instance, mode) (rate(node_cpu_seconds_total[5m]))
控制台操作:
记录规则(Recoding Rules)的使用
1、创建规则配置文件
root@localhost:~# cd /usr/local/promethus/prometheus-2.24.0.linux-amd64/

root@localhost:/usr/local/promethus/prometheus-2.24.0.linux-amd64# mkdir rules

root@localhost:/usr/local/promethus/prometheus-2.24.0.linux-amd64# vim rules/prometheus.rules.yml

groups:

- name: cpu-node  # 规则名称

  rules:

  - record: job_instance_mode:node_cpu_seconds:avg_rate5m   # 规则记录名称

    expr: avg by (job, instance, mode) (rate(node_cpu_seconds_total[5m]))  # 生成规则所使用的表达式
2、配置Prometheus Server关联规则文件
root@localhost:/usr/local/promethus/prometheus-2.24.0.linux-amd64# vim prometheus.yml

...

rule_files:

    - "/usr/local/promethus/prometheus-2.24.0.linux-amd64/rules/prometheus.rules.yml"

...
3、重启Prometheus Server
root@localhost:/usr/local/promethus/prometheus-2.24.0.linux-amd64# ./prometheus --config.file=./prometheus.yml --storage.tsdb.path=./data
4、访问WEB控制台
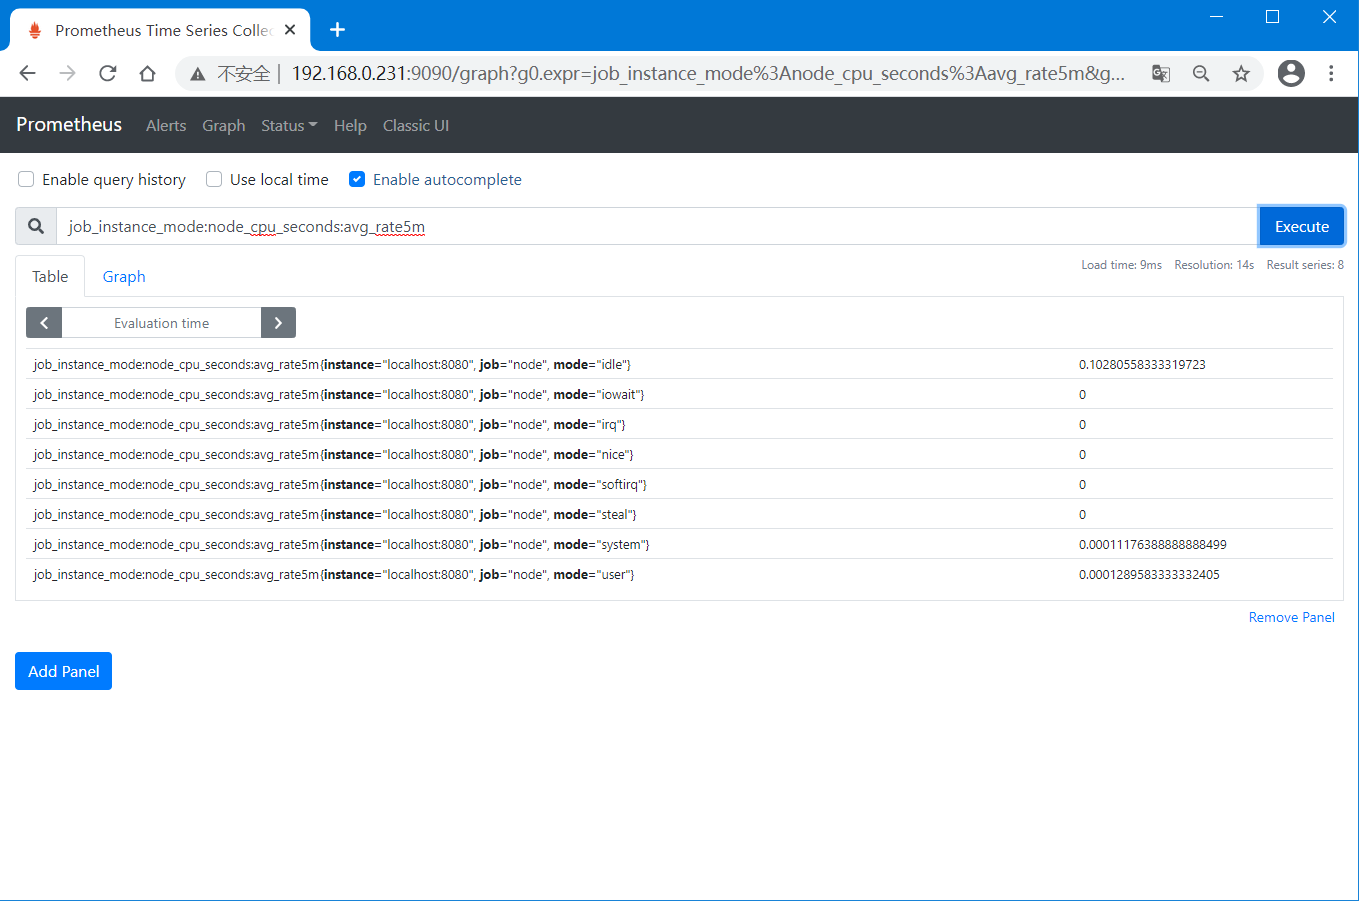
在WEB控制台直接使用规则记录的名称"job_instance_mode:node_cpu_seconds:avg_rate5m"即可搜索到对应的时间序列。
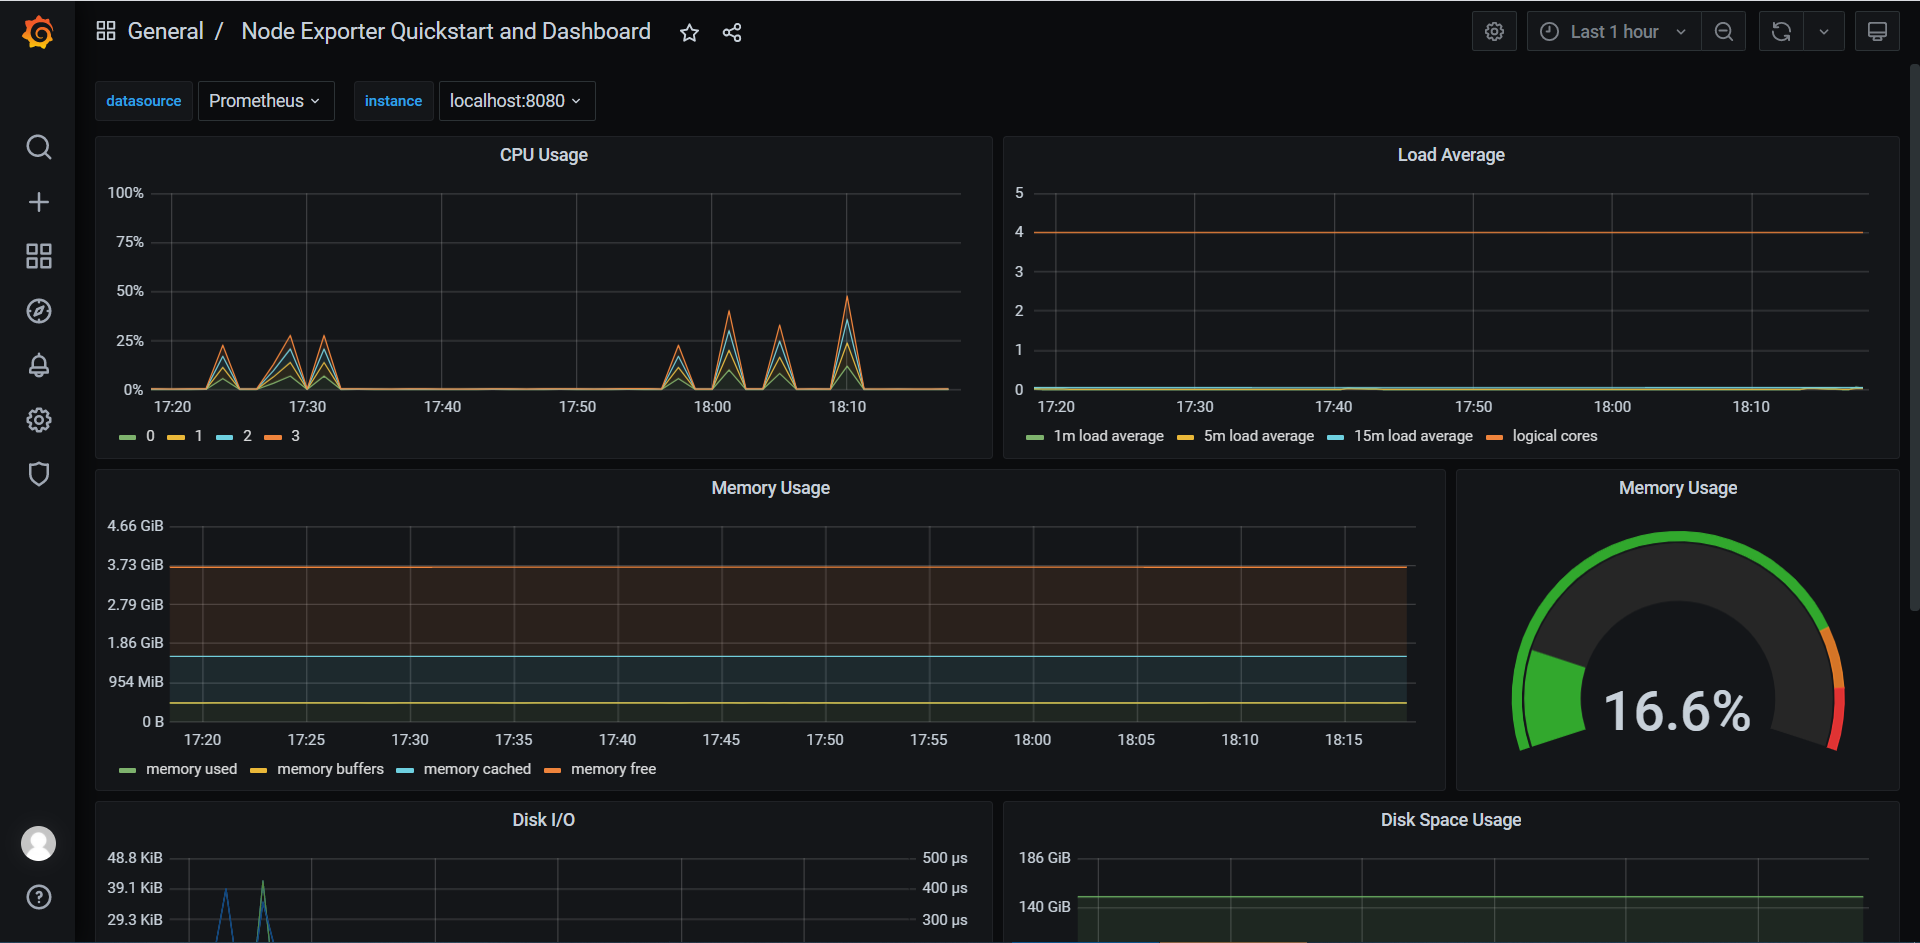
五、使用Grafana展示数据
Grafana是一个开源的图形化数据展示仪表盘应用。
Grafana支持Prometheus查询。从Grafana 2.5.0 (2015-10-28)开始Prometheus可以作为它的数据源。
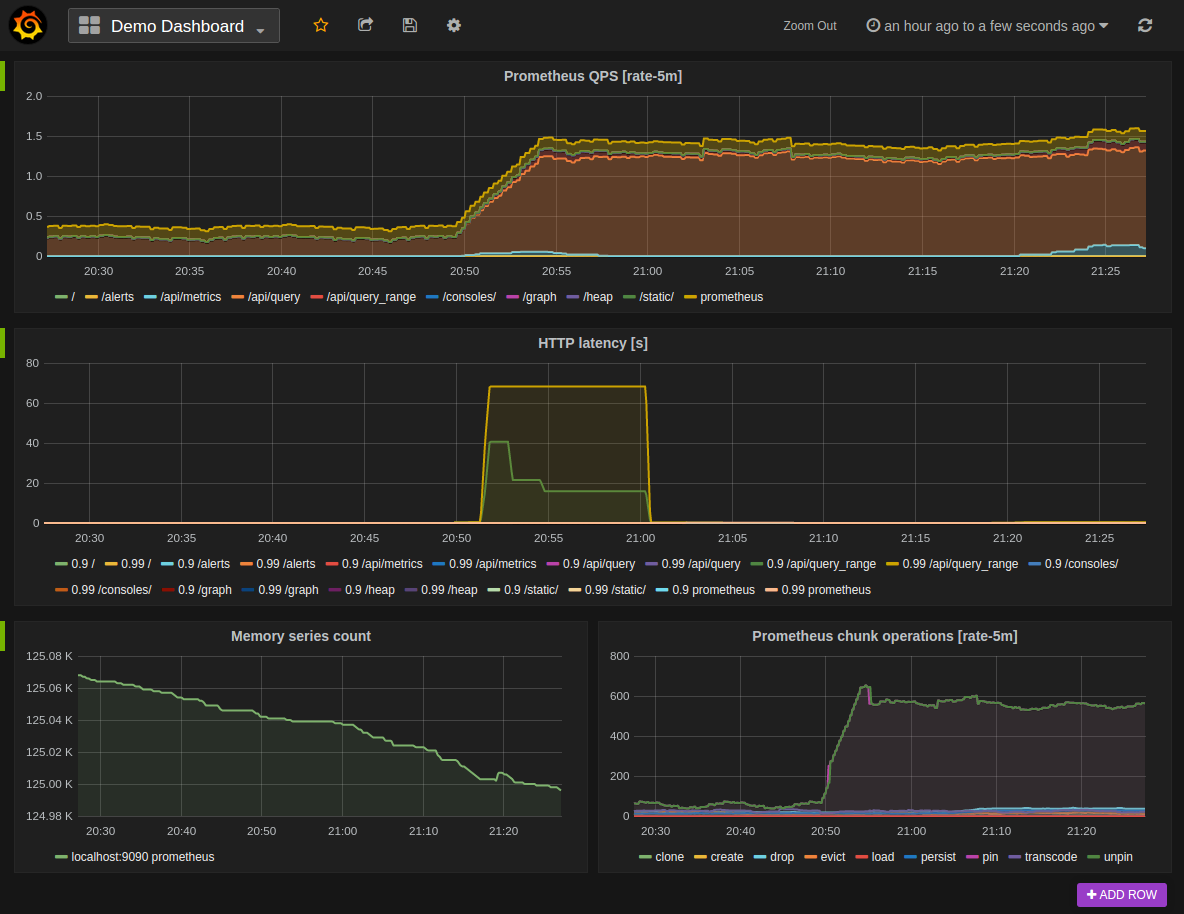
以下显示了一个Grafana dashboard的一个示例,它查询Prometheus的数据。
安装(Installing)
官方下载地址:https://grafana.com/grafana/download?pg=get&plcmt=selfmanaged-box1-cta1
注:建议下载Open-Source版本。
1、下载安装包
[root@localhost ~]# mkdir /usr/local/grafana

[root@localhost ~]# cd /usr/local/grafana/

[root@localhost grafana]# wget https://dl.grafana.com/oss/release/grafana-7.5.3.linux-amd64.tar.gz
2、解压包直接启动服务即可
[root@localhost grafana]# tar xzvf grafana-7.5.3.linux-amd64.tar.gz

[root@localhost grafana]# cd grafana-7.5.3

[root@localhost grafana-7.5.3]# bin/grafana-server
3、浏览器访问
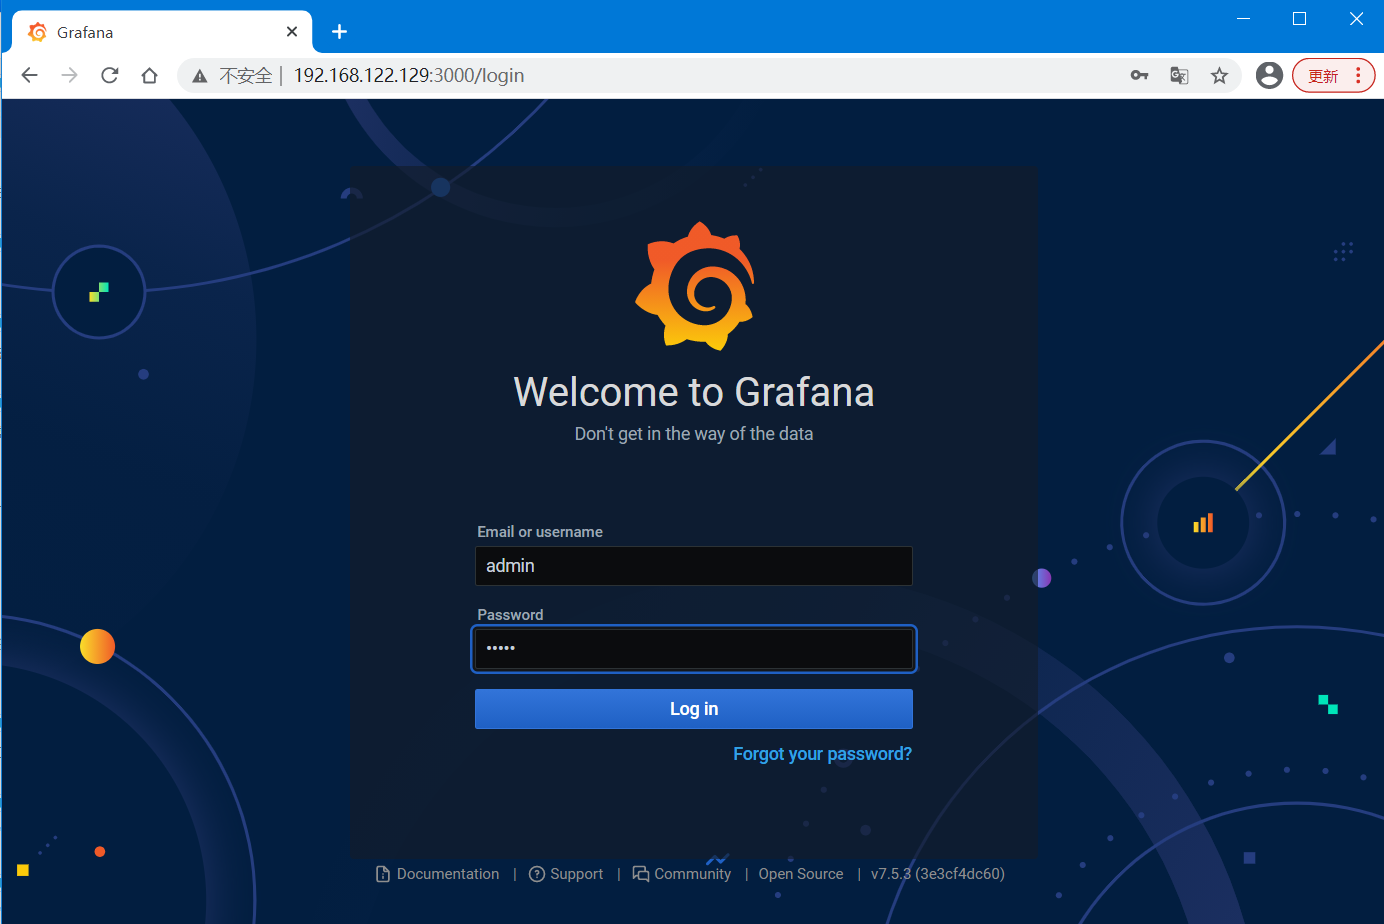
访问地址:http://192.168.122.129:3000/login
默认情况下监听端口是3000,默认登陆账号密码:admin:admin
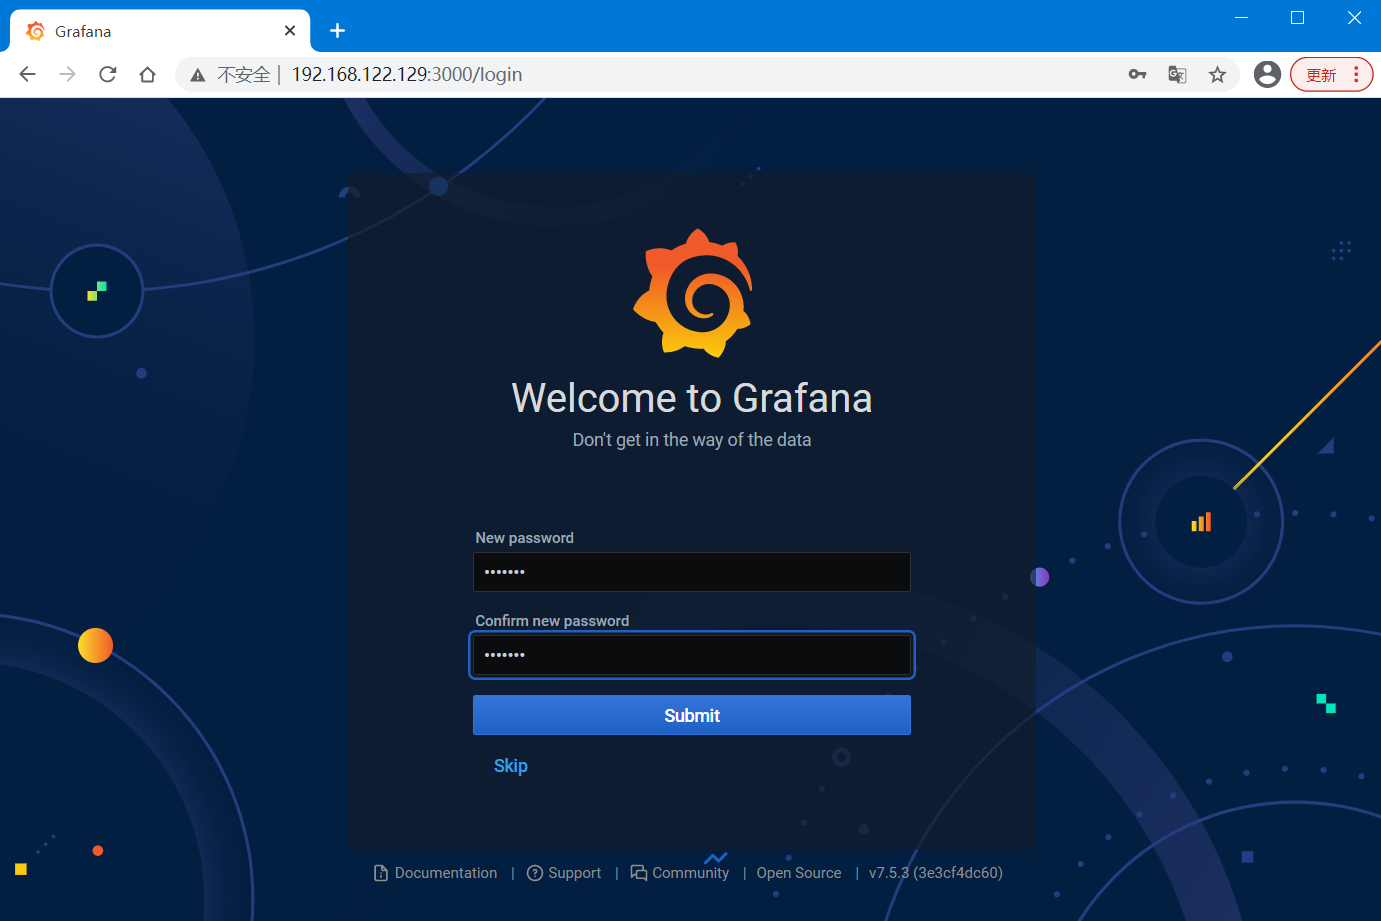
修改密码:
使用(Using)
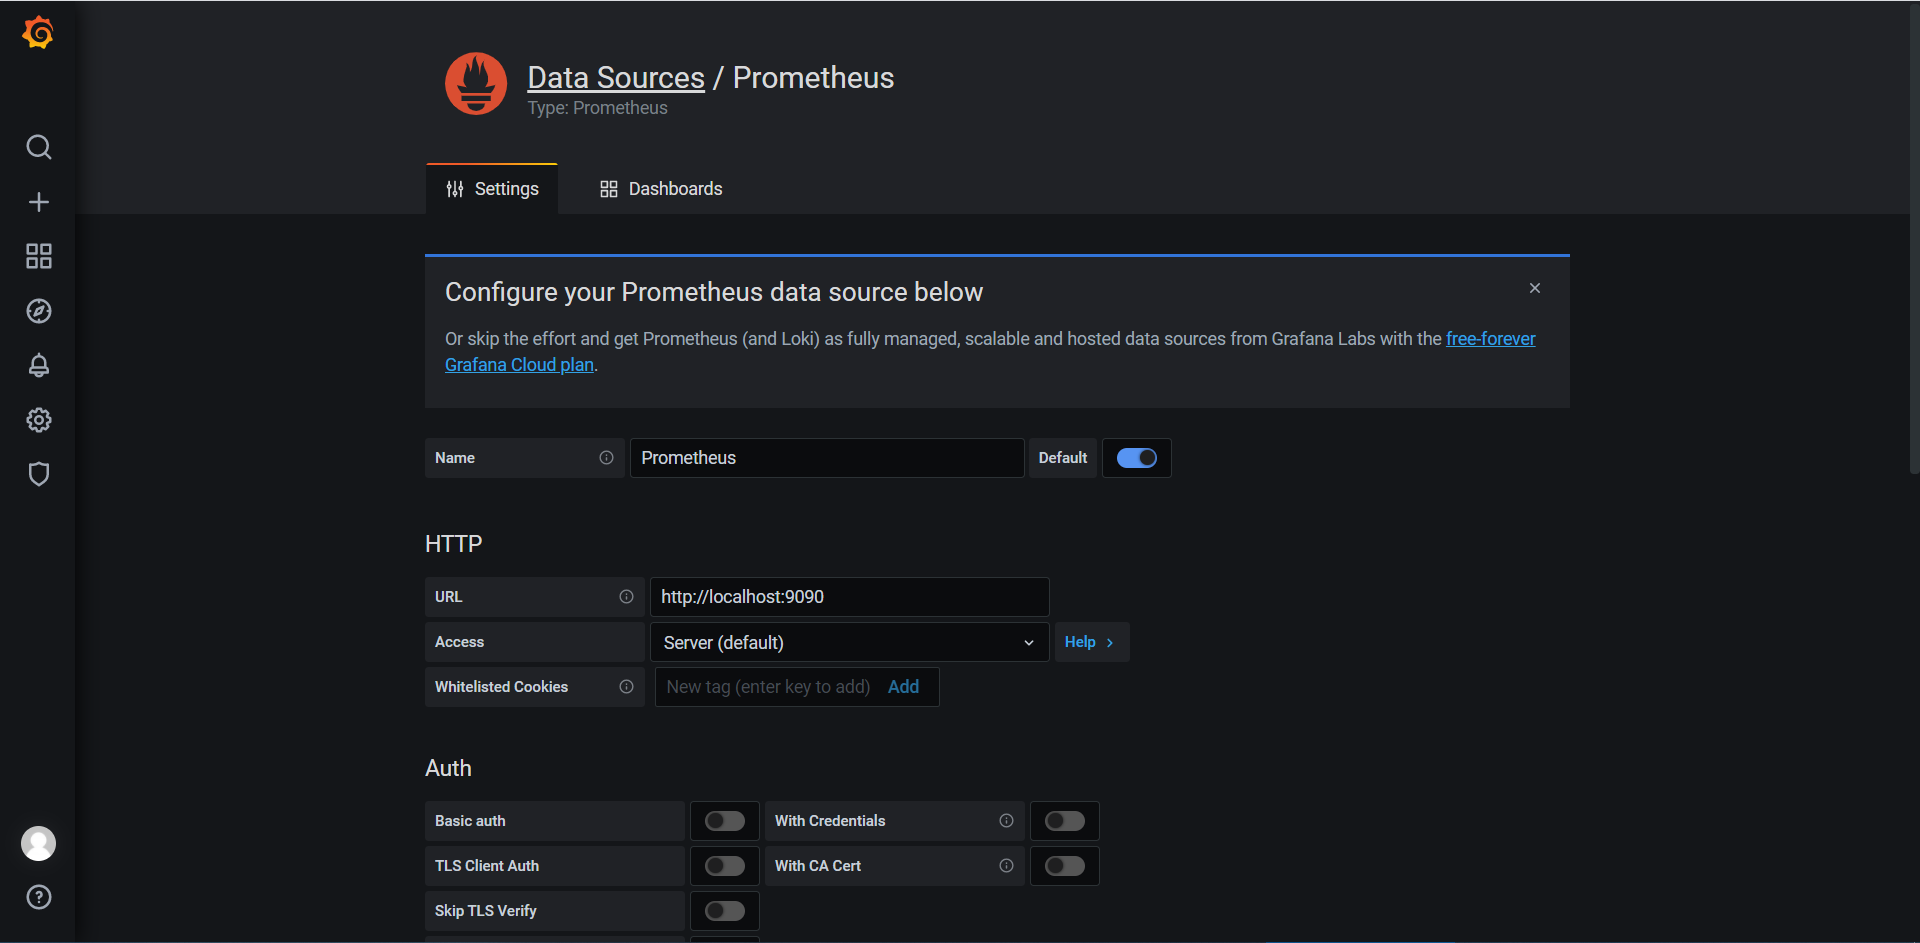
1、创建一个Prometheus数据源
要在Grafana中创建一个Prometheus数据来源,请执行以下操作:
(1)点击侧边栏中的"齿轮"打开配置菜单。
(2)点击"Data Sources"数据源。
(3)点击"Add data source"添加数据源。
(4)选择"Prometheus"类型。
(5)设置适当的Prometheus Server URL(例如,http://localhost:9090/)
(6)根据需要调整其他数据源设置。
(7)然后点击"Save & Test"保存资源配置。
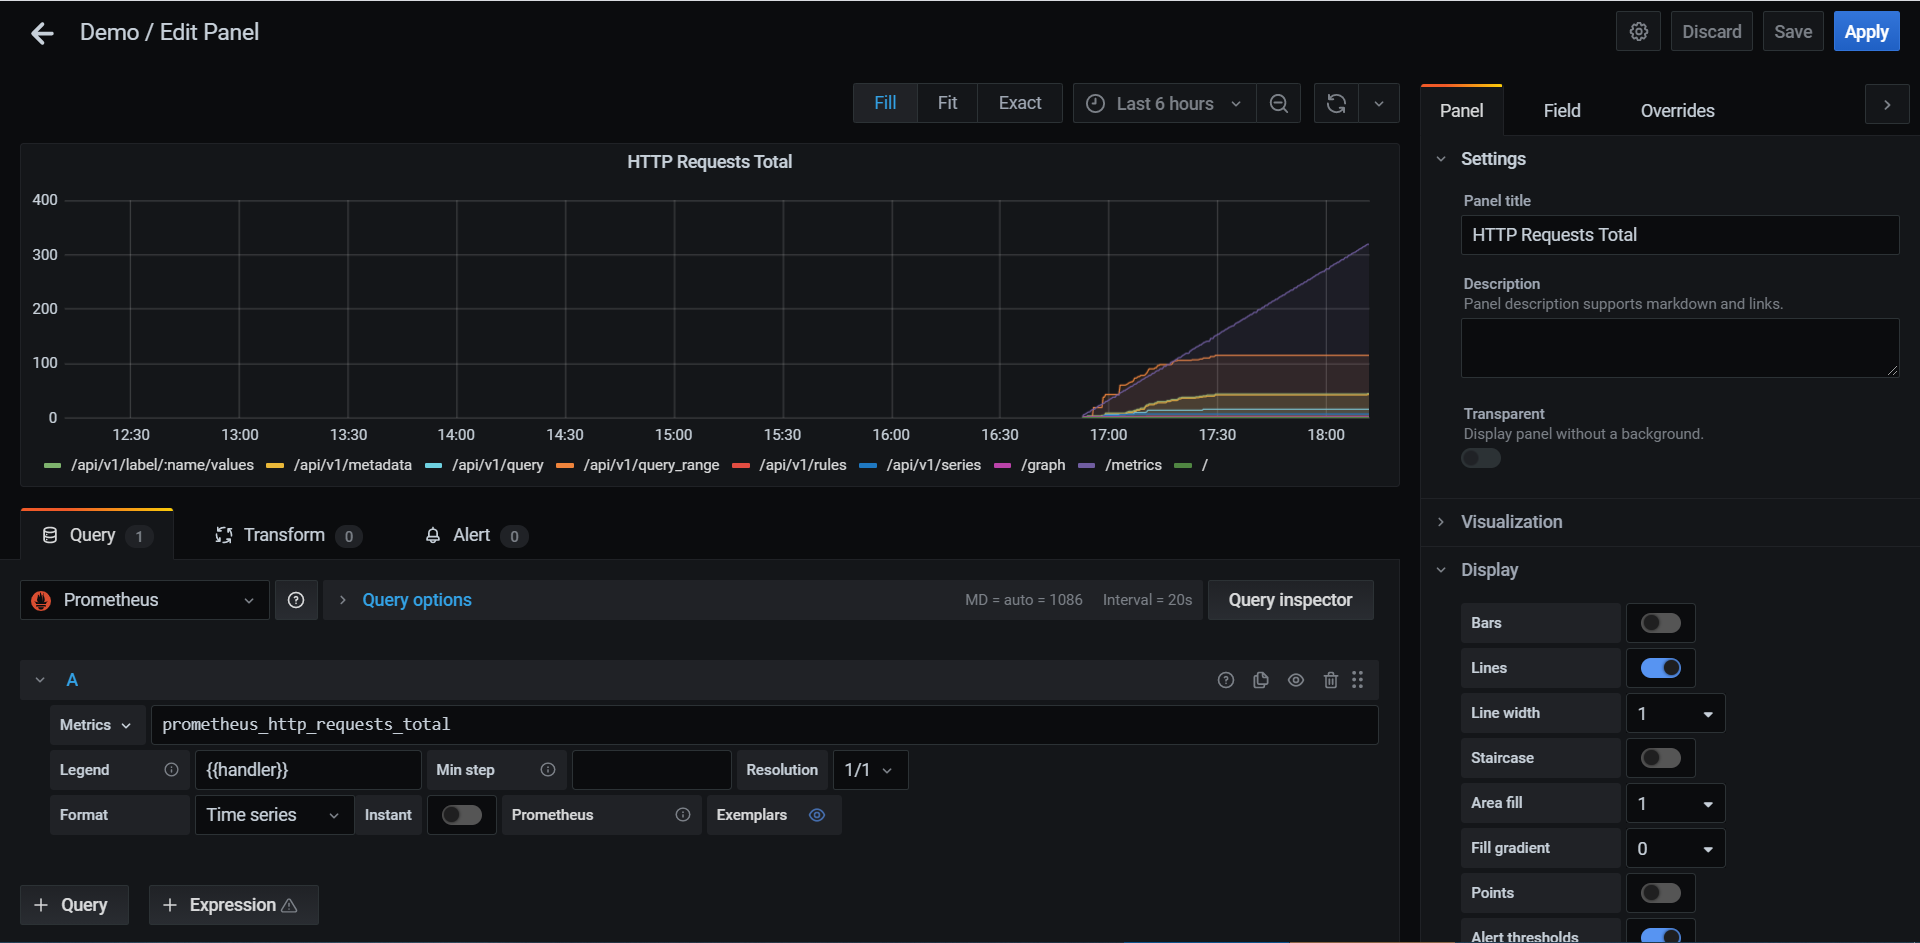
2、创建一个Prometheus图形
按照标准方法添加一个Grafana graph。如下:
(1)点击侧边栏中的"+Dashboard"新建一个仪表盘。
(2)选择数据源为"Prometheus",在左下角"Query"字段下。
(3)在"Query"字段下的"Metric"旁输入要使用的查询表达式,可以点击"Metric"选择并自动补全指标名称。
(4)要格式化时间序列的图例名称,请输入"Legend name"。例如,仅显示返回查询结果的方法"method"和状态"status"标签,则可以使用破折号间隔,可以使用图例格式字符串"{{method}} - {{status}}"。
(5)右侧"Visualization"可以选择图形,直到选择一个可用的图形即可。
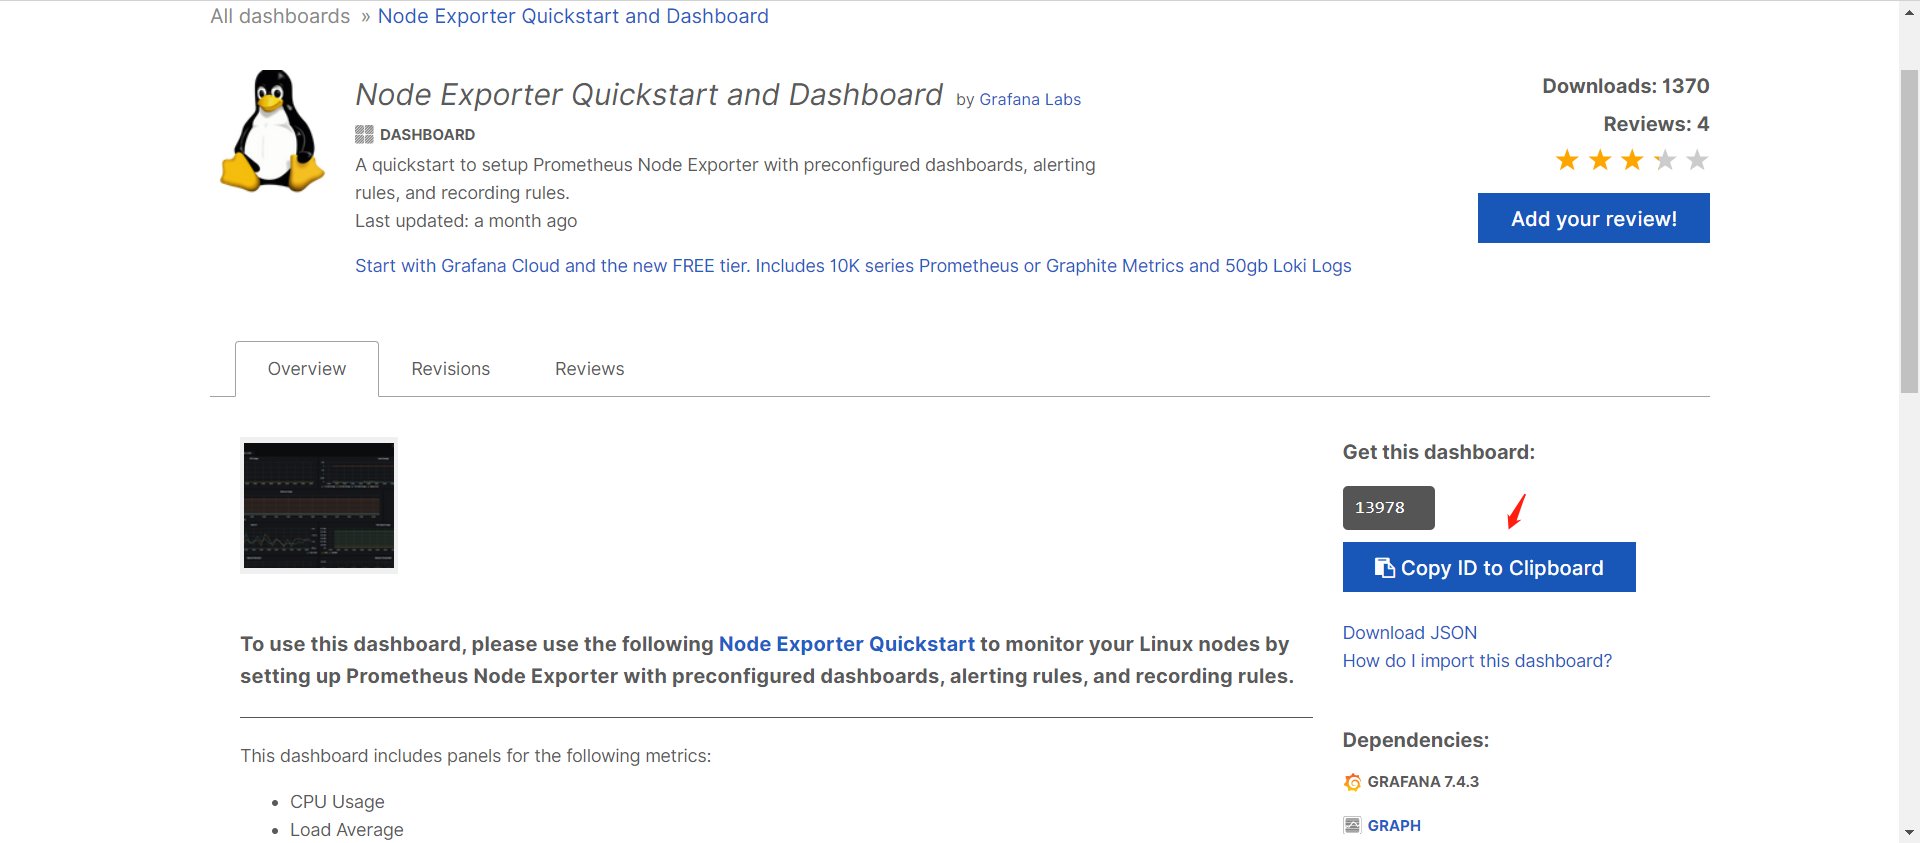
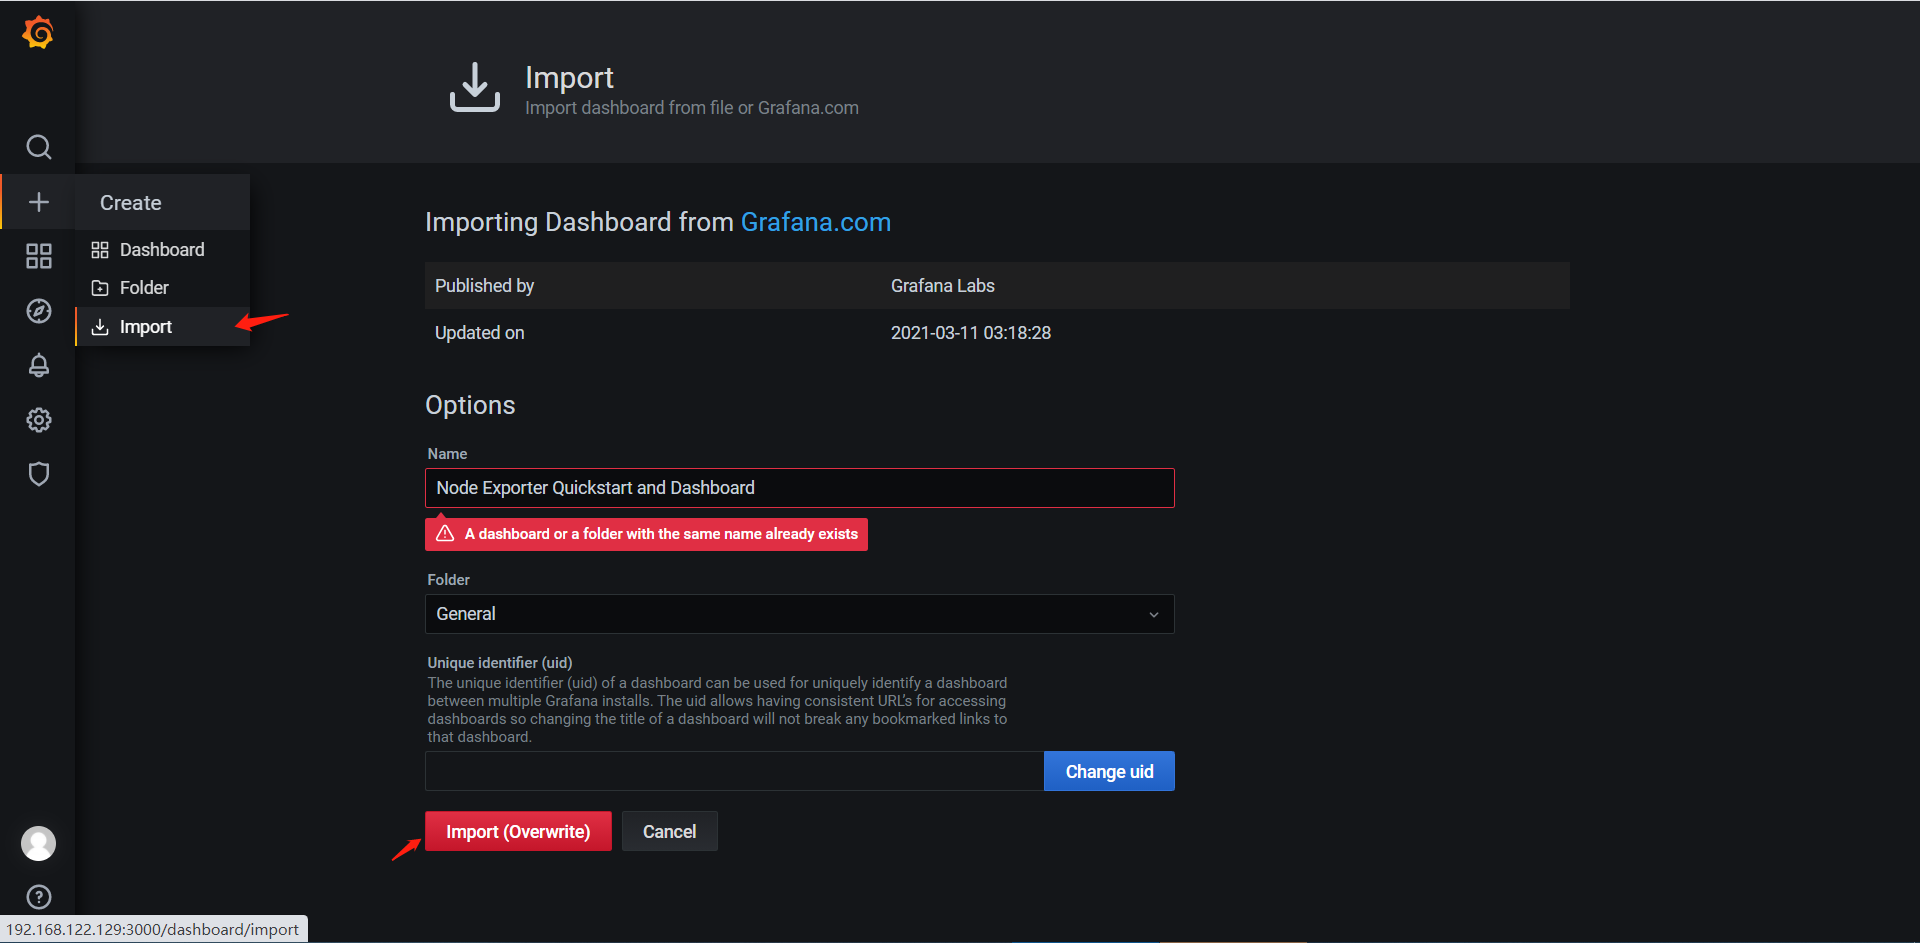
3、导入预构建的仪表盘
Grafana提供预构建的仪表盘,由Grafana官方内置或第三方社区提供,可以直接复制编号将
预构建的仪表盘导入到Grafana。
访问地址:https://grafana.com/grafana/dashboards
六、配置警报,发送报警通知到钉钉
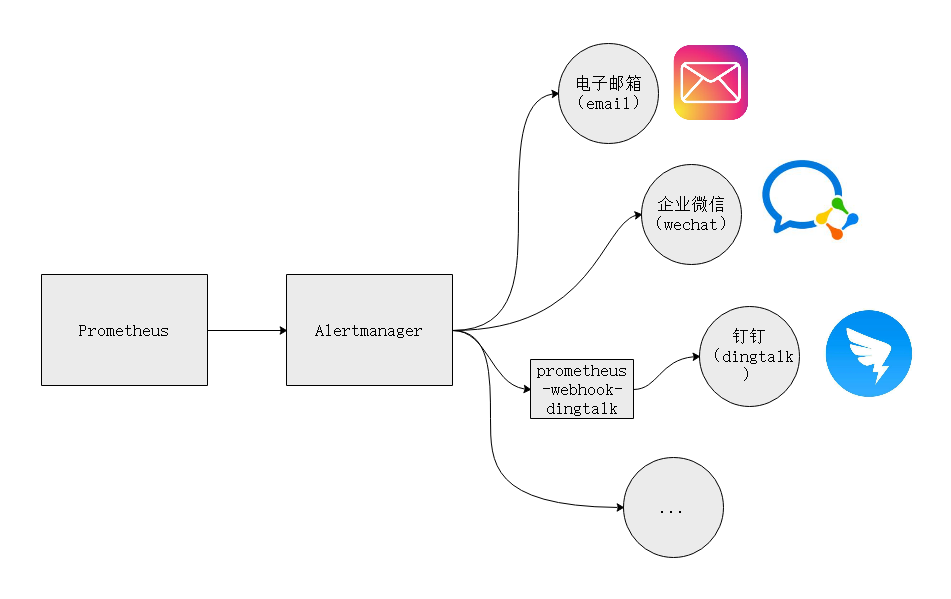
警报的触发是在Prometheus中配置警报规则(Alert Rules)决定的,当触发警报时,会将警报发送到警报管理器(Alermanager)中,然后由Alertmanger将警报发送到电子邮箱、钉钉、企业微信等位置实现报警通知。
Alermanager具有抑制、沉默、分组警报的功能。
- 分组(group_by),分组将性质相似的警报分类并聚合为单个通知(配置路由时,允许根据警报的标签分组警报)。
- 抑制(inhibit_rule),当某个问题警报产生并已发送,由该问题引起的一系列的其他警报允许被抑制(由配置抑制规则控制)。
- 沉默(silebces),忽略某些警报(在Alertmanager的Web控制台进行操作)。
钉钉
创建钉钉机器人,配置安全设置,获取机器人URL。
在钉钉群创建一个钉钉机器人即可。
使用加签的安全验证消息方式,接受通知消息。

prometheus-webhook-dingtalk
prometheus-webhook-dingtalk是一个专用于Alertmanager通过Webhook发送警报通知到钉钉机器人的小程序,在Github开源。如果你熟悉Python也可以自己编写一个推送程序。
地址:https://github.com/timonwong/prometheus-webhook-dingtalk
1、安装依赖Nodejs
[root@localhost ~]# mkdir /usr/local/nodejs

[root@localhost ~]# cd /usr/local/nodejs

[root@localhost nodejs]# wget https://nodejs.org/dist/v16.0.0/node-v16.0.0-linux-x64.tar.xz

[root@localhost nodejs]# tar xf node-v16.0.0-linux-x64.tar.xz

[root@localhost nodejs]# vim /etc/profile

# nodejs

export PATH=/usr/local/nodejs/node-v16.0.0-linux-x64/bin:$PATH

[root@localhost nodejs]# source /etc/profile

[root@localhost nodejs]# node -v

v16.0.0
2、安装依赖Yarn
[root@localhost nodejs]# npm install -g yarn
3、安装依赖Go
[root@localhost nodejs]# yum -y install golang
4、下载解压并编译包
[root@localhost nodejs]# cd /usr/local/prometheus/

[root@localhost nodejs]# rz

[root@localhost prometheus]# unzip prometheus-webhook-dingtalk-master.zip

[root@localhost prometheus]# cd prometheus-webhook-dingtalk-master

[root@localhost prometheus-webhook-dingtalk-master]# make build
5、编写自定义通知模板
该模板基于Go语言,是已经定义好的,通用的,直接引用即可。
注:如果想要学习如何编写模板,则可以学习Go Template。
[root@localhost prometheus-webhook-dingtalk-master]# vim contrib/templates/template.tmpl

{{ define "dingding.default.message" }}

{{/* 告警通知 */}}

{{- if gt (len .Alerts.Firing) 0 -}}

{{- range $index, $alert := .Alerts -}}

{{- if eq $index 0 -}}

====== 告警通知 ======

警报名称: {{ $alert.Labels.alertname }}

严重程度: {{ $alert.Labels.severity }}

{{- end }}

警报分组: {{ $alert.Labels.group }}

警报标题: {{ $alert.Annotations.summary }}

详细信息: {{ $alert.Annotations.description }}

故障时间: {{ dateInZone "2006.01.02 15:04:05" ($alert.StartsAt) "Asia/Shanghai" }}

{{ if gt (len $alert.Labels.instance) 0 -}}故障实例: {{ $alert.Labels.instance }}{{- end -}}

{{- end }}

{{- end }}

{{/* 恢复通知 */}}

{{- if gt (len .Alerts.Resolved) 0 -}}

{{- range $index, $alert := .Alerts -}}

{{- if eq $index 0 -}}

====== 恢复通知 ======

警报名称: {{ $alert.Labels.alertname }}

严重程度: {{ $alert.Labels.severity }}

{{- end }}

警报分组: {{ $alert.Labels.group }}

警报标题: {{ $alert.Annotations.summary }}

详细信息: {{ $alert.Annotations.description }}

故障时间: {{ dateInZone "2006.01.02 15:04:05" ($alert.StartsAt) "Asia/Shanghai" }}

恢复时间: {{ dateInZone "2006-01-02 15:04:05" ($alert.EndsAt) "Asia/Shanghai" }}

{{ if gt (len $alert.Labels.instance) 0 -}}故障实例: {{ $alert.Labels.instance }}{{- end -}}

{{- end }}

{{- end }}

{{- end }}
6、配置prometheus-webhook-dingtalk
[root@localhost prometheus-webhook-dingtalk-master]# cp config.example.yml config.yml

[root@localhost prometheus-webhook-dingtalk-master]# vim config.yml

## 请求超时时间

# timeout: 5s

## 不使用内置模板开关

#no_builtin_template: true

## 自定义模板路径

templates:

  - contrib/templates/template.tmpl

## 默认使用的消息模板

## 建议使用下方目标中配置的"message"

#default_message:

#  title: '{{ template "legacy.title" . }}'

#  text: '{{ template "legacy.content" . }}'

## 配置目标(钉钉机器人),以及配置机器人

## 钉钉机器人限制,每分钟不允许推送超过20条消息,所以我们可以配置多个"target"

targets:

  webhook: # 目标名称

    # 钉钉机器人URL

    url: https://oapi.dingtalk.com/robot/send?access_token=eaf8cb9e05094aedce70782a926fa4efcc001ce012612d47f7d0341cd3c16dd6

    # 安全设置:加签方式的密钥字符串

    secret: SECcd860c24697a1c06995eab8edee08f0542c9f68bcf778f07dba4291dd0337b74

    # 消息内容

    message:

      title: '{{ template "dingding.default.message" . }}' # 标题

      text: '{{ template "dingding.default.message" . }}' # 内容

    # @群组中指定手机号人(mobiles)或所有人(all)

    #mention:

      #all: true

      #mobiles: ['156xxxx8827', '189xxxx8325']
7、启动服务
[root@localhost prometheus-webhook-dingtalk-master]# nohup ./prometheus-webhook-dingtalk --web.listen-address="192.168.122.129:8060" --web.enable-ui --web.enable-lifecycle --config.file="config.yml" >./prometheus-webhook-dingtalk.log 2>&1 & echo $!>./prometheus-webhook-dingtalk.pid &

[root@localhost prometheus-webhook-dingtalk-master]# netstat -lnupt |grep 8060

tcp        0      0 192.168.122.129:8060    0.0.0.0:*               LISTEN      35583/./prometheus-
8、通过程序日志获取服务开放的API URL
[root@localhost prometheus-webhook-dingtalk-master]# tail -f prometheus-webhook-dingtalk.log

level=info ts=2021-04-27T08:00:01.779Z caller=main.go:117 component=configuration msg="Loading templates" templates=contrib/templates/legacy/template.tmpl

ts=2021-04-27T08:00:01.780Z caller=main.go:133 component=configuration msg="Webhook urls for prometheus alertmanager" urls=http://192.168.122.129:8060/dingtalk/webhook/send
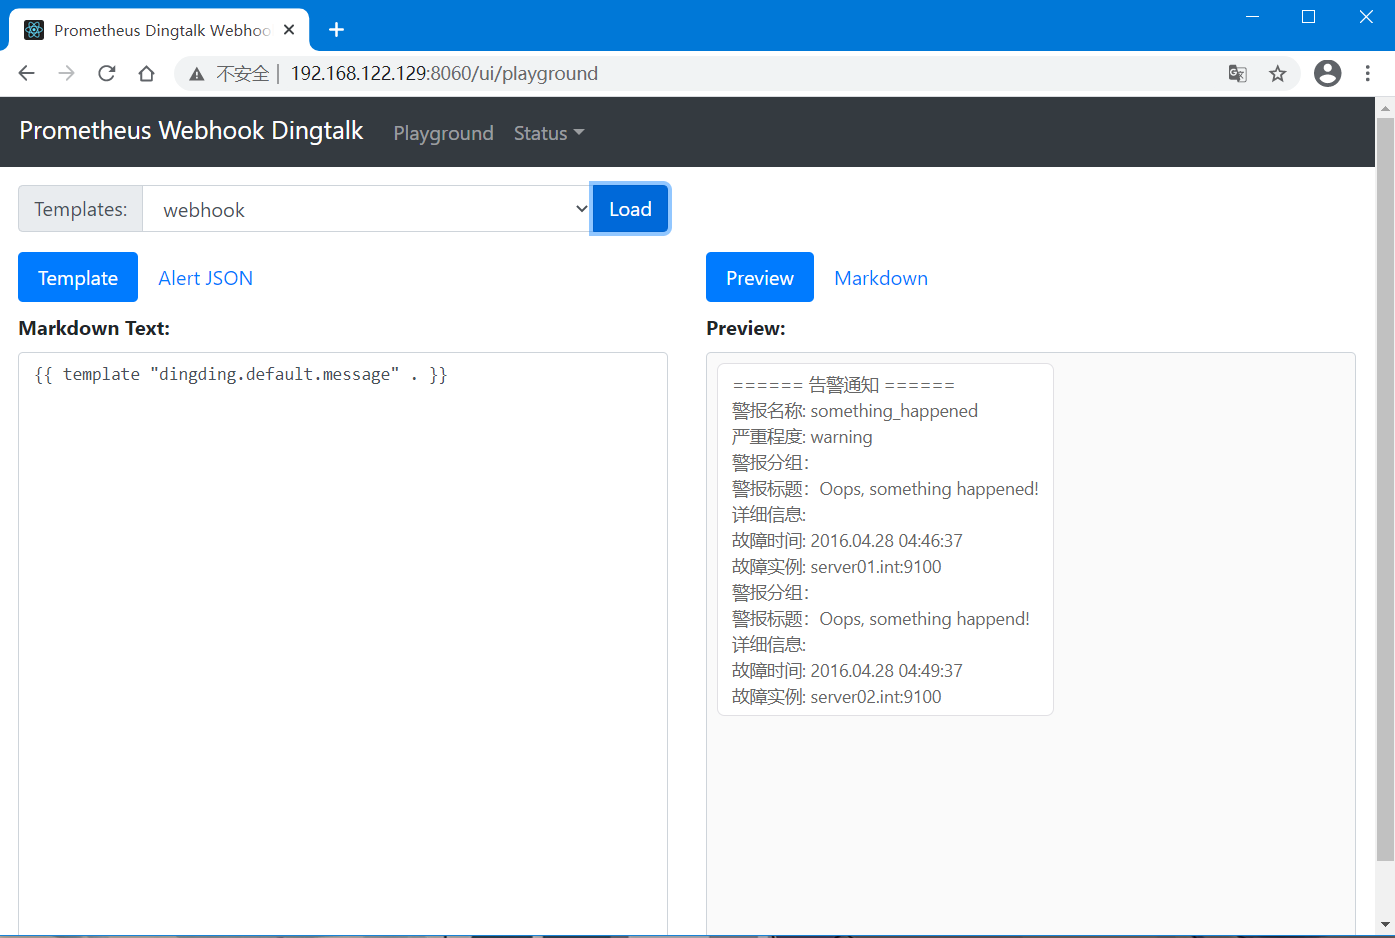
9、访问到WebUI
在浏览器中输入"主机地址:端口/ui/"即可访问到prometheus-webhook-dingtalk提供的一个WebUI控制台,可以在其中查看一些服务配置、状态信息等。
10、手动推送往接口推送个消息测试一下
[root@localhost ~]# curl 'http://192.168.122.129:8060/dingtalk/webhook/send' -H 'Content-Type: application/json' -d '{"msgtype": "text","text": {"content": "我就是我, 是不一样的烟火"}}'

OK
Alertmanger
1、安装Alertmanger
二进制包下载地址:https://prometheus.io/download/
解压包到指定目录即可!
[root@localhost ~]# cd /usr/local/prometheus/

[root@localhost prometheus]# tar xzvf alertmanager-0.21.0.linux-amd64
2、配置Alertmanager
配置Alertmanager,关联prometheus-webhook-dingtalk。
[root@localhost prometheus]# cd alertmanager-0.21.0.linux-amd64

[root@localhost alertmanager-0.21.0.linux-amd64]# vim alertmanager.yml

global:

  resolve_timeout: 5m

route:

  group_by: ['alertname']  # 根据标签分组警报

  group_wait: 10s  # 一组警报的等待时间

  group_interval: 10s  # 一组警报发送的时间间隔

  repeat_interval: 1m  # 重新发送警报的时间间隔,这边设置的间隔时间较小,便于测试

  receiver: 'dingding'  # 定义默认使用的通知消息接收器

receivers:

- name: 'dingding'

  webhook_configs:

    # prometheus-webhook-dingtalk提供的webhook1的API URL

  - url: 'http://192.168.122.129:8060/dingtalk/webhook/send'

    send_resolved: true # 允许发送恢复通知

# 抑制规则,具有相同标签,已经发送了severity='critical'的警报,则新产生severity='warning'的警报不会发送

inhibit_rules:

  - source_match:

      severity: 'critical'

    target_match:

      severity: 'warning'

    equal: ['alertname', 'dev', 'instance']
3、启动服务
[root@localhost alertmanager-0.21.0.linux-amd64]# nohup ./alertmanager --config.file="alertmanager.yml" --storage.path="data/" --web.listen-address="192.168.122.129:9093" --web.timeout=0 >./alertmanager.log 2>&1 & echo $!>./alertmanager.pid

[root@localhost alertmanager-0.21.0.linux-amd64]# netstat -lnupt |grep alert

tcp6       0      0 :::9093                 :::*                    LISTEN      32206/./alertmanage

tcp6       0      0 :::9094                 :::*                    LISTEN      32206/./alertmanage

udp6       0      0 :::9094                 :::*                                32206/./alertmanage
4、访问到WebUI
Alertmanager提供一个WebUI,可以在上面沉默警报,以及查看接收到的警报以及服务状态、配置信息等。

Prometheus
1、配置Prometheus
配置Prometheus关联到Alertmanager。
[root@localhost alertmanager-0.21.0.linux-amd64]# cd /usr/local/prometheus/prometheus-2.25.0.linux-amd64

[root@localhost prometheus-2.25.0.linux-amd64]# vim prometheus.yml

alerting:

  alertmanagers:

  - static_configs:

    - targets:

       - 192.168.122.129:9093  # 关联Alertmanger警报管理器

rule_files:

  - "alert_rules.yml"  # 指定警报规则配置文件
2、编写警报规则(alert_rules)
这边编写一个警报规则,用于测试,当检测到主机的有效内存小于4GB时,则触发警报。
[root@localhost prometheus-2.25.0.linux-amd64]# vim alert_rules.yml
groups:
- name: test
rules:
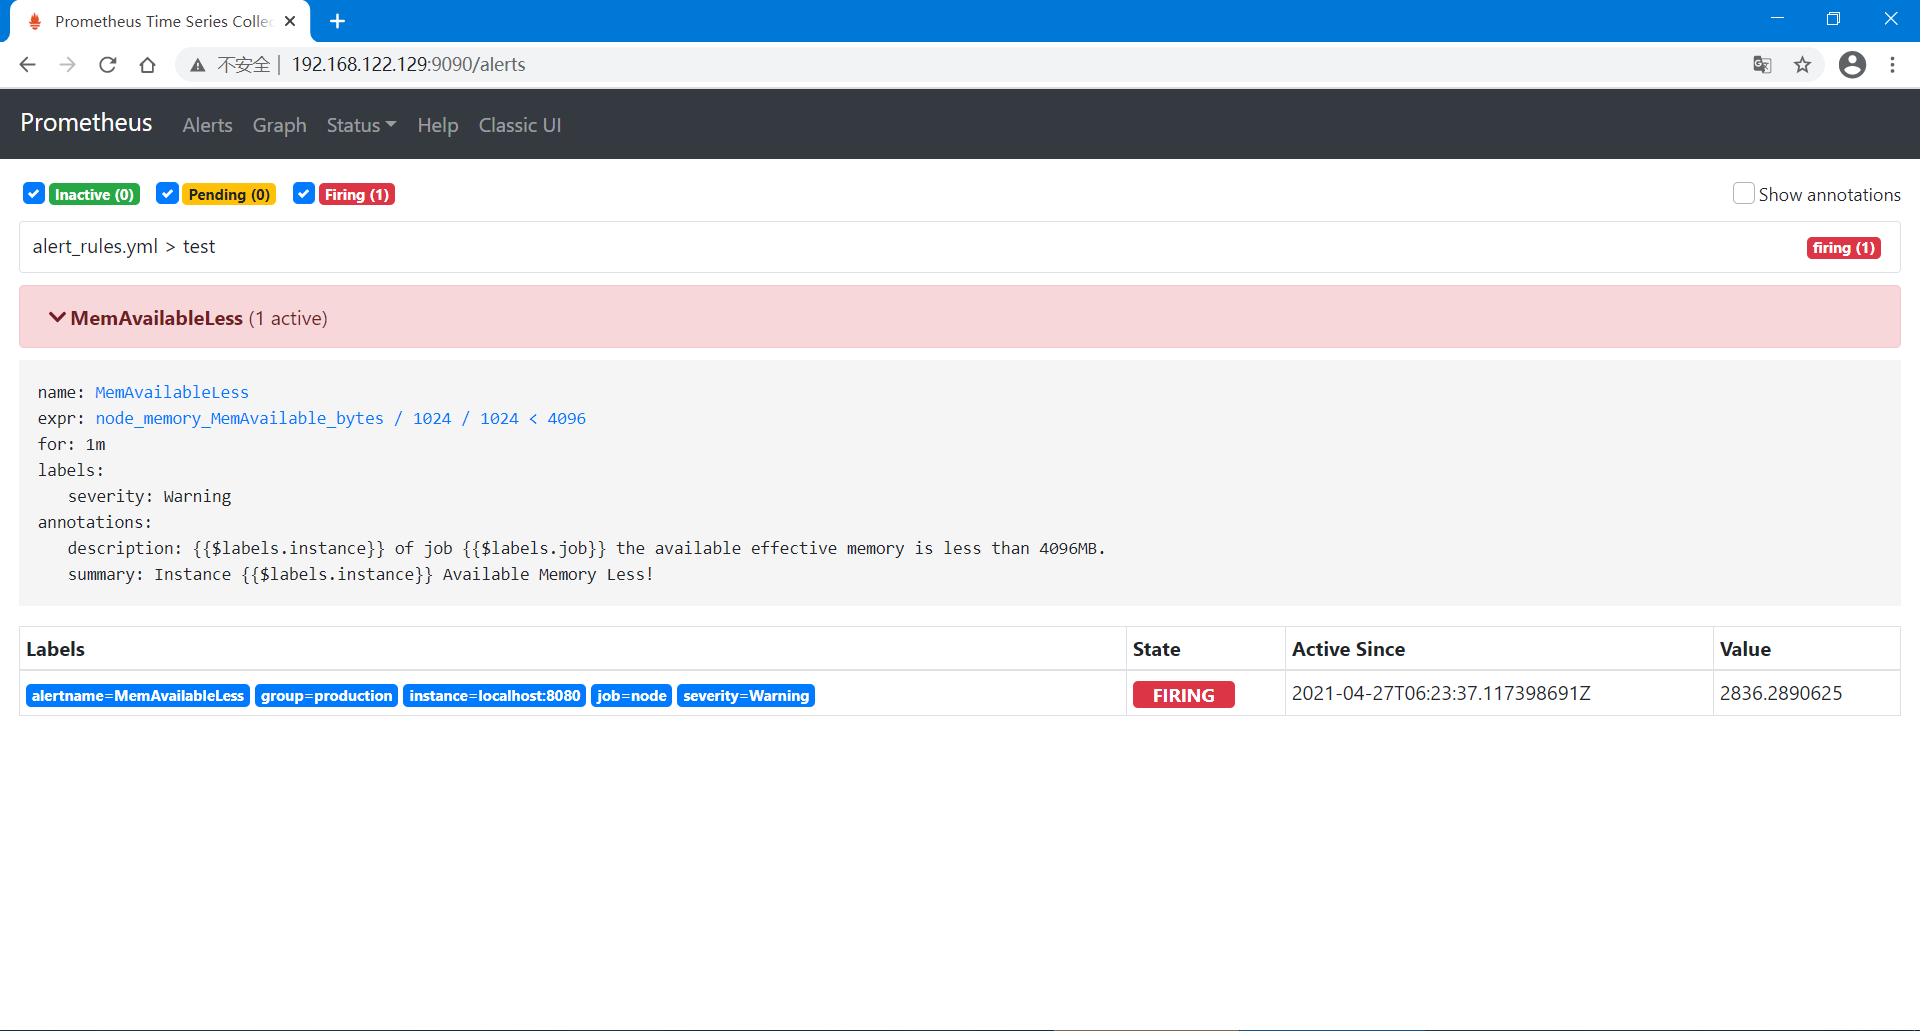
- alert: MemAvailableLess # 警报名称
expr: node_memory_MemAvailable_bytes / 1024 / 1024 < 4096 # 有效内存小于4096MB
for: 1m # 每1分钟检查一次
labels:
severity: Warning # 设置该警报的严重程度为"Warning"
annotations: # 警报注解信息
summary: "Instance {{$labels.instance}} Available Memory Less!"
description: "{{$labels.instance}} of job {{$labels.job}} the available effective memory is less than 4096MB."
3、重载配置
向Prometheus进程发送HUP信号以重新加载配置。
[root@localhost prometheus-2.25.0.linux-amd64]# netstat -lnupt |grep prometheus

tcp6       0      0 :::9090                 :::*                    LISTEN      30430/./prometheus

[root@localhost prometheus-2.25.0.linux-amd64]# kill -HUP 30430
4、可以在浏览器中查看已配置的警报
观察警报发送到钉钉情况
1、查看prometheus-webhook-dingtalk-master日志
我们可以通过日志看到警报已经发送到了钉钉群中,以及其发送过程中是否出现问题!
[root@localhost prometheus-webhook-dingtalk-master]# tail -f prometheus-webhook-dingtalk.log

level=info ts=2021-04-27T08:58:30.669Z caller=entry.go:22 component=web http_scheme=http http_proto=HTTP/1.1 http_method=POST remote_addr=192.168.122.129:35580 user_agent=Alertmanager/0.21.0 uri=http://192.168.122.129:8060/dingtalk/webhook/send resp_status=200 resp_bytes_length=2 resp_elapsed_ms=279.554657 msg="request complete"
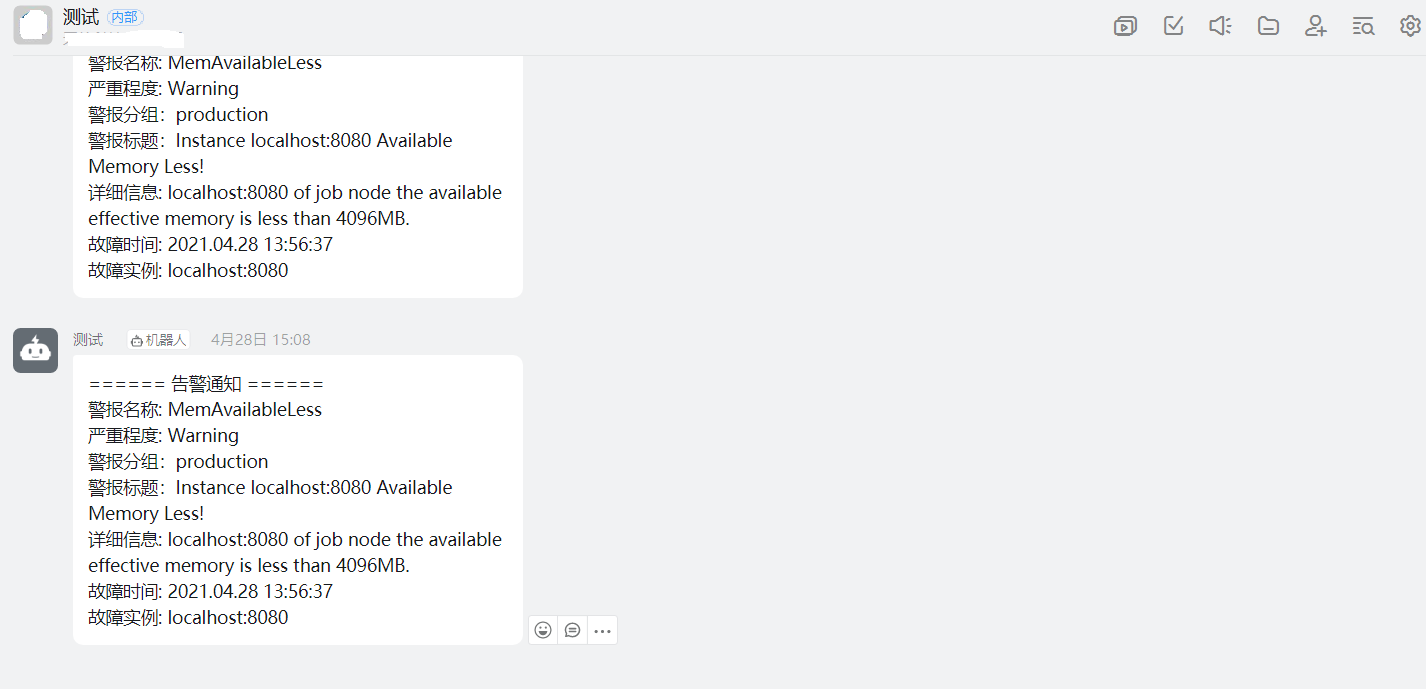
2、查看钉钉群
可以看到钉钉已经接收到了报警消息!
Prometheus普罗米修斯快速入门的更多相关文章
- Prometheus监控学习笔记之Prometheus普罗米修斯监控入门
0x00 概述 视频讲解通过链接网易云课堂·IT技术快速入门学院进入,更多关于Prometheus的文章. Prometheus是最近几年开始流行的一个新兴监控告警工具,特别是kubernetes的流 ...
- Prometheus 普罗米修斯监控
周末在家无聊 看新闻 看到关于监控的东西 拿来玩玩 试一下 感觉还蛮有意思 特此记录一下 这里只介绍客户端的配置 1:首先在POM中添加依赖 <dependency> <groupI ...
- 当ABAP遇见普罗米修斯
Jerry每次在工作场合中同Prometheus(普罗米修斯)打交道时,都会"出戏",因为这个单词给我的第一印象,并不是用go语言实现的微服务监控利器,而是名导雷德利·斯科特(Ri ...
- 一步步教你用Prometheus搭建实时监控系统系列(一)——上帝之火,普罗米修斯的崛起
上帝之火 本系列讲述的是开源实时监控告警解决方案Prometheus,这个单词很牛逼.每次我都能联想到带来上帝之火的希腊之神,普罗米修斯.而这个开源的logo也是火,个人挺喜欢这个logo的设计. 本 ...
- 普罗米修斯Prometheus监控安装
普罗米修斯Prometheus监控安装 架构: 服务端:192.168.0.204 客户端:192.168.0.206 环境准备:所有节点安装go 语言环境 rz go1.12.linux-amd64 ...
- 监控神器-普罗米修斯Prometheus的安装
搬砖党的福音:普罗米修斯-监控神器 功能: 在业务层用作埋点系统 Prometheus支持多种语言(Go,java,python,ruby官方提供客户端,其他语言有第三方开源客户端).我们可以通过客户 ...
- 普罗米修斯!Ubuntu下prometheus监控软件安装使用
*Prometheus* 是一个开源的服务监控系统和时间序列数据库 官方网站:prometheus.io 一.安装prometheus cd /usr/local/ #进入安装目录 wg ...
- (2012年旧文)纪念史蒂夫乔布斯---IT界的普罗米修斯
谈苹果与乔布斯系列一 IT界的普罗米修斯 纪念PC界的先驱 史蒂夫乔布斯 2012-4-5 清明节,纪念IT时代的开创人—伟大的史蒂夫 乔布斯. 没有乔布斯,计算机还是属于一群科技人士的工具,没有漂 ...
- 在Grafana使用普罗米修斯
aaarticlea/svg+xml;base64,PD94bWwgdmVyc2lvbj0iMS4wIiBlbmNvZGluZz0idXRmLTgiPz4KPCEtLSBHZW5lcmF0b3I6IE ...
随机推荐
- Web 开发中 Blob 与 FileAPI 使用简述
本文节选自 Awesome CheatSheet/DOM CheatSheet,主要是对 DOM 操作中常见的 Blob.File API 相关概念进行简要描述. Web 开发中 Blob 与 Fil ...
- 各种类型的Dialog
下面是几种对话框的效果 图一: 图二: 图三: 图四: 图五: 图六: 图七: 图1效果:该效果是当按返回按钮时弹出一个提示,来确保无误操作,采用常见的对话框样式. 代码: 创建对话框方法dialog ...
- EbitenCookBook中文教程 第一课:安装 Ebiten
本文实时更新原址:https://ebitencookbook.vercel.app/docs/CookBook_Start/class1 第一课 安装 Ebiten 欢迎大家来到 Ebiten 中文 ...
- [ Vim ] 自动重载文件
https://www.cnblogs.com/yeungchie/ 手动重载 :e 或者 :! 自动重载 set autoread 一般情况下,vim 切换缓冲区或者重新聚焦的时候会触发重载. 如果 ...
- Java核心知识1:泛型机制详解
1 理解泛型的本质 JDK 1.5开始引入Java泛型(generics)这个特性,该特性提供了编译时类型安全检测机制,允许程序员在编译时检测到非法的类型. 泛型的本质是参数化类型,即给类型指定一个参 ...
- 2021-01-25 cf #697 Div3 C题(超时,换思路减少复杂度)
题目链接:https://codeforces.com/contest/1475/problem/C 题意要求:需组成的2对,男的序号不能重,女的序号不能重 比如这例 输入: 行1--测试个数 行1` ...
- Dom基础(一):attribute和properrty的区别
properrty:修改对象属性不会体现到html结构中,针对DOM节点自带属性(id,className,style) attribute:修改html属性,会改变html结构,大多可以添加自定义属 ...
- ElasticSearch7.3学习(十九)---- deep paging
1.什么是deep paging 根据相关度评分倒排序,所以分页过深,协调节点会将大量数据聚合分析. 2.deep paging 性能问题 1消耗网络带宽,因为所搜过深的话,各 shard 要把数据传 ...
- 异步请求与中断 ( XHR,Axios,Fetch对比 )
随着AJAX技术的诞生,前端正式进入了局部刷新和前后端分离的新时代,最初的服务请求技术是XHR,随着技术发展和ES6的诞生,jquery ajax,axios,fetch 等技术的产生让前端的异步请求 ...
- 基于DSP_CPLD_aP8942A_LM1791的语音控制
语音驱动程序 drv_voice.c 语音服务程序 srv_voice.c 1.先运行初始化函数,主要是设置初始音量,并建立一个软件定时器来,以10ms的周期来调用语音播放函数. 1 void s ...