macOS 下 PHPStorm + Xdebug 调试 Docker 环境中的代码
0x00 描述
宿主机是 mac mini,构建的项目在 docker 中,所以需要在 PHPStorm 上配置 Xdebug 进行远程代码调试。
0x01 环境
宿主机:macOS High Sierra
Docker:Docker version -ce, build e68fc7a
容器环境:CentOS Linux release  (Core) + PHP  + nginx/ + Xdebug
PhpStorm:
0x03 下载安装 Xdebug
下载 Xdebug
首先要确定 Xdebug 的版本要和环境中的 PHP 版本相对应。
进入 docker 环境,打印 phpinfo() 的输出页面,或者在命令行输入
php -r "phpinfo();"
得到的结果,全选,复制,把结果粘贴到 https://xdebug.org/wizard.php 的文本框中,查看对应的 Xdebug 版本。
安装Xdebug
把得到的 Xdebug 版本下载到 docker 环境中,按照 https://xdebug.org/wizard.php 的说明进行安装:
Download xdebug-.tgz
Unpack the downloaded file with tar -xvzf xdebug-.tgz
Run: cd xdebug-
Run: phpize (See the FAQ if you don't have phpize.

As part of its output it should show:

Configuring for:
...
Zend Module Api No:
Zend Extension Api No:
If it does not, you are using the wrong phpize. Please follow this FAQ entry and skip the next step.

Run: ./configure
Run: make
Run: cp modules/xdebug.so /usr/lib64/php/modules
Update /etc/php.ini and change the line
zend_extension = /usr/lib64/php/modules/xdebug.so
0x04 配置 PHP 与 Xdebug
在 docker 中,根据 phpinfo 的 php.ini 路径,打开 php.ini,加入(编辑)以下代码:
[xdebug]
zend_extension=/usr/lib64/php/modules/xdebug.so
xdebug.remote_enable=
xdebug.remote_handler=dbgp
xdebug.remote_mode=req
xdebug.remote_host=10.203.17.92
xdebug.remote_port=
xdebug.idekey=PHPSTORM
xdebug.auto_trace=
xdebug.auto_exception_trace=
xdebug.remote_autostart=
xdebug.collect_vars=
xdebug.collect_return=
xdebug.collect_params=
xdebug.show_local_vars=
xdebug.profiler_enable=
xdebug.trace_enable_trigger=
xdebug.remote_log="/var/log/php.xdebug.log"
有几个地方要注意一下:
1. xdebug.remote_host
这是宿主机的 ip,在 docker 外(mac 环境中),输入命令:
ifconfig
找到 en0 中的 inet:
en0: flags=<UP,BROADCAST,SMART,RUNNING,SIMPLEX,MULTICAST> mtu
    options=10b<RXCSUM,TXCSUM,VLAN_HWTAGGING,AV>
    ether :fe:f7:0a::ff
    inet6 fe80::4f0:bb3b:4a49:d7f9%en0 prefixlen  secured scopeid 0x5
    inet 10.203.17.92 netmask 0xffffff00 broadcast 10.203.17.255
    nd6 options=<PERFORMNUD,DAD>
    media: autoselect (100baseTX <full-duplex>)
    status: active
xdebug.remote_host 就是上面例子中的 10.203.17.92
2. xdebug.remote_port
这里默认是 9000 端口,改一下避免和 php-fpm 的 9000 端口冲突
3. xdebug.remote_log
配置一下,方便排错
另外附上 /etc/php.d/xdebug.ini:
[xdebug]
; repeated defind at /etc/php.d/-xdebug.ini file
; zend_extension=/usr/lib64/php/modules/xdebug.so
xdebug.remote_enable = on
xdebug.remote_host = 10.203.17.92
xdebug.remote_port =
xdebug.idekey = "PHPSTORM"
这里和 php.ini 保持一致。
0x05 配置 PHPStorm
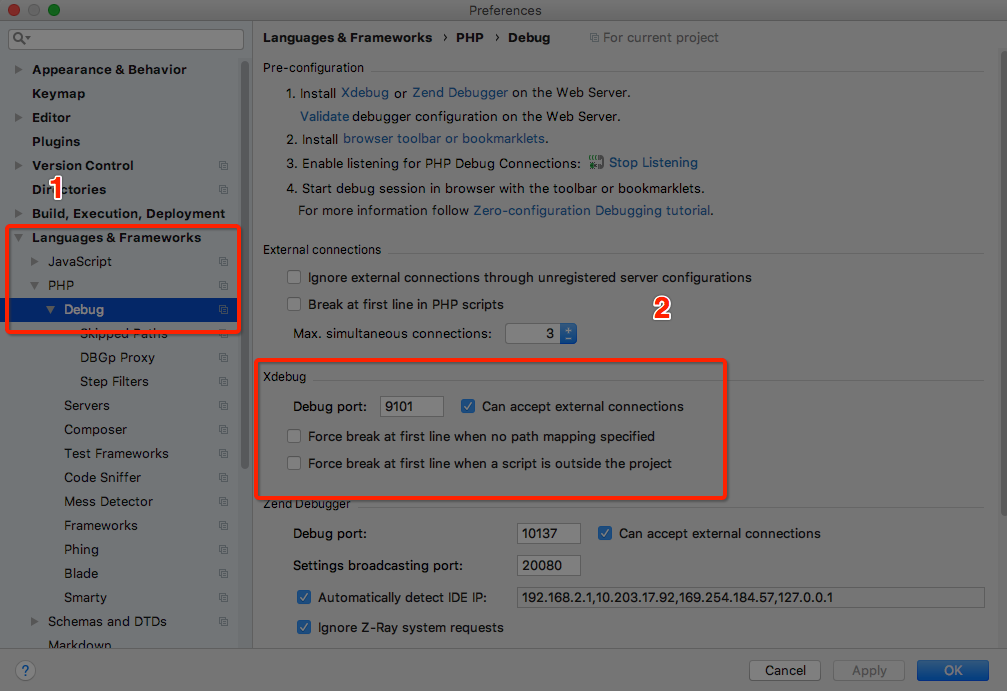
1. 进入 preferences

2. 进入 Languages & Frameworks - PHP -Debug ,找到 Xdebug,编辑监听端口和 php.ini 保持一致。
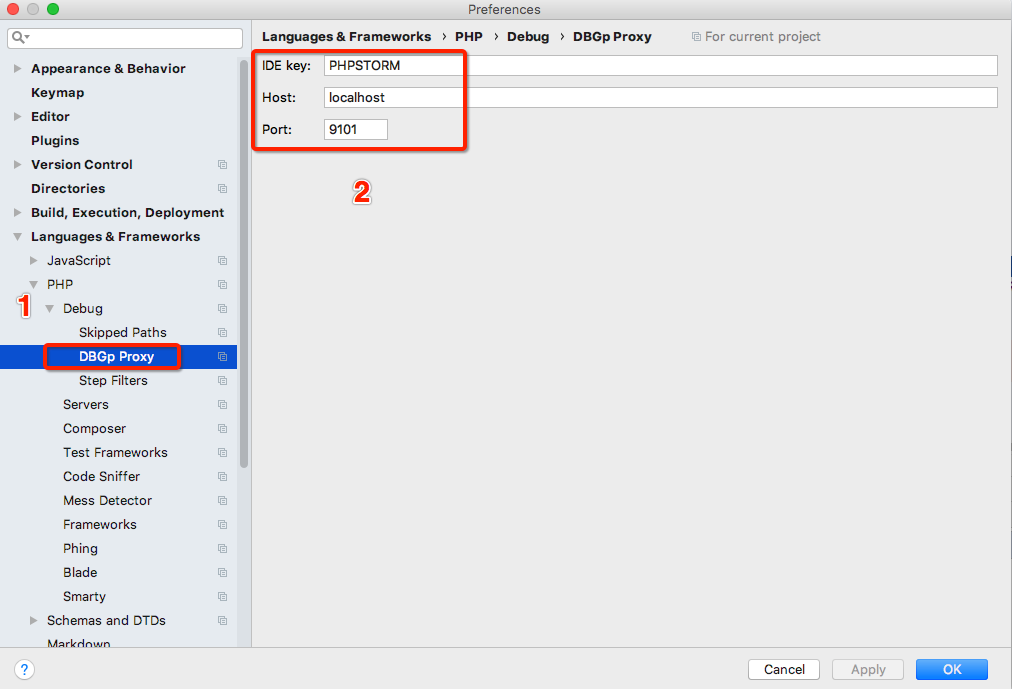
3. 进入 DBGp Proxy,端口和 php.ini 中配置保持一致,配置如下:
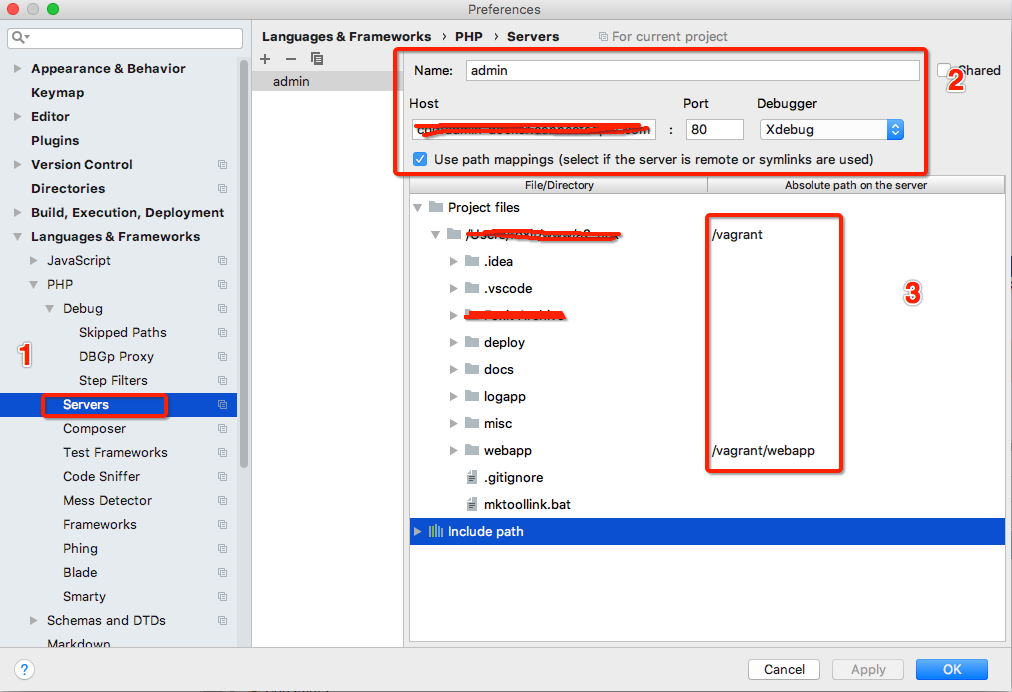
4. 进入 Servers,点 “+” 添加一个测试项目,例子中是 admin,Name 随便填写,Host 写项目的域名,端口 80,Debugger 选 Xdebug,勾选下面的路径映射,在右侧填写与本地项目对应的远程目录
5. 保存。
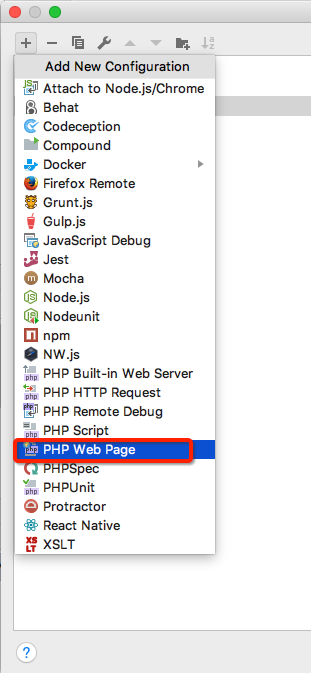
6. 编辑配置,选择 Edit Configurations
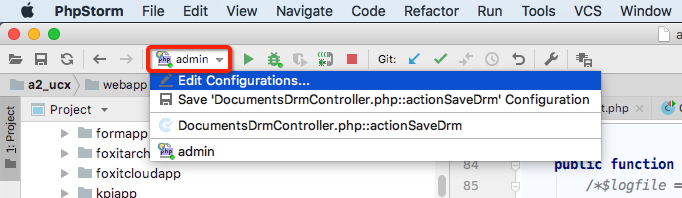
添加一个 PHP Web Page,有的版本是 PHP Web Application,是一样的:
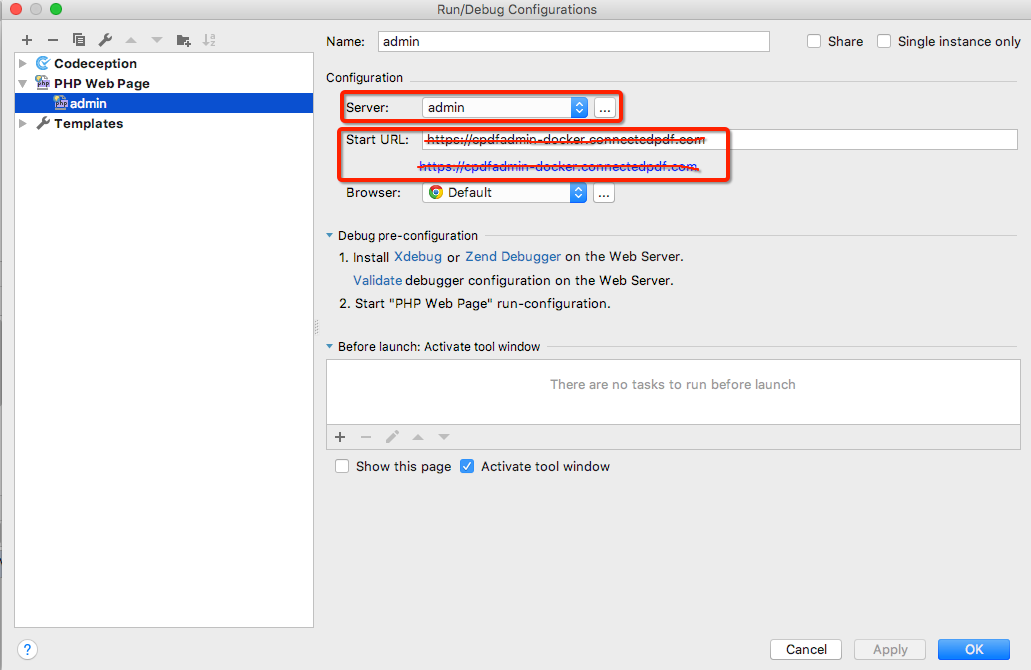
填写配置信息:
Server 选择上两步在 Servers 中添加的 Server,这里是 admin,另外 Start URL 选择项目的首页,即使是 https 的 URL,在上述配置端口的地方一样配置成 80:
7. 保存。
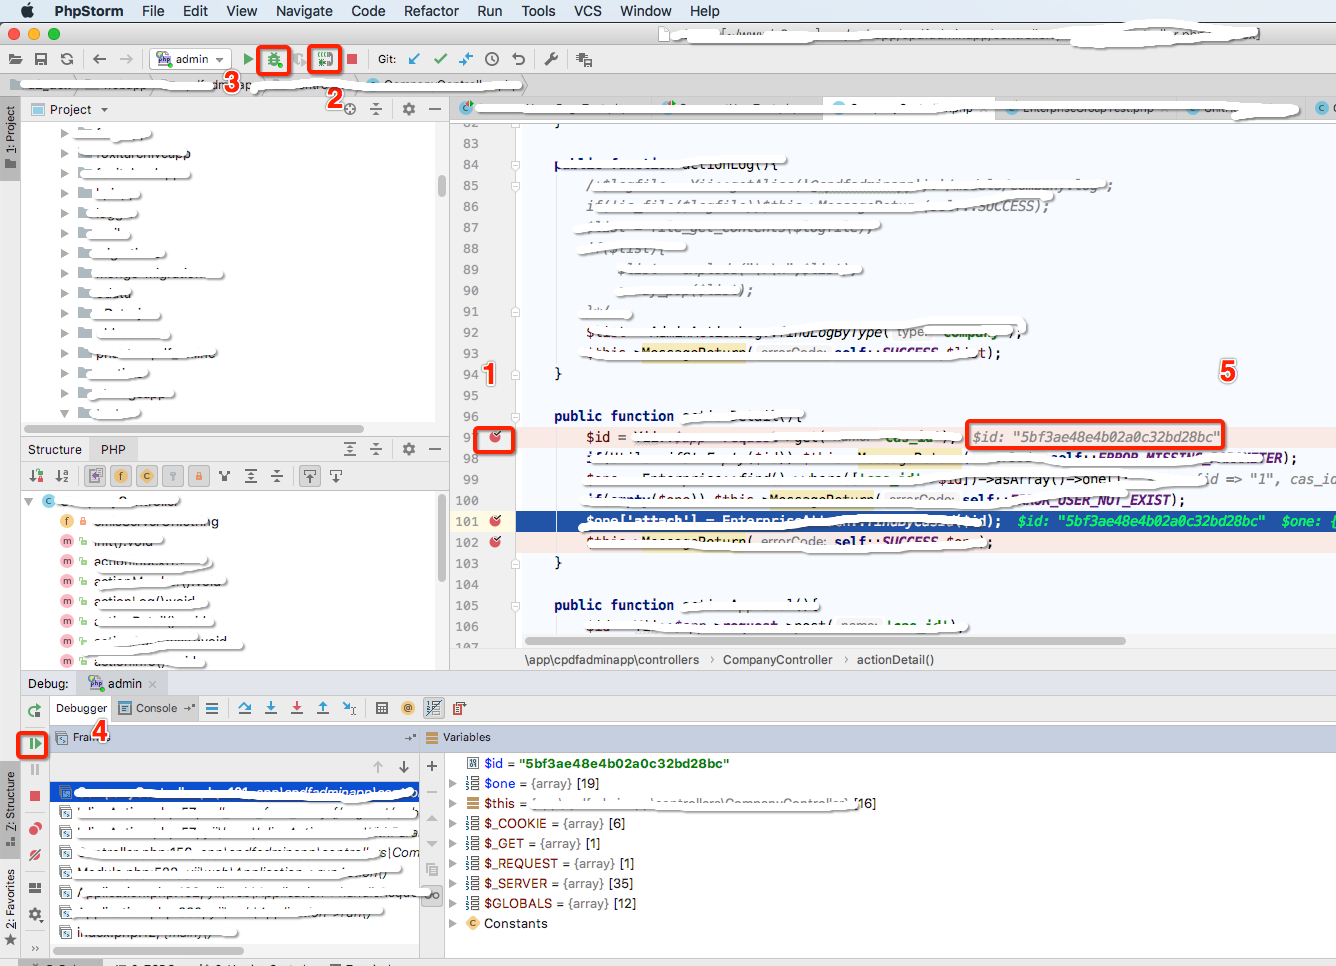
8. 调试:
在代码中设置断点(“1”处),打开“2” 处的电话图标,点击“3”处的 debug 选项,会自动跳到浏览器中之前设置的项目首页,当触发到断点时会自动跳到 PHPStorm 中,“4”处可以跳过断点,“5”处显示变量的值:
0x06 安装浏览器 Xdebug 插件
在 google 商店中找到并安装 Xdebug helper,安装之后可以在任意页面启动调试:

以下是 Xdebug helper 的设置页面:
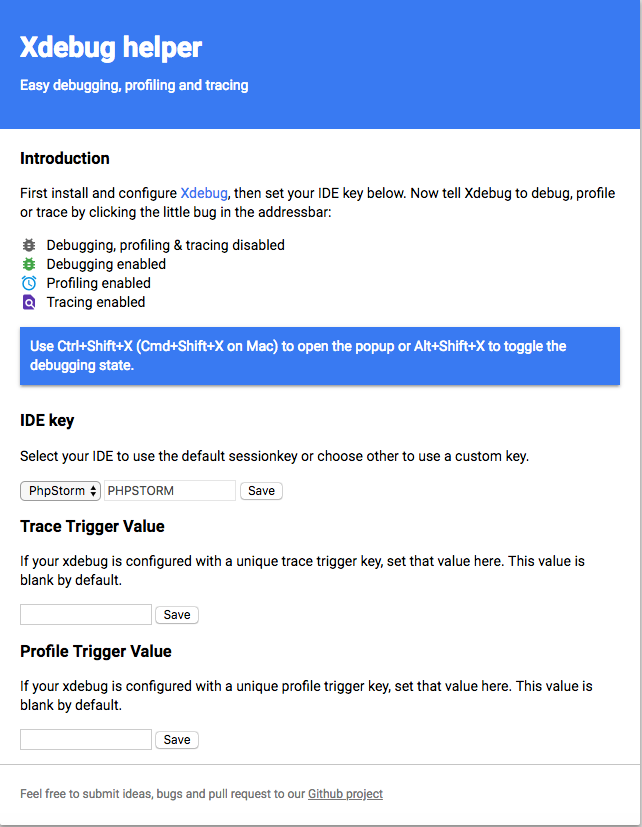
在一些 https 的项目中,PHPStorm -> Preference -> Languages & Frameworks -> PHP -> Servers 处的端口可以配置成 443,但是这个时候通过 PHPStorm 的 Debug 按钮从 Start Url 处开始无法调试,原因是 Xdebug 会把调试的地址认为是 http://xxxx.com:443 而不是 https://xxxx.com,此时就可以用浏览器的 Xdebug helper 插件来直接 debug,选择下拉菜单中的第一个 Debug 选项就可以开始 debug 了。
macOS 下 PHPStorm + Xdebug 调试 Docker 环境中的代码的更多相关文章
- PHPStorm + Xdebug 调试PHP代码 有大用
星期四, 12/26/2013 - 19:54 - shipingzhong PHPStorm + Xdebug 调试PHP代码 http://e.v-get.com/2013-11-20 16:55 ...
- Linux下用Xdebug调试php
Linux下用Xdebug调试php 博客分类: php PHPLinuxZendEclipseC# 为了调试PHP程序,安装一下xdebug. 官方网址: http://www.xdebug.org ...
- PHP - MAC下PhpStorm安装调试环境xdebug
今天下午一直在捣鼓如何用PhpStorm进行调试,查找了许多资料,零零碎碎的,所以自己弄篇文章记录一下步骤. 安装xdebug 使用brew安装xdebug,语法如下 brew install hom ...
- phpstorm+xdebug调试详细教程
对于PHP开发,初来咋到,开发环境的搭建和理解感觉是最烦人的一件事了.不像JAVA,打开一个Eclipse就可以开搞,Php的Debug都要几个插件来配合工作.这些都是死的,好说.但是对于Xdebug ...
- PHPStorm+XDEBUG 调试Laravel
首先输出phpinfo(); https://xdebug.org/wizard.php 打开然后查看适合你的调试扩展版本 ,目前支持到php7.2 整个页面ctrl+a 复制进去 然后下载 扩展文 ...
- centos7+nginx 1.9.0+php-fpm+phpstorm+xdebug+vmware开发环境搭建
1.php-fpm yum install php-fpm 默认配置在本地9000端口监听 service php-fpm restart启动 2.nginx 1.9.0 需先安装gcc zlib o ...
- PhpStorm+xdebug调试——更新
之前写过一篇<PhpStorm+xdebug+postman调试>,但是经过后来一段时间的使用,发现有些累赘.这里介绍一种比较简单方便的操作. 在上一篇文章中有一段“ 7.设置Server ...
- XAMPP + PhpStorm + Xdebug本地实验环境搭建
参考: 下载合适的XDebug 点击这里,选择合适xdebug XAMPP配置 php_xdebug-xxxx.dll 拷贝dll至 D:\XAMPP\php\ext php.ini 文末追加 [XD ...
- docker环境中neo4j导入导出
neo4j 官方文档有说明,使用 neo4j-admin restore / dump 导出和恢复数据库的时候需要停掉数据,否则会报数据库正在使用的错误:command failed: the dat ...
随机推荐
- 安装supset遇到的问题
1.缺少pyconfig.h文件问题(python3.4) 执行下列两行命令: $sudo apt-get install build-essential cmake $sudo apt-get in ...
- 理解Array.prototype.slice.call(arguments)
在很多时候经常看到Array.prototype.slice.call()方法,比如Array.prototype.slice.call(arguments),下面讲一下其原理: 1.基本讲解 1.在 ...
- 搭建vue脚手架---vue-cli
vue-cli作为一款mvvm框架语言(vue)的脚手架,集成了webpack环境及主要依赖,对于项目的搭建.打包.维护管理等都非常方便快捷.我们在开发项目时尤其需要这样一个快速构建项目的工具. 以下 ...
- 关于MVC框架中的Model的理解
一直以来对MVC结构中的Model层很不理解. 虽然Model层封装了一些方法,在查询和属性访问的时候提供了一些便利,但是实际使用中更多感受到的是Model层带来的限制,用起来十分别扭. 之前继承的一 ...
- BZOJ2167 : 公交车站
设$f[i]$表示$i$往上通过一趟公交车能到达的深度最小的祖先,这可以通过将公交车按$lca$深度从小到大排序后用并查集染色得到. 对于每个询问: $1.x==y$ $ans=0$. $2.x$是$ ...
- 游戏UI规范
在满足效果的前提下,尽量做到UI资源做到复用和最小化 1. 背景1和背景2分开切,可以组合成各种不同的面包背景图 2. 背景1和背景2在没有花纹的情况下,中间纯色的部分切4个像素做就公共个缩放就可 ...
- PAT Basic 1011
1011 A+B 和 C (15 分) 给定区间 [−231,231] 内的 3 个整数 A.B 和 C,请判断 A+B 是否大于 C. 输入格式: 输入第 1 行给出正整数 T (≤10 ...
- JavaWeb之 JSP:自定义标签的创建和使用
当jsp的内置标签和jstl标签库内的标签都满足不了需求,这时候就需要开发者自定义标签. 下面我们先来开发一个自定义标签,然后再说它的原理吧! 自定义标签的开发步骤 步骤一 编写一个普通的java类, ...
- 并查集---java模板
并查集,在一些有N个元素的集合应用问题中,我们通常是在开始时让每个元素构成一个单元素的集合,然后按一定顺序将属于同一组的元素所在的集合合并,其间要反复查找一个元素在哪个集合中.这一类问题近几年来反复出 ...
- jquery美刀的释放
jQuery 和其他 JavaScript 框架 正如您已经了解到的,jQuery 使用 $ 符号作为 jQuery 的简写. 如果其他 JavaScript 框架也使用 $ 符号作为简写怎么办? 其 ...