使用echarts画一个类似组织结构图的图表
昨天,写了一篇关于圆环进度条的博客(请移步:Vue/React圆环进度条),已经烦不胜烦,今天又遇到了需要展示类似公司的组织结构图的功能需求,要冒了!!!
这种需求,自己用div+css也是可以实现的,但是没有什么动画效果,我的css3又很差劲,而且项目中已经使用到了折线图、饼状图、柱状图之类的图表,用的还是百度的echarts,所以这个组织结构图之类的需求也就用了百度的echarts来实现了。
以前用echarts写折线图、柱状图、饼状图的较多,它的API还算比较熟悉,但是画组织结构这样的树状图就很苦逼了,没用过啊,而且设计给的树状图的展示效果跟echarts树状图的展示效果相去甚远,我滴孩,又得一通费时费力的研究,设计图如下:
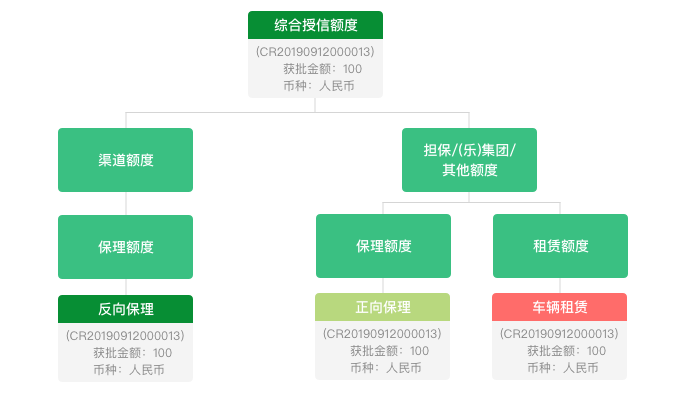
如图所示,一个树节点中可能会有两种不同的背景色,还有两种不同的文字颜色,每个节点展示的还是圆角矩形。有同学说了,echarts有设置圆角的API啊,直接设置不就完事了。我想说的是,它是提供的有这样的API,但是按照正常的套路实现不了啊。
从图上还可以看到一个几乎实现不了的效果,就是连接每个节点之间的线的拐角处都是直角而不是平滑的,而且echarts没有给出可以设置拐角处是直角的API,只是给了一个curveness(API的描述是树图边的曲度),这玩意儿使用了之后,也还是实现不了的。
从网上查了资料,有人说可以修改echarts的源码,这种解决办法我不推荐,是因为在vue或react项目中,echarts是需要通过安装在package.json中的,如果是多人并行开发,那么别人安装的echarts就不是你修改后的echarts,这就是问题所在。
最后用echarts画出来的效果还是很不错的,唯一没有实现的就是连接每个节点的线的拐角处不是直角,有好的解决办法的,还望不吝赐教,谢谢!展示一下最终的成果:
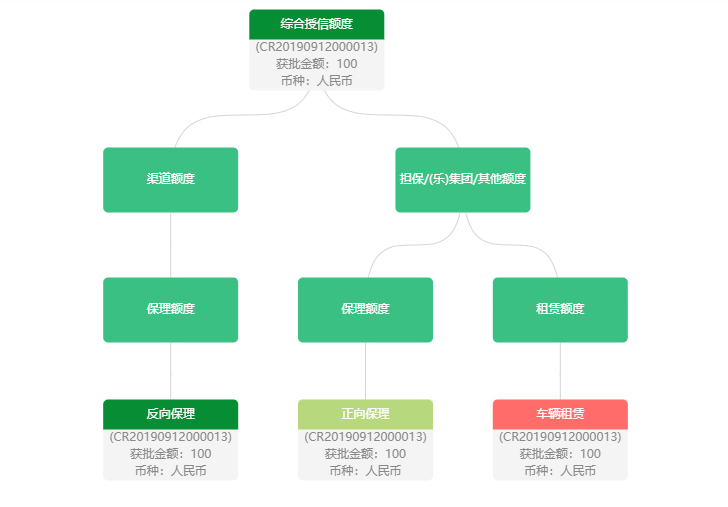
说了那么多,还是上代码吧,该代码是基于vue的,如果要使用在react中,稍微修改一下就可以了。
组件tree.vue:
<template>

  <div :class="className" :style="{height:height,width:width}" />

</template>

<script>

import echarts from "echarts";

require("echarts/theme/macarons");

import { debounce } from "@/utils";

export default {

  props: {

    className: {

      type: String,

      default: "chart"

    },

    width: {

      type: String,

      default: "100%"

    },

    height: {

      type: String,

      default: "500px"

    },

    chartData: {

      type: Object,

      required: true

    }

  },

  data() {

    return {

      chart: null,

    };

  },

  watch: {

    chartData: {

      deep: true,

      handler(val) {

        this.setOptions(val);

      }

    }

  },

  mounted() {

    this.initChart();

    //是否需要自适应-加了防抖函数

    this.__resizeHandler = debounce(() => {

      if (this.chart) {

        this.chart.resize();

      }

    }, 100);

    window.addEventListener("resize", this.__resizeHandler);

    // 监听侧边栏的变化以实现自适应缩放

    const sidebarElm = document.getElementsByClassName("sidebar-container")[0];

    sidebarElm.addEventListener("transitionend", this.sidebarResizeHandler);

  },

  beforeDestroy() {

    if (!this.chart) {

      return;

    }

    window.removeEventListener("resize", this.__resizeHandler);

    this.chart.dispose();

    this.chart = null;

    const sidebarElm = document.getElementsByClassName("sidebar-container")[0];

    sidebarElm.removeEventListener("transitionend", this.sidebarResizeHandler);

  },

  methods: {

    initChart() {

      this.chart = echarts.init(this.$el, "macarons");

      this.setOptions(this.chartData);

      const nodes = this.chart._chartsViews[0]._data._graphicEls;

      let allNode = 0;

      for(let index = 0; index < nodes.length; index++) {

        const node = nodes[index];

        if (node === undefined) {

          continue

        }

        allNode++;

      }

      const height = window.innerHeight;

      const width = window.innerWidth - 1000;

      const currentHeight = 85 * allNode;

      const currentWidth = 220 * allNode;

      const newHeight = Math.max(currentHeight, height);

      const newWidth = Math.max(currentWidth, width);

      const tree_ele = this.$el;

      // tree_ele.style.height = newHeight + 'px';  //设置高度自适应

      tree_ele.style.width = newWidth + 'px';   //设置宽度自适应

      this.chart.resize();

      this.chart.on('click', this.chartData.clickCallback);   //节点点击事件

    },

    setOptions(data) {

      this.chart.setOption({

        //提供数据视图、还原、下载的工具

        // toolbox: {

        //   show : true,

        //   feature : {

        //     mark : {show: true},

        //     dataView : {show: true, readOnly: false},

        //     restore : {show: true},

        //     saveAsImage : {show: true}

        //   }

        // },

        series: [

          {

            name: "统一授信视图",

            type: "tree",

            orient: "TB", //竖向或水平   TB代表竖向  LR代表水平

            top: '10%',

            initialTreeDepth: 10,  //树图初始展开的层级(深度)

            expandAndCollapse: false,   //点击节点时不收起子节点,default: true

            symbolSize: [135, 65],

            itemStyle: {

              color: 'transparent',

              borderWidth: 0,

            },

            lineStyle: {

              color: '#D5D5D5',

              width: 1,

              curveness: 1,

            },

            data: [data]

          }

        ]

      });

    },

    sidebarResizeHandler(e) {

      if (e.propertyName === "width") {

        this.__resizeHandler();

      }

    }

  }

};

</script>
使用tree.vue的方法:
<template>

    <tree :chartData="treeData" />

</template>

<script>

import tree from './tree';

export default {

  data() {

    return {

      treeData: {

        label: {

          backgroundColor: '#F4F4F4',

          borderRadius: [0, 0, 5, 5],

          formatter: [

            '{first|综合授信额度}',

            '{second|(CR20190912000013)\n获批金额:100\n币种:人民币}',

          ].join('\n'),

          rich: {

            first: {

              backgroundColor: '#078E34',

              color: '#fff',

              align: 'center',

              width: 135,

              height: 30,

              borderRadius: [5, 5, 0, 0],

            },

            second: {

              color: '#888',

              align: 'center',

              lineHeight: 17,

            },

          }

        },

        children: [

          {

            label: {

              formatter: [

                '{first|渠道额度}',

              ].join('\n'),

              rich: {

                first: {

                  backgroundColor: '#3AC082',

                  color: '#fff',

                  align: 'center',

                  width: 135,

                  height: 65,

                  borderRadius: 5,

                },

              }

            },

            children: [{

              label: {

                formatter: [

                  '{first|保理额度}',

                ].join('\n'),

                rich: {

                  first: {

                    backgroundColor: '#3AC082',

                    color: '#fff',

                    align: 'center',

                    width: 135,

                    height: 65,

                    borderRadius: 5,

                  },

                }

              },

              children: [{

                label: {

                  backgroundColor: '#F4F4F4',

                  borderRadius: [0, 0, 5, 5],

                  formatter: [

                    '{first|反向保理}',

                    '{second|(CR20190912000013)\n获批金额:100\n币种:人民币}',

                  ].join('\n'),

                  rich: {

                    first: {

                      backgroundColor: '#078E34',

                      color: '#fff',

                      align: 'center',

                      width: 135,

                      height: 30,

                      borderRadius: [5, 5, 0, 0],

                    },

                    second: {

                      color: '#888',

                      align: 'center',

                      lineHeight: 17,

                    },

                  }

                },

              }]

            }]

          },

          {

            label: {

              formatter: [

                '{first|担保/(乐)集团/其他额度}',

              ].join('\n'),

              rich: {

                first: {

                  backgroundColor: '#3AC082',

                  color: '#fff',

                  align: 'center',

                  width: 135,

                  height: 65,

                  borderRadius: 5,

                },

              }

            },

            children: [{

              label: {

                formatter: [

                  '{first|保理额度}',

                ].join('\n'),

                rich: {

                  first: {

                    backgroundColor: '#3AC082',

                    color: '#fff',

                    align: 'center',

                    width: 135,

                    height: 65,

                    borderRadius: 5,

                  },

                }

              },

              children: [{

                label: {

                  backgroundColor: '#F4F4F4',

                  borderRadius: [0, 0, 5, 5],

                  formatter: [

                    '{first|正向保理}',

                    '{second|(CR20190912000013)\n获批金额:100\n币种:人民币}',

                  ].join('\n'),

                  rich: {

                    first: {

                      backgroundColor: '#B8D87E',

                      color: '#fff',

                      align: 'center',

                      width: 135,

                      height: 30,

                      borderRadius: [5, 5, 0, 0],

                    },

                    second: {

                      color: '#888',

                      align: 'center',

                      lineHeight: 17,

                    },

                  }

                },

              }]

            },

            {

              label: {

                formatter: [

                  '{first|租赁额度}',

                ].join('\n'),

                rich: {

                  first: {

                    backgroundColor: '#3AC082',

                    color: '#fff',

                    align: 'center',

                    width: 135,

                    height: 65,

                    borderRadius: 5,

                  },

                }

              },

              children: [

                {

                  label: {

                    backgroundColor: '#F4F4F4',

                    borderRadius: [0, 0, 5, 5],

                    formatter: [

                      '{first|车辆租赁}',

                      '{second|(CR20190912000013)\n获批金额:100\n币种:人民币}',

                    ].join('\n'),

                    rich: {

                      first: {

                        backgroundColor: '#FF6C6A',

                        color: '#fff',

                        align: 'center',

                        width: 135,

                        height: 30,

                        borderRadius: [5, 5, 0, 0],

                      },

                      second: {

                        color: '#888',

                        align: 'center',

                        lineHeight: 17,

                      },

                    }

                  },

                },

              ]

            }]

          }

        ]

      }

    }

  },

  components: {

    tree,

  }

};

</script>
看着代码不多,但是实现起来,各种查echarts的API和网上的资料,而且,由于效果图中一个节点处的文字可能会换行,文字的颜色也不同,同时有些节点处的背景色还会有两种,以及每个节点处显示的样式和文字都是不固定的,所以我们可能还要面临着将接口返回的数据再改造处理成我们想要的数据的繁琐问题,就如同传递给树节点的treeData的格式一样,相当麻烦,如果每个节点的样式都是一样的,那就好办多了,如官网的一个树状图的例子:https://www.echartsjs.com/examples/zh/editor.html?c=tree-vertical
使用echarts画一个类似组织结构图的图表的更多相关文章
- vue+vuex+axios+echarts画一个动态更新的中国地图
一. 生成项目及安装插件 # 安装vue-cli npm install vue-cli -g # 初始化项目 vue init webpack china-map # 切到目录下 cd china- ...
- 【前端酷站】分享一个纯 Javascript 的图表库与立体像素风制作~
今天小编为大家推荐一个神奇的酷站.ECharts,一个纯 Javascript 的图表库. 以下是各个几个不错的界面的介绍: 首页:http://echarts.baidu.com/ 在首页有完整的说 ...
- Vue中使用ECharts画散点图加均值线与阴影区域
[本文出自天外归云的博客园] 需求 1. Vue中使用ECharts画散点图 2. 在图中加入加均值线 3. 在图中标注出阴影区域 实现 实现这个需求,要明确两点: 1. 知道如何在vue中使用ech ...
- echarts画中国地图并上色
任务是画一个中国地图,并在指定区域上颜色,学姐说用arcgis画,乖乖,4个g的安装文件,算了, 还是echarts大法好..如果想熟悉这个牛X的工具,请移步https://www.w3cschool ...
- vue中使用echarts画饼状图
echarts的中文文档地址:https://echarts.baidu.com/tutorial.html#5%20%E5%88%86%E9%92%9F%E4%B8%8A%E6%89%8B%20EC ...
- Spring Boot 2.x基础教程:使用 ECharts 绘制各种华丽的数据图表
上一节我们介绍了如何在Spring Boot中使用模板引擎Thymeleaf开发Web应用的基础.接下来,我们介绍一下后端开发经常会遇到的一个场景:可视化图表. 通常,这类需求在客户端应用中不太会用到 ...
- ECharts(Enterprise Charts 商业产品图表库)初识
一.简介 大数据时代,重新定义图表的时候到了,所以随之ECharts就随之出现了. ECharts(Enterprise Charts 商业产品图表库) 是基于Canvas的,纯Javascript ...
- ECharts学习(1)--简单图表的绘制
1.获取ECharts 官网 下载:http://echarts.baidu.com/download.html 2.在html页面中引入ECharts文件 <!DOCTYPE html> ...
- 自己画一个ActivityIndicatorView-b
苹果的UI控件中有一个UIActivityIndicatorView,俗称菊花.→_→现在我们仿照它来制作一个其它样式的指示器,如下: ActivityView.png 自定义指示器 首先画一个白色的 ...
随机推荐
- 杭电多校第九场 hdu6425 Rikka with Badminton 组合数学 思维
Rikka with Badminton Time Limit: 2000/1000 MS (Java/Others) Memory Limit: 524288/524288 K (Java/O ...
- Play on Words UVA - 10129
题目: Some of the secret doors contain a very interesting word puzzle. The team of archaeologists has ...
- dp递推 数字三角形,dp初学者概念总结
数字三角形(POJ1163) 在上面的数字三角形中寻找一条从顶部到底边的路径,使得路径上所经过的数字之和最大.路径上的每一步都只能往左下或 右下走.只需要求出这个最大和即可,不必给出 ...
- Fiddler 手机爬虫
Fiddler抓包工具 配置Fiddler 添加证书信任,Tools - Options - HTTPS,勾选 Decrypt Https Traffic 后弹出窗口,一路确认 ...from bro ...
- 修改,编译,GDB调试openjdk8源码(docker环境下)
在上一章<在docker上编译openjdk8>里,我们在docker容器内成功编译了openjdk8的源码,有没有读者朋友产生过这个念头:"能不能修改openjdk源码,构建一 ...
- 爬虫 之 requests
Requests 安装pip install requests 官方设计原则:让HTTP服务于人类 一.常用方法 import requests url = "http://www.http ...
- Mybatis系列(二)配置
Mybatis系列(二)配置 <?xml version="1.0" encoding="UTF-8"?> <!DOCTYPE configu ...
- 行内元素有哪些?块级元素有哪些?空(void)元素有哪些?
CSS规范规定,每个元素都有display属性,确定该元素的类型.每个元素都有默认的display值,如div的display默认值为“block”,则为“块级”元素:span默认display属性值 ...
- airflow使用本地时区
在airflow中使用的时间是utc时间,而更多时候我们希望的是使用本地时间,于是在定义airflow定时任务的时候,涉及到了时间的转换. 1.python中本地时间和utc时间的转换 查看国内可 ...
- JVM参数配置及详解 -Xms -Xmx -Xmn -Xss 调优总结
堆大小设置JVM 中最大堆大小有三方面限制:相关操作系统的数据模型(32-bt还是64-bit)限制;系统的可用虚拟内存限制;系统的可用物理内存限制.32位系统 下,一般限制在1.5G~2G;64为操 ...