(转)Arcgis for Js之Graphiclayer扩展详解
http://blog.csdn.net/gisshixisheng/article/details/41208185
在前两节,讲到了两种不同方式的聚类,一种是基于距离的,一种是基于区域范围的,两种不同的聚类都是通过扩展esri/layers/GraphicsLayer方法来实现的。在本节,就详细的讲讲esri/layers/GraphicsLayer方法的扩展。
首先,在讲解扩展之前,先看看API中esri/layers/GraphicsLayer的一些参数和方法等。
1、创建一个GraphicLayer
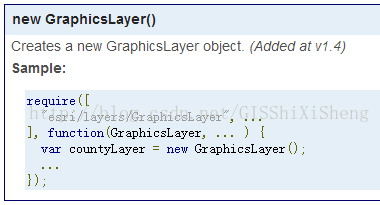
在ESRI官方的API中,创建GraphicLayer有两种方式:
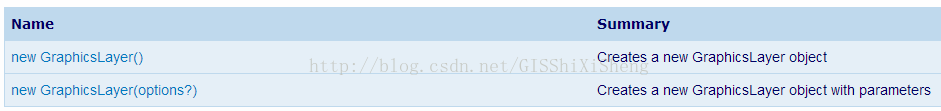
例如:
或者:
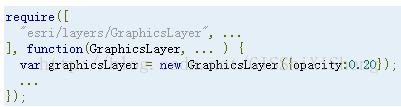
在第二种方式的options的参数包括:

2、GraphicLayer的属性
GraphicLayer的属性包括:

其中,有几个比较常见和重要的属性为:
a、graphics:数组,返回的参数是一个数组,为GraphicLayer中包含的Graphic对象。
b、visiable:布尔型,Graphiclayer是否可见。
c、visiableAtMapScale:布尔型,在特定比例尺下的可见性。
3、Graphiclayer的方法
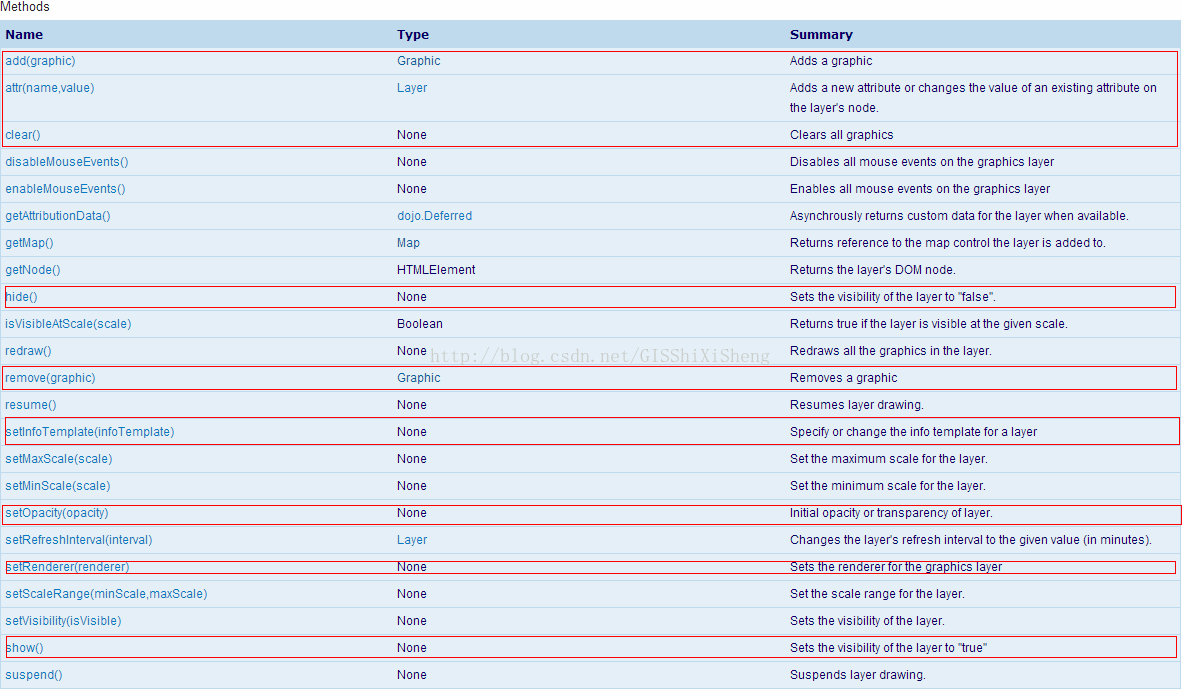
图中,红框标出的是Graphiclayer最常用的方法,详细的介绍很清楚,在此不再做赘述了。
接下来,扩展Graphiclayer。
GraphicLayer藏得很深,位于library\3.9\3.9\js\esri\layers\GraphicsLayer.js,虽然对参数变量代码做了混淆,但是有些东西还是没做变化。在做GraphicLayer扩展时,有几个是比较常用的:
a、_setMap
- // 重构esri/layers/GraphicsLayer方法
- _setMap: function(map, surface) {
- // GraphicsLayer will add its own listener here
- var div = this.inherited(arguments);
- return div;
- }
b、_unsetMap
- _unsetMap: function() {
- this.inherited(arguments);
- }
c、_draw
- _draw:function(graphic, redrawFlag, zoomFlag){
- if (!this._map) {
- return;
- }
- }
此外,还有一些地图控制的,如:_onPanStartHandler,_onZoomStartHandler,_onExtentChangeHandler等。扩展GraphicLayer的大概框架代码如下:
- define([
- "dojo/_base/declare",
- "esri/layers/GraphicsLayer"
- ], function (
- declare,
- GraphicsLayer
- ) {
- return declare([GraphicsLayer], {
- constructor: function(options) {
- //参数设置
- this._id = options.id || "";
- this._divId = options.chartDiv || "chart";
- },
- // 重构esri/layers/GraphicsLayer方法
- _setMap: function(map, surface) {
- // GraphicsLayer will add its own listener here
- var div = this.inherited(arguments);
- return div;
- },
- _unsetMap: function() {
- this.inherited(arguments);
- },
- //拖拽
- _onPanStartHandler: function() {
- //
- },
- //缩放
- _onZoomStartHandler:function(){
- //
- },
- _onExtentChangeHandler: function(delta, extent, levelChange, lod) {
- //
- },
- _draw:function(graphic){
- if (!this._map) {
- return;
- }
- //
- }
- });
- });
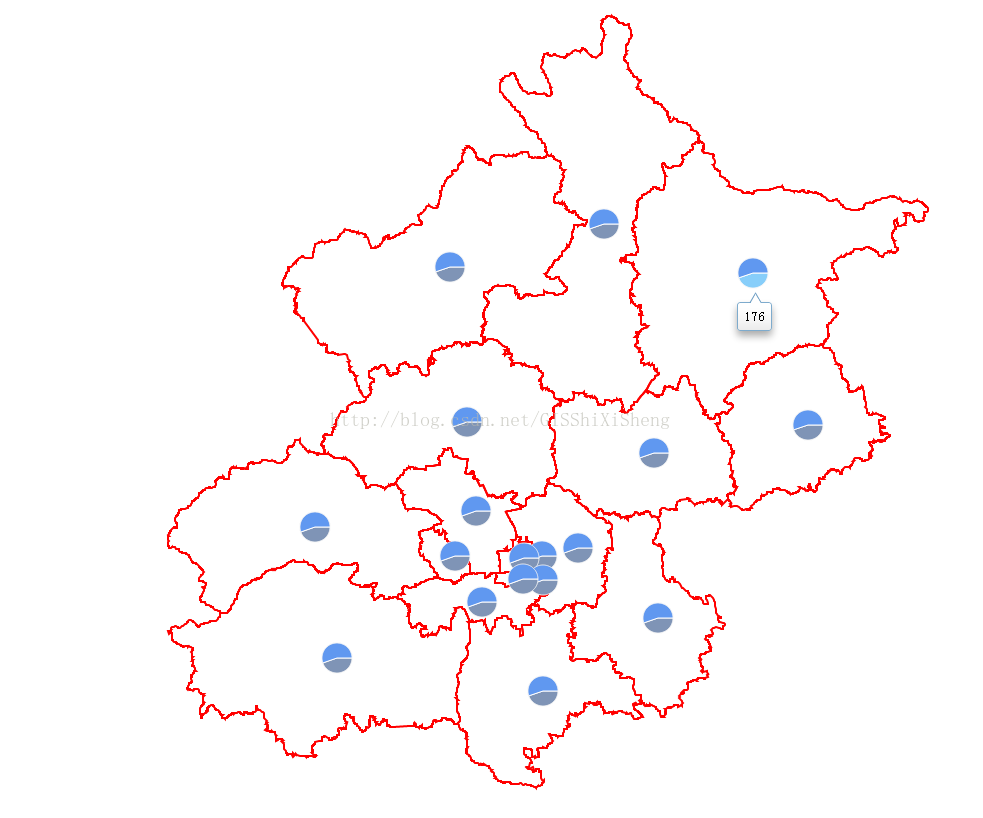
例子:添加统计图
统计图通过dojo chart实现,代码如下:
- define([
- "dojo/_base/declare",
- "esri/layers/GraphicsLayer",
- "esri/geometry/Point",
- "esri/graphic",
- "dojox/charting/Chart2D",
- "dojox/charting/themes/PlotKit/blue",
- "dojox/charting/action2d/Highlight",
- "dojox/charting/action2d/Tooltip"
- ], function (
- declare,
- GraphicsLayer,
- Point,
- Graphic,
- Chart2D,
- theme,
- Highlight,
- Tooltip
- ) {
- return declare([GraphicsLayer], {
- constructor: function(options) {
- this._id = options.id || "";
- this._divId = options.chartDiv || "chart";
- this._charttype = options.chartType || "Pie";
- this._chartSize = options.size || 50;
- },
- // 重构esri/layers/GraphicsLayer方法
- _setMap: function(map, surface) {
- // GraphicsLayer will add its own listener here
- var div = this.inherited(arguments);
- return div;
- },
- _unsetMap: function() {
- this.inherited(arguments);
- },
- hide: function() {
- dojo.style(dojo.byId(this._divId),{
- "display": "none"
- });
- },
- show: function() {
- dojo.style(dojo.byId(this._divId),{
- "display": ""
- });
- },
- //拖拽
- _onPanStartHandler: function() {
- this.hide();
- },
- //缩放
- _onZoomStartHandler:function(){
- this.hide();
- },
- _onExtentChangeHandler: function() {
- this._refresh(true);
- },
- _refresh: function(redraw) {
- var that=this;
- var gs = this.graphics,
- _draw = this._draw;
- for (i = 0; i < gs.length; i++) {
- _draw(gs[i], redraw);
- }
- this.show();
- },
- _draw:function(graphic, redraw){
- if (!this._map) {
- return;
- }
- if(graphic instanceof Graphic)//判断graphic是否为MapChartGraphic类型
- {
- this._drawChart(graphic,redraw);
- }
- },
- _drawChart:function(graphic,redraw){
- var showMapPt = graphic.geometry,
- attribute = graphic.attributes;
- var showPt = map.toScreen(showMapPt);
- var id=attribute.code,
- series = [attribute.male, attribute.female];
- if(redraw){
- dojo.byId(this._divId).removeChild(dojo.byId("div"+id));
- }
- if(attribute){
- var _chartDiv = dojo.doc.createElement("div");
- _chartDiv.id ="div"+id;
- dojo.style(_chartDiv, {
- "left": (showPt.x-this._chartSize/4) + "px",
- "top": (showPt.y-this._chartSize/2) + "px",
- "position": "absolute",
- "width": this._chartSize + "px",
- "height": this._chartSize + "px"
- });
- dojo.byId(this._divId).appendChild(_chartDiv);
- var _chart = new Chart2D(_chartDiv);
- var _themes = dojox.charting.themes.PlotKit.blue;
- _themes.chart.fill = "transparent";
- _themes.chart.stroke = "transparent";
- _themes.plotarea.fill = "transparent";
- _chart.setTheme(_themes);
- switch(this._charttype){
- case "Pie":{//饼状图
- _chart.addPlot("default", {
- type: this._charttype,
- labels:false
- });
- break;
- }
- case "StackedColumns":{//柱状堆积图
- _chart.addPlot("default", {
- type: this._charttype,
- labels:false,
- markers: true,
- gap: 2
- });
- break;
- }
- case "Lines":{//柱状堆积图
- _chart.addPlot("default", {
- type: this._charttype,
- labels:false,
- markers: true,
- radius: 1,
- tension:"X"
- });
- break;
- }
- default:{//柱状图
- _chart.addPlot("default", {
- type: this._charttype,
- labels:false,
- gap: 3
- });
- chart.addAxis("y", { vertical:true, fixLower: "major", fixUpper: "major" });
- break;
- }
- }
- _chart.addSeries(id, series,{stroke: {width:1}});
- //效果
- new Highlight(_chart, "default", {highlight: "lightskyblue"});
- new Tooltip(_chart, "default");
- _chart.render();
- }
- }
- });
- });
实现后的效果如下:
源码下载地址:
链接:http://pan.baidu.com/s/1i3EbnF3 密码:cvbf
(转)Arcgis for Js之Graphiclayer扩展详解的更多相关文章
- Arcgis for Js之Graphiclayer扩展详解
在前两节,讲到了两种不同方式的聚类,一种是基于距离的,一种是基于区域范围的,两种不同的聚类都是通过扩展esri/layers/GraphicsLayer方法来实现的.在本节,就详细的讲讲esri/la ...
- Arcgis for Js之Graphiclayer扩展具体解释
在前两节,讲到了两种不同方式的聚类,一种是基于距离的,一种是基于区域范围的,两种不同的聚类都是通过扩展esri/layers/GraphicsLayer方法来实现的.在本节,就具体的讲讲esri/la ...
- js调试工具Console命令详解
这篇文章主要介绍了js调试工具Console命令详解,需要的朋友可以参考下 一.显示信息的命令 复制代码 代码如下: < !DOCTYPE html> < html> &l ...
- JQ的offset().top与js的offsetTop区别详解
一.前言 最近在做一个图片懒加载的插件,就纵轴(Y轴)而言,我需要时时获取图片的上偏移量,好判断是否已进入视图区域,而我所理解的是offsetTop应该是跟offset().top一样的,然后陷入了因 ...
- Yii2 教程 - yii2-redis 扩展详解
该教程已被合并到<Yii2 权威指南中文版>中!Yiichina 教程地址为<yii2-redis 扩展详解>! 一.简介 yii2-redis 扩展为 Yii2 框架提供了 ...
- JQ的offset().top与JS的getBoundingClientRect区别详解,JS获取元素距离视窗顶部可变距离
壹 ❀ 引 我在 JQ的offset().top与js的offsetTop区别详解 这篇博客中详细分析了JQ方法offset().top与JS属性offsetTop的区别,并得出了一条offset( ...
- Arcgis for Js实现graphiclayer的空间查询
本节讲的是Arcgis for Js的针对graphiclayer的空间查询,内容很简单,代码如下: <!DOCTYPE html> <html> <head> & ...
- [js高手之路] es6系列教程 - 对象功能扩展详解
第一:字面量对象的方法,支持缩写形式 //es6之前,这么写 var User = { name : 'ghostwu', showName : function(){ return this.nam ...
- 【微信小程序项目实践总结】30分钟从陌生到熟悉 web app 、native app、hybrid app比较 30分钟ES6从陌生到熟悉 【原创】浅谈内存泄露 HTML5 五子棋 - JS/Canvas 游戏 meta 详解,html5 meta 标签日常设置 C#中回滚TransactionScope的使用方法和原理
[微信小程序项目实践总结]30分钟从陌生到熟悉 前言 我们之前对小程序做了基本学习: 1. 微信小程序开发07-列表页面怎么做 2. 微信小程序开发06-一个业务页面的完成 3. 微信小程序开发05- ...
随机推荐
- -- > define的用法与学习(1)
在不久之前,我一直不理解为神马大家在做题时经常用define来代替某些函数,或者用来直接定义某些极大的变量.It is not until today that I understand why it ...
- Ubuntu 16.04安装WPS
1.下载 http://community.wps.cn/download/ 根据需要对应版本进行下载deb包. 2.安装 sudo dpkg -i wps-office_10.1.0.5672~a2 ...
- 迭代器概念与traits编程技法
//迭代器是一种smart pointer template<typename T> class ListItem { public: T value() const { return _ ...
- putty SSH出现乱码
解决方法如下: 打开PuTTY主程序 选择window-〉Appearance-〉Font settings-〉点击Change.按钮,字体中选择"新宋体". 选择window-〉 ...
- Android天气预报+百度天气接口
首先 在准备编敲代码之前有几点准备工作 1首先须要调节Android的DNS地址. (这个我会在末尾提及) http://www.eoeandroid.com/forum.php? mod=viewt ...
- ARP病毒查找与防范
笔者是一名大学生,学的是网络project. 自然接触的网络就多了.当然免不了做些坏事,嘿嘿. 比如我经经常使用在网上学习的知识去測验一下我自己的电脑或者同学啥的,都是一些小打小闹. 无伤大雅,知道有 ...
- Java推断和检查网络
在实践项目中.常常要处理网络异常等问题.为此,专门设计一个类,随时能够使用. import java.io.IOException; import java.net.InetAddress; impo ...
- hdu3488Tour KM算法
//给一个有向图, //找出若干环,使得这些环覆盖全部点且每一个点仅仅能在一个环中 //问所得的全部环的全部边权值之和的最小值为多少 //对于每一个点仅仅有一个入度和一个出度.那么将每一个点拆成 // ...
- 查找两个大文件(1G以上)的相同内容PHP版
这是是一个大文件处理,面试官出题的意图并不希望你两层for循环进行遍历,这种答案肯定是不会要的! 这道题目的解法思路是: 顺序读取两个文件的的全部记录 将每条记录经过hash->转换为10进制- ...
- 一看就懂系列之 由浅入深聊一聊php的垃圾回收机制
前言 是的,平时经常听到大牛说到的gc,就是垃圾回收器,全称Garbage Collection. 早期版本,准确地说是5.3之前(不包括5.3)的垃圾回收机制,是没有专门的垃圾回收器的.只是简单的判 ...