R语言-画散点图
plot()函数
plot(cars$dist~cars$speed, # y~x
main="XXX", # 画标题
xlab="XXX", #X坐标轴标题
ylab="XXX", #Y坐标轴标题
xlim=c(0,30), #设置X轴范围为从0到30
ylim=c(0,140), #设置Y轴范围为从0到140
xaxs="i", #设置X轴风格internal
yaxs="i", #设置Y轴风格internal
col="red", #设置“散点”的颜色为红色
pch=19) #设置散点的形状为实心圆点
示例
1.数据:R自带数据集cars
>cars

>plot(cars$dist~cars$speed)
结果如下图:

>cars
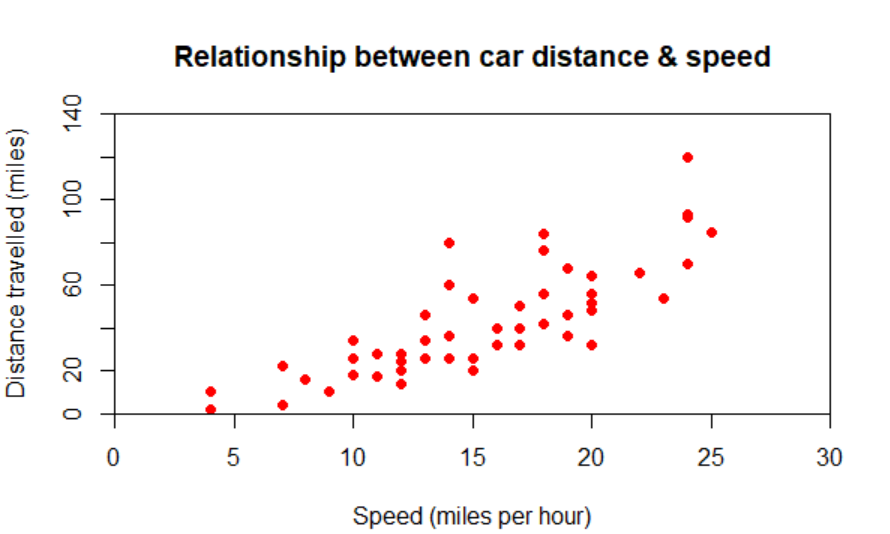
> plot(cars$dist~cars$speed, # y~x
+ main="Relationship between car distance & speed", # 画标题
+ xlab="Speed (miles per hour)", #X坐标轴标题
+ ylab="Distance travelled (miles)", #Y坐标轴标题
+ xlim=c(0,30), #设置X轴范围为从0到30
+ ylim=c(0,140), #设置Y轴范围为从0到140
+ xaxs="i", #设置X轴风格internal
+ yaxs="i", #设置Y轴风格internal
+ col="red", #设置“散点”的颜色为红色
+ pch=19) #设置散点的形状为实心圆点
结果如下图:
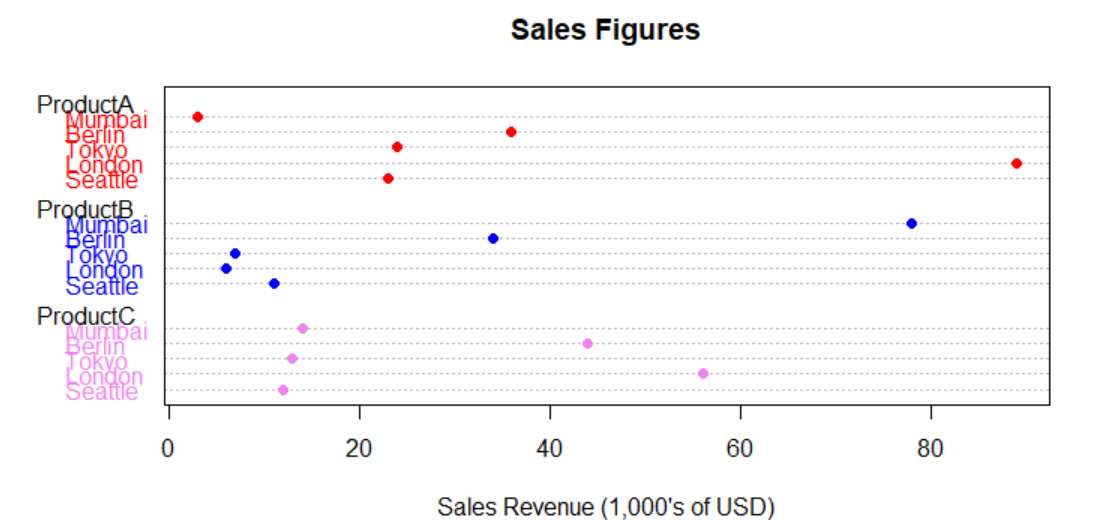
2.点图
> library(reshape)

> sales<-melt(citysales)                                  #把宽表融合成窄表

> sales$color[sales[,2]=="ProductA"] <- "red"             #sales数据增加color这一列

> sales$color[sales[,2]=="ProductB"] <- "blue"

> sales$color[sales[,2]=="ProductC"] <- "violet"

> dotchart(sales[,3],               #画点图
+ labels=sales$City,                #标城市名
+ groups=sales[,2],                 #按第二列分类

+ col=sales$color,pch=19,

+ main="Sales Figures",

+ xlab="Sales Revenue (1,000's of USD)")
R语言-画散点图的更多相关文章
- R语言-画线图
R语言分高水平作图函数和低水平作图函数 高水平作图函数:可以独立绘图,例如plot() 低水平作图函数:必须先运行高水平作图函数绘图,然后再加画在已有的图上面 第一种方法:plot()函数 > ...
- R语言画棒状图(bar chart)和误差棒(error bar)
假设我们现在有CC,CG,GG三种基因型及三种基因型对应的表型,我们现在想要画出不同的基因型对应表型的棒状图及误差棒.整个命令最重要的就是最后一句了,用arrows函数画误差棒.用到的R语言如下: d ...
- R语言画点状误差线
现在项目需要R语言做几个线性拟合,画一些点图,突然需要画误差线,网上找了下,可以用代码实现..效果如下 xx1<-c(xxxxxx,xxxx,xxxxx) yy1<-c(xxxxxx,xx ...
- r语言之散点图绘制及参数
一个简单的例子: > plot(cars$dist~cars$speed,+ main="车位移与速度的关系",+ xlab="速度",+ ylab=&q ...
- R语言画全基因组关联分析中的曼哈顿图(manhattan plot)
1.在linux中安装好R 2.准备好画曼哈顿图的R脚本即manhattan.r,manhattan.r内容如下: #!/usr/bin/Rscript #example : Rscript plot ...
- r语言之散点图类型type参数
type参数用来控制所生成散点图的类型,有如下几个选项: type=“p”表示绘制单独的点 type=“l”表示绘制点连成的折线 type=“b”表示有线连接的点 type=“o”表示将点绘在线上 t ...
- R语言画曲线图
本文以1950年到2010年期间我国的火灾统计数据为例,数据如下所示: (0)加载数据 data<-read.csv("E:\\MyDocument\\p\\Data\\1950~20 ...
- 用R语言 画条形图(基于ggplot2包)
1.用qplot(x,data=data,geom.=”bar”,weight=y)+scale_y_continuous("y")画出y关于x的条形. 图中提示binwidth这 ...
- R语言画云字图
install.packages('wordcloud') library(wordcloud) colors=c('red','blue','green','yellow','purple') da ...
随机推荐
- REST framwork之认证,权限与频率
认证组件 局部视图认证 在app01.service.auth.py: class Authentication(BaseAuthentication): def authenticate(self, ...
- oracle SQL语句取本周本月本年的数据
--国内从周一到周日 国外是周日到周六 select to_char(sysdate-1,'D') from dual;--取国内的星期几 去掉减一取国外的星期 --取本周时间内的数据 ,)+) an ...
- git创建远程项目并进行代码管理及相关命令
1.windows下载Git https://git-scm.com/downloads 然后一路点击安装 2.登录github,点击右上角创建仓库 3.在本地项目根目录下 输入如下命令 ss ...
- mongod 安装,增删改查
SQL - MySQL Oracel DB2 sybase MSSQLMySQL : PHP > LAMPMySQL - 关系型数据库 - 语言学习成本高user_infoid name ...
- mySQL InnoDB 的性能问题讨论
https://ncisoft.iteye.com/blog/34676 https://www.douban.com/note/245895324/ MySQL最为人垢病的缺点就是缺乏事务的支持,M ...
- MySQL提供了以下三种方法用于获取数据库对象的元数据
MySQL提供了以下三种方法用于获取数据库对象的元数据: 1)show语句 2)从INFORMATION_SCHEMA数据库里查询相关表 3)命令行程序,如mysqlshow, mysqldump 用 ...
- Jquery ajax 参数 详解
Jquery ajax 参数主要如下: url: 要求为String类型的参数,(默认为当前页地址)发送请求的地址. type: 要求为String类型的参数,请求方式(post或get)默认为get ...
- python学习过程中的踩坑记录<若干,随时更新>
问题1:python中print的连串输出与java不一样? 输入print(code +"+++"); --在代码中写入,界面未报错,但是告诉你不行 会报错,如图: 解决办法: ...
- python学习之----导航树
findAll 函数通过标签的名称和属性来查找标签 .但是如果你需要通过标签在文档中的位 置来查找标签,该怎么办?这就是导航树(Navigating Trees)的作用.在第1 章里,我们 看过用单一 ...
- 遇到的问题&思考
MYSQL需要批量修改表前缀: http://jingyan.baidu.com/article/11c17a2c742561f446e39d2f.html Select CONCAT( 'ALTER ...