change grayscale to pseudo colouring using colormap in Matlab
change grayscale to pseudo colouring using colormap in Matlab
In matlab you can view a grayscale image with:
imshow(im)Which for my image im shows: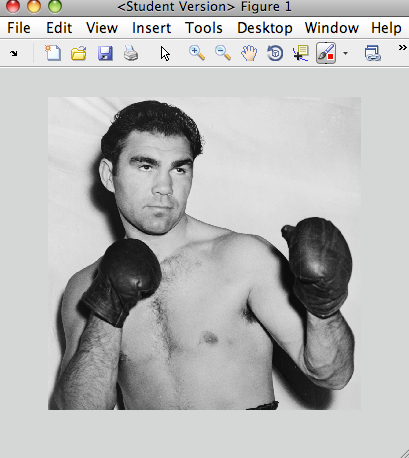
And you can also view this grayscale image using pseudocolors from a given colormap with something like:
imshow(im,'Colormap',jet(255))Which shows: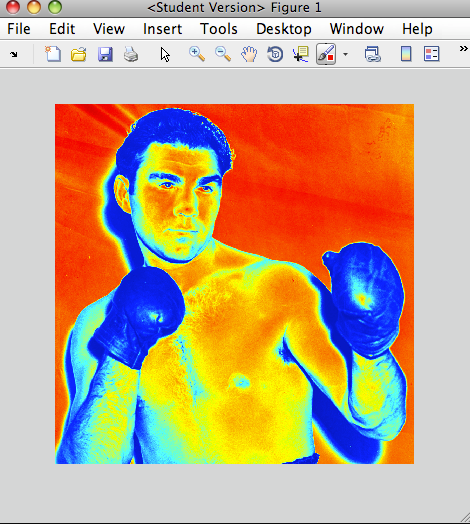
But it’s not obvious how to use the colormap to actually retrieve the RGB values we see in the plot. Here’s a simple way to convert a grayscale image to a red, green, blue color image using a given colormap:
rgb = ind2rgb(gray2ind(im,255),jet(255));Replace the 255 with the number of colors in your grayscale image. If you don’t know the number of colors in your grayscale image you can easily find out with:
n = size(unique(reshape(im,size(im,1)*size(im,2),size(im,3))),1);It’s a little overly complicated to handle if im is already a RGB image.
If you don’t mind if the rgb image comes out as a uint8 rather than double you can use the following which is an order of magnitude faster:
rgb = label2rgb(gray2ind(im,255),jet(255));Then with your colormaped image stored in rgb you can do anything you normally would with a rgb color image, like view it:
imshow(rgb);which shows the same as above:
Possible function names include real2rgb, gray2rgb.
Tags: color, grayscale, image processing, matlab
What you are asking is to perform a pseudo colouring of an image. Doing this in MATLAB is actually quite easy. You can use the grayscale intensities as an index into a colour map, and each intensity would generate a unique colour. First, what you need to do is create a colour map that is 256 elements long, then use ind2rgb to create your colour image given the grayscale intensities / indices of your image.
There are many different colour maps that are available to you in MATLAB. Here are the current available colour maps in MATLAB without the recently added Parula colour map that was introduced in R2014:
How the colour maps work is that lower indices / grayscale values have colours that move toward the left side of the spectrum and higher indices / grayscale values have colours that move toward the right side of the spectrum.
If you want to create a colour map with 256 elements, you simply use any one of those colour maps as a function and specify 256 as the input parameter to generate a 256 element colour map for you. For example, if you wanted to use the HSV colour map, you would do this in MATLAB:
cmap = hsv(256);Now, given your grayscale image in your MATLAB workspace is stored in imageArray, simply use ind2rgb this way:
colourArray = ind2rgb(double(imageArray)+1, cmap);The first argument is the grayscale image you want to pseudocolour, and the second input is the colour map produced by any one of MATLAB's colour mapping functions. colourArray will contain your pseudo coloured image. Take note that we offset the grayscale image by 1 and also cast to double. The reason for this is because MATLAB is a 1-indexed programming language, so we have to start indexing into arrays / matrices starting at 1. Because your intensities range from [0,255], and we want to use this to index into the colour map, we must make this go from [1,256] to allow the indexing. In addition, you are most likely using uint8 images, and so adding 1 to a uint8 will simply saturate any values that are already at 255 to 255. We won't be able to go to 256. Therefore, you need to cast the image temporarily to double so that we can increase the precision of the image and then add 1 to allow the image to go to 256 if merited.
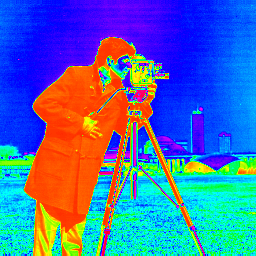
Here's an example using the cameraman.tif image that's part of the image processing toolbox. This is what it looks like:
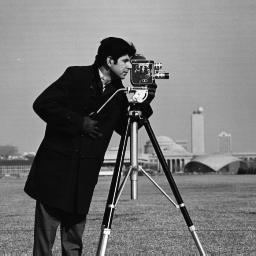
So we can load in that image in MATLAB like so:
imageArray = imread('cameraman.tif');Next, we can use the above image, generate a HSV colour map then pseudocolour the image:
cmap = hsv(256);

colourArray = ind2rgb(imageArray+1, cmap);
We get:
Take note that you don't have to use any of the colour maps that MATLAB provides. In fact, you can create your own colour map. All you have to do is create a 256 x 3 matrix where each column denotes the proportion of red (first column), green (second column) and blue (third column) values per intensity. Therefore, the first row gives you the colour that is mapped to intensity 0, the second row gives you the colour that is mapped to intensity 1 and so on. Also, you need to make sure that the intensities are floating-point and range from [0,1]. For example, these are the first 10 rows of the HSV colour map generated above:
>> cmap(1:10,:)

ans =1.0000         0         01.0000    0.0234         01.0000    0.0469         01.0000    0.0703         01.0000    0.0938         01.0000    0.1172         01.0000    0.1406         01.0000    0.1641         01.0000    0.1875         01.0000    0.2109         0
You can then use this custom colour map into ind2rgb to pseudocolour your image.
Good luck and have fun!
change grayscale to pseudo colouring using colormap in Matlab的更多相关文章
- colormap是MATLAB里面用来设定和获取当前色图的函数。
下面将举例.描述MATLAB内建的色图.用户除了可以编程指定MATLAB内建的色图,还可以使用Plot Tools图形用具界面的Figure Properties面板中的Colormap菜单来选择一种 ...
- How to Change the Size of a Box-Plot Label in MATLAB
Type "load carsmall" to load a sample data set included with MATLAB. Type "boxplot(Ho ...
- 利用matlab编写实现显示fmri切片slice图像 混合显示 不同侧面显示 可叠加t检验图显示 by DR. Rajeev Raizada
1.参考 reference 1. tutorial主页:http://www.bcs.rochester.edu/people/raizada/fmri-matlab.htm. 2.speech_b ...
- linux安装Tesseract-OCR
安装Tesseract-OCR 1. leptonica 需要源码编译安装http://www.leptonica.org/ leptonica 包: leptonica-1.73.tar.gz 解 ...
- 【论文速读】Fangfang Wang_CVPR2018_Geometry-Aware Scene Text Detection With Instance Transformation Network
Han Hu--[ICCV2017]WordSup_Exploiting Word Annotations for Character based Text Detection 作者和代码 caffe ...
- matlab学习笔记9 高级绘图命令_2 图形的高级控制_视点控制和图形旋转_色图和颜色映像_光照和着色
一起来学matlab-matlab学习笔记9 高级绘图命令_2 图形的高级控制_视点控制和图形旋转_色图和颜色映像_光照和着色 觉得有用的话,欢迎一起讨论相互学习~Follow Me 参考书籍 < ...
- matplotlib绘制热力图
版权声明:本文为博主原创文章,遵循 CC 4.0 by-sa 版权协议,转载请附上原文出处链接和本声明.本文链接:https://blog.csdn.net/jin_tmac/article/deta ...
- 利用Matlab快速绘制栅格地图
代码演示 % 基于栅格地图的机器人路径规划算法 % 第1节:利用Matlab快速绘制栅格地图 clc clear close all %% 构建颜色MAP图 cmap = [1 1 1; ... % ...
- V-rep学习笔记:机器人逆运动学数值解法(The Pseudo Inverse Method)
There are two ways of using the Jacobian matrix to solve kinematics. One is to use the transpose of ...
随机推荐
- 【转载】MDX Step by Step 读书笔记(三) - Understanding Tuples (理解元组)
1. 在 Analysis Service 分析服务中,Cube (多维数据集) 是以一个多维数据空间来呈现的.在Cube 中,每一个纬度的属性层次结构都形成了一个轴.沿着这个轴,在属性层次结构上的每 ...
- 数学还勉强管用,用代码还能画个canvas 仪表盘(含完整代码)
<!DOCTYPE html> <html lang="en"> <head> <meta charset="UTF-8&quo ...
- springboot入门神器 -http://start.spring.io/(在线项目构建)
参考并直接引用:http://www.sousou.io/article/1506656459859 最近在学习spring boot,看的书是<JavaEE开发的颠覆者 Spring Boot ...
- Springsecurity搭建自定义登录页面
1.springSecurity的搭建 新建一个springboot的web项目,我这边只选中了web,建立后如下: pom依赖: <!-- https://mvnrepository.com/ ...
- redis 持久化之 rdb 快照持久化
解释1: 虽然redis是单进程,但是它有一个单独的子进程进行rdb操作,为了保证的数据的一致性,当进行rdb操作失败的时候,主进程就停止写入 所以才有了stop-write-on-bgsave-er ...
- 《LeetBook》LeetCode题解(1) : Two Sum[E]——哈希Map的应用
001.Two Sum[E] Two SumE 题目 思路 1双重循环 2 排序 3 Hashmap 1.题目 Given an array of integers, return indices o ...
- selector.select()和selector.selectedKeys()
当调用selector.select()时会阻塞: This method performs a blocking selection operation. It returns only after ...
- mysql8.0关闭log-bin功能
一.查看log-bin是否开启: mysql> show variables like 'log-bin'; 二.关闭log-bin: 在配置文件中的 [mysqld] 配置节中增加 skip- ...
- Nginx教程(6) 负载均衡
一原理 二例子 在 nginx-1.13.0.tar.gz下测试 upstream test { server 192.168.56.90:8180 weight=1 max_fails=3 fail ...
- CentOS7手动修改系统时间
CentOS7 永久修改系统时间 安装在虚拟机上的CentOS7的时间分为系统时间和硬件时间.二者都修改,重启系统(init 6 )才会永久生效.修改步骤如下 查看当前系统时间 date 修改当 ...