Python/spss-多元回归建模-共线性诊断2(推荐AA)
python风控建模实战lendingClub(博主录制,包含大量回归建模脚本,2K超清分辨率)
https://study.163.com/course/courseMain.htm?courseId=1005988013&share=2&shareId=400000000398149

多元共线性
在一个回归方程中,假如两个或两个以上解释变量彼此高度相关,那么回归分析的结果将有可能无法分清每一个变量与因变量之间的真实关系。例如我们要知道吸毒对SAT考试分数的影响,我们会询问对象是否吸收过可卡因或海洛因,并用软件计算它们之间的系数。
虽然求出了海洛因和可卡因额回归系数,但两者相关性发生重叠,使R平方变大,依然无法揭开真实的情况。
因为吸食海洛因的人常常吸食可卡因,单独吸食一种毒品人很少。
当两个变量高度相关时,我们通常在回归方程中只采用其中一个,或创造一个新的综合变量,如吸食可卡因或海洛因。
又例如当研究员想要控制学生的整体经济背景时,他们会将父母双方的受教育程度都纳入方程式中。
如果单独把父亲或母亲的教育程度分离考虑,会引起混淆,分析变得模糊,因为丈夫和妻子的教育程度有很大相关性。
多元共线性带来问题:
(1)自变量不显著
(2)参数估计值的正负号产生影响
共线性统计量:
(1)容忍度tolerance
tolerance<0.1 表示存在严重多重共线
(2)方差扩大因子 variance inflation factor (VIF)
VIF>10表示存在严重多重共线性
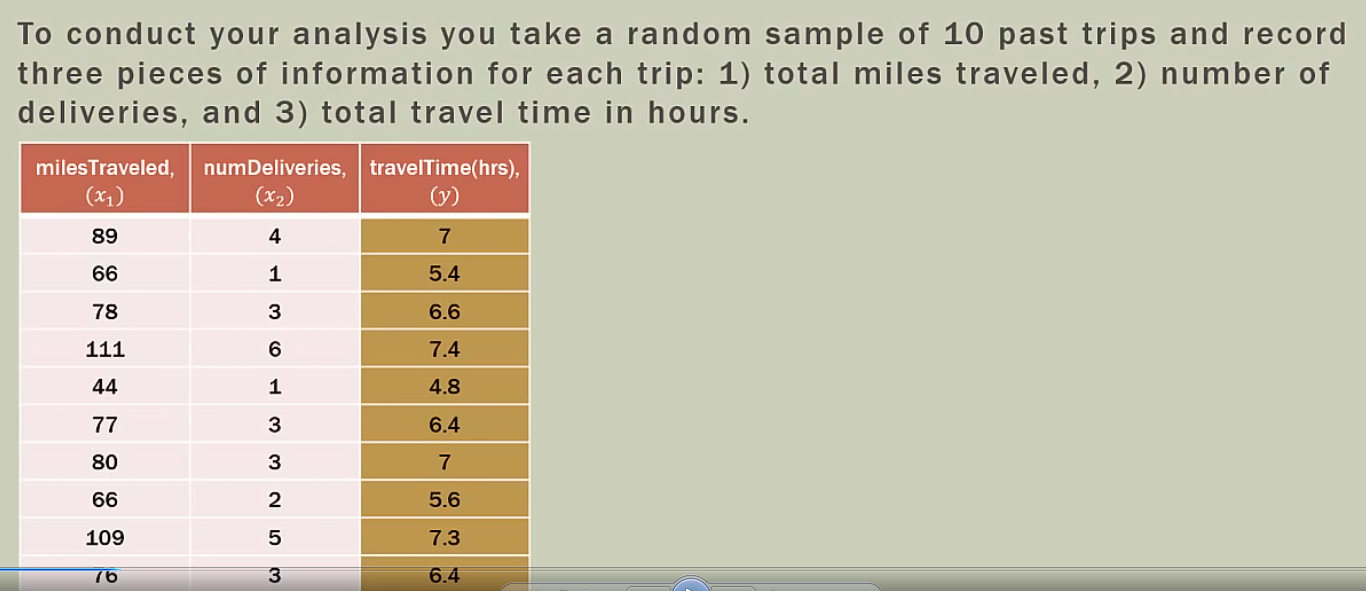
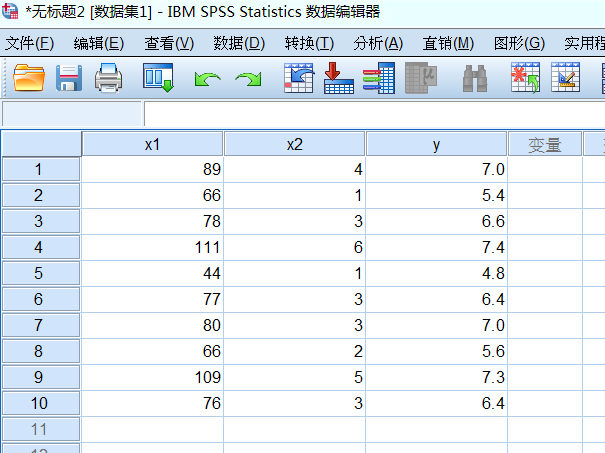
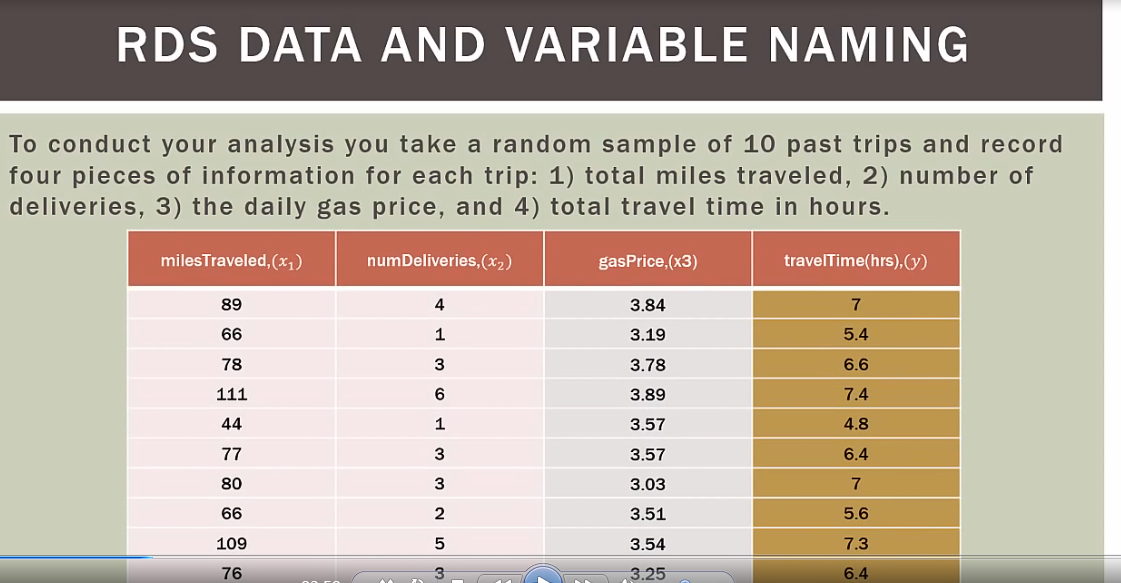
自变量为x1和x2时
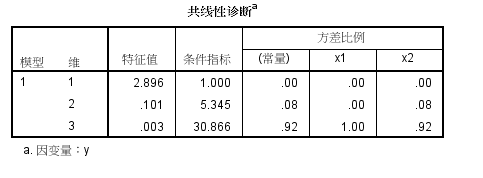
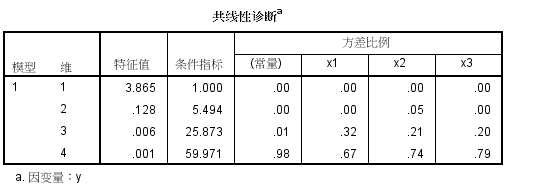
spss共线性诊断
spss导入excel数据
条件指数第三个为30.866,大于10,说明共线性很高
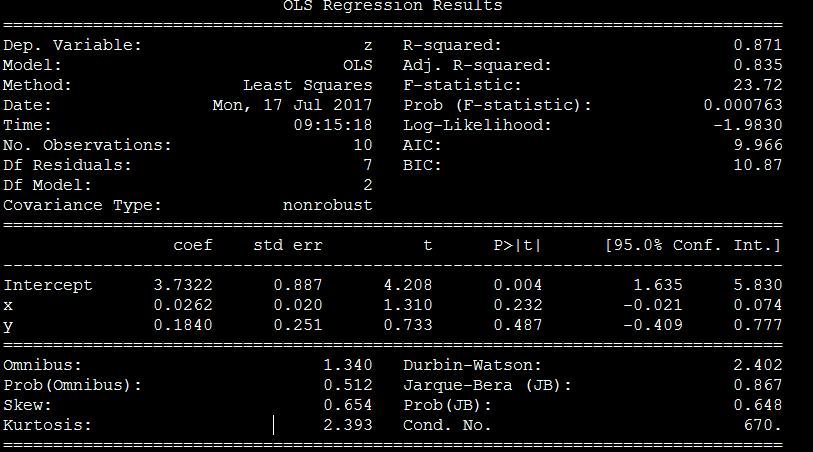
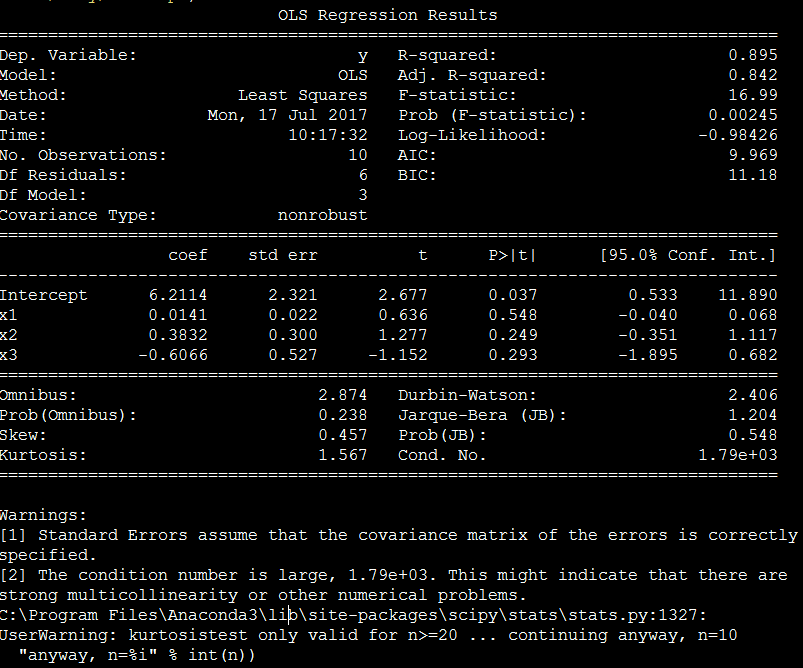
F检验是对整个模型而已的,看是不是自变量系数不全为0,这里F检验值23,对应P概率=0,P<0.05,H1成立,说明显著性非常高
t检验则是分别针对某个自变量的,看每个自变量是否有显著预测效力。这里t检验对应概率大于0.05,为0.23和0.48,说明显著性很差
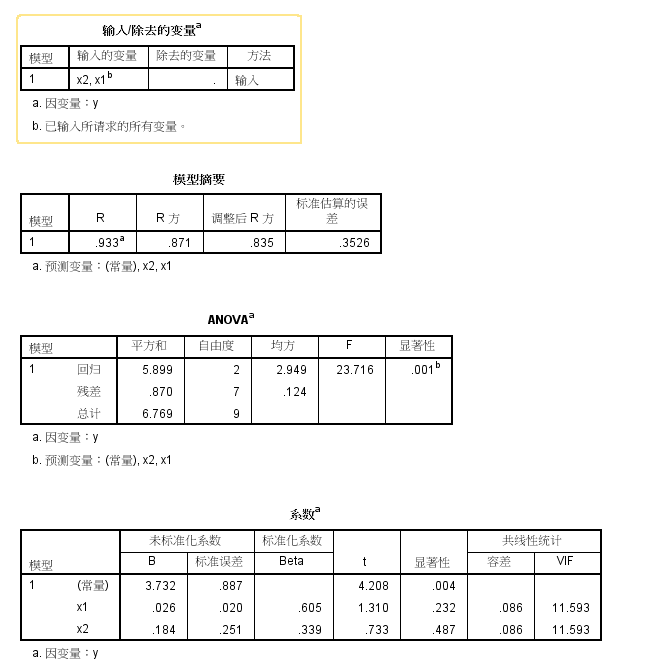
x1 的t分数p值0.232,P值>0.05,不否定H0假设,显著性不高
x2 的t分数p值0.487,P值>0.05,不否定H0假设,显著性不高
Python脚本分析
condition num=670 ,未能检测出共线性
Python目前支持2D和3D绘图,可解决两元回归绘图。但目前没发现4D绘图,即解决三元回归及其以上绘图
# -*- coding: utf-8 -*-

"""

Created on Fri Feb 23 16:54:54 2018

@author: Administrator

"""

# Import standard packages

import numpy as np

import matplotlib.pyplot as plt

import pandas as pd

import seaborn as sns

from sklearn import datasets, linear_model

from matplotlib.font_manager import FontProperties

font_set = FontProperties(fname=r"c:\windows\fonts\simsun.ttc", size=15)

# additional packages

import sys

import os

sys.path.append(os.path.join('..', '..', 'Utilities'))

try:

# Import formatting commands if directory "Utilities" is available

    from ISP_mystyle import showData

except ImportError:

# Ensure correct performance otherwise

    def showData(*options):

        plt.show()

        return

# additional packages ...

# ... for the 3d plot ...

from mpl_toolkits.mplot3d import Axes3D

from matplotlib import cm

# ... and for the statistic

from statsmodels.formula.api import ols

#生成组合

from itertools import combinations

x1=[5,2,4,2.5,3,3.5,2.5,3]

x2=[1.5,2,1.5,2.5,3.3,2.3,4.2,2.5]

y=[96,90,95,92,95,94,94,94]

#自变量列表

list_x=[x1,x2]

#绘制多元回归三维图

def Draw_multilinear():

    df = pd.DataFrame({'x1':x1,'x2':x2,'y':y})

    # --- >>> START stats <<< ---

    # Fit the model

    model = ols("y~x1+x2", df).fit()

    param_intercept=model.params[0]

    param_x1=model.params[1]

    param_x2=model.params[2]

    rSquared_adj=model.rsquared_adj

    #generate data,产生矩阵然后把数值附上去

    x = np.linspace(-5,5,101)

    (X,Y) = np.meshgrid(x,x)

    # To get reproducable values, I provide a seed value

    np.random.seed(987654321)

    Z = param_intercept + param_x1*X+param_x2*Y+np.random.randn(np.shape(X)[0], np.shape(X)[1])

    # 绘图

    #Set the color

    myCmap = cm.GnBu_r

    # If you want a colormap from seaborn use:

    #from matplotlib.colors import ListedColormap

    #myCmap = ListedColormap(sns.color_palette("Blues", 20))

    # Plot the figure

    fig = plt.figure("multi")

    ax = fig.gca(projection='3d')

    surf = ax.plot_surface(X,Y,Z, cmap=myCmap, rstride=2, cstride=2,

        linewidth=0, antialiased=False)

    ax.view_init(20,-120)

    ax.set_xlabel('X')

    ax.set_ylabel('Y')

    ax.set_zlabel('Z')

    ax.set_title("multilinear with adj_Rsquare %f"%(rSquared_adj))

    fig.colorbar(surf, shrink=0.6)

    outFile = '3dSurface.png'

    showData(outFile)

#检查独立变量之间共线性关系

def Two_dependentVariables_compare(x1,x2):

    # Convert the data into a Pandas DataFrame

    df = pd.DataFrame({'x':x1, 'y':x2})

    # Fit the model

    model = ols("y~x", df).fit()

    rSquared_adj=model.rsquared_adj

    print("rSquared_adj",rSquared_adj)

    if rSquared_adj>=0.8:

        print("high relation")

        return True

    elif 0.6<=rSquared_adj<0.8:

         print("middle relation")

         return False

    elif rSquared_adj<0.6:

         print("low relation")

         return False

#比较所有参数,观察是否存在多重共线

def All_dependentVariables_compare(list_x):

    list_status=[]

    list_combine=list(combinations(list_x, 2))

    for i in list_combine:

        x1=i[0]

        x2=i[1]

        status=Two_dependentVariables_compare(x1,x2)

        list_status.append(status)

    if True in list_status:

        print("there is multicorrelation exist in dependent variables")

        return True

    else:

        return False

#回归方程,支持哑铃变量

def regressionModel(x1,x2,y):

    '''Multilinear regression model, calculating fit, P-values, confidence intervals etc.'''

    # Convert the data into a Pandas DataFrame

    df = pd.DataFrame({'x1':x1,'x2':x2,'y':y})

    # --- >>> START stats <<< ---

    # Fit the model

    model = ols("y~x1+x2", df).fit()

    # Print the summary

    print((model.summary()))

    return model._results.params  # should be array([-4.99754526,  3.00250049, -0.50514907])

# Function to show the resutls of linear fit model

def Draw_linear_line(X_parameters,Y_parameters,figname,x1Name,x2Name):

    #figname表示图表名字,用于生成独立图表fig1 = plt.figure('fig1'),fig2 = plt.figure('fig2')

    plt.figure(figname)

    #获取调整R方参数

    df = pd.DataFrame({'x':X_parameters, 'y':Y_parameters})

    # Fit the model

    model = ols("y~x", df).fit()

    rSquared_adj=model.rsquared_adj

    #处理X_parameter1数据

    X_parameter1 = []

    for i in X_parameters:

        X_parameter1.append([i])

    # Create linear regression object

    regr = linear_model.LinearRegression()

    regr.fit(X_parameter1, Y_parameters)

    plt.scatter(X_parameter1,Y_parameters,color='blue',label="real value")

    plt.plot(X_parameter1,regr.predict(X_parameter1),color='red',linewidth=4,label="prediction line")

    plt.title("linear regression %s and %s with adj_rSquare:%f"%(x1Name,x2Name,rSquared_adj))

    plt.xlabel('x', fontproperties=font_set)

    plt.ylabel('y', fontproperties=font_set)

    plt.xticks(())

    plt.yticks(())

    plt.legend()

    plt.show()

#绘制多元回归三维图

Draw_multilinear()

#比较所有参数,观察是否存在多重共线

All_dependentVariables_compare(list_x)

Draw_linear_line(x1,x2,"fig1","x1","x2")

Draw_linear_line(x1,y,"fig4","x1","y")

Draw_linear_line(x2,y,"fig5","x2","y")

regressionModel(x1,x2,y)
当自变量为x1,x2,x3三个时
spss分析
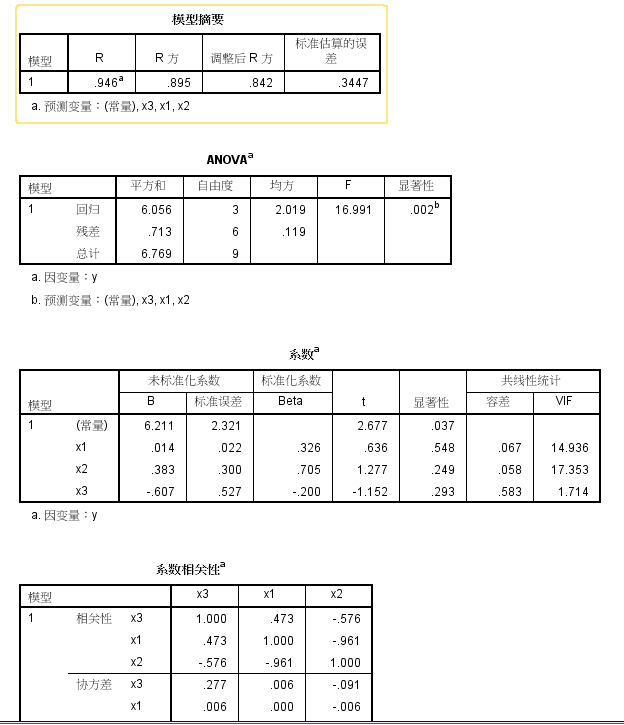
python脚本
程序运行后,cond.no数值过高,提醒有多重共线可能
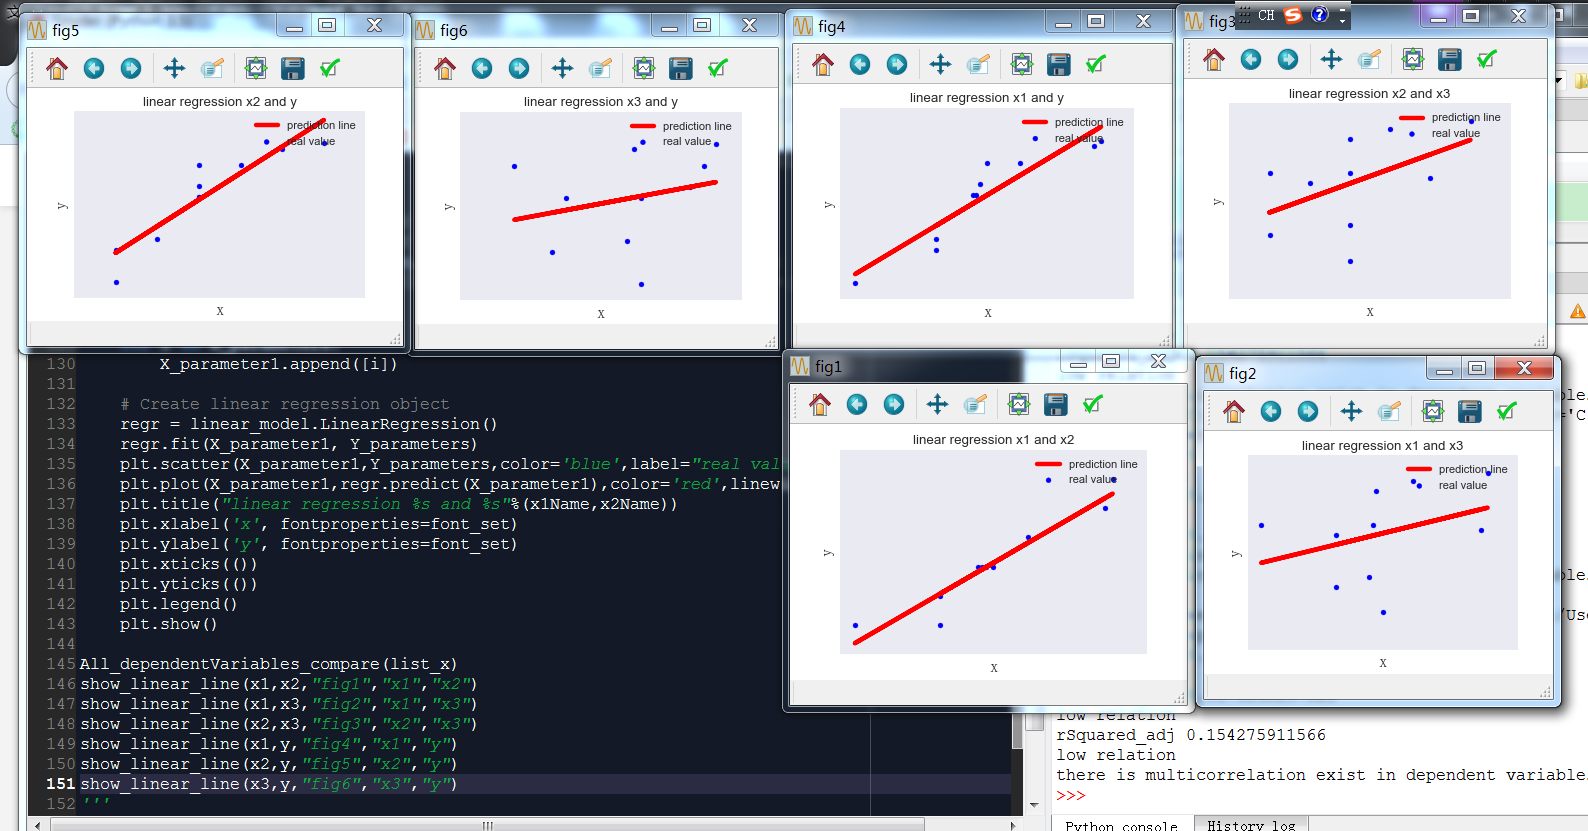
可视化分析
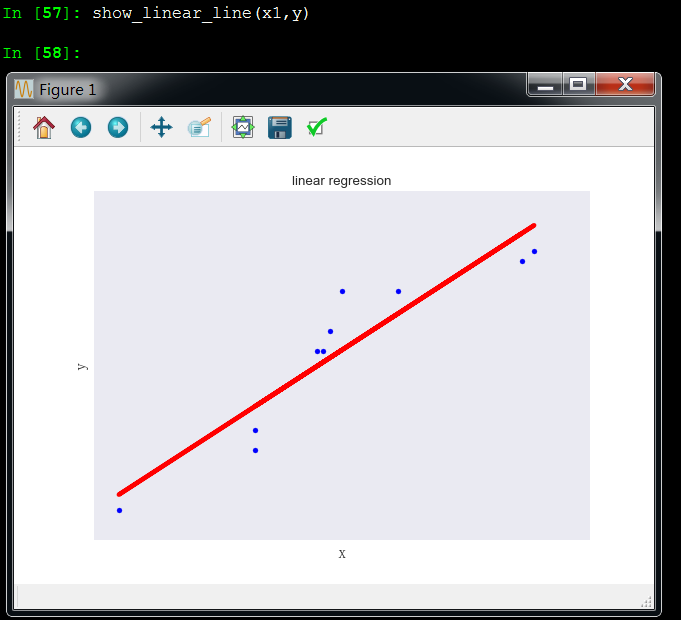
x1和y成线性关系
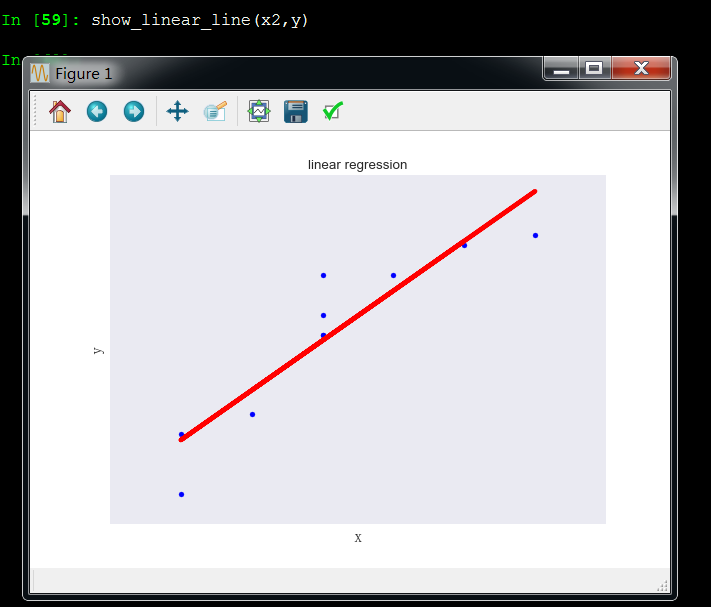
x2和y成线性关系
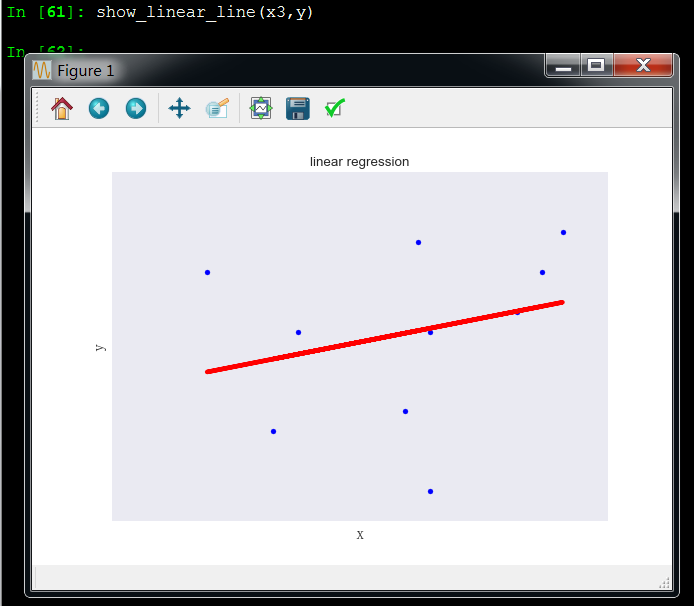
x3和y成非线性关系,所以x3变量应该剔除,和y没啥关系
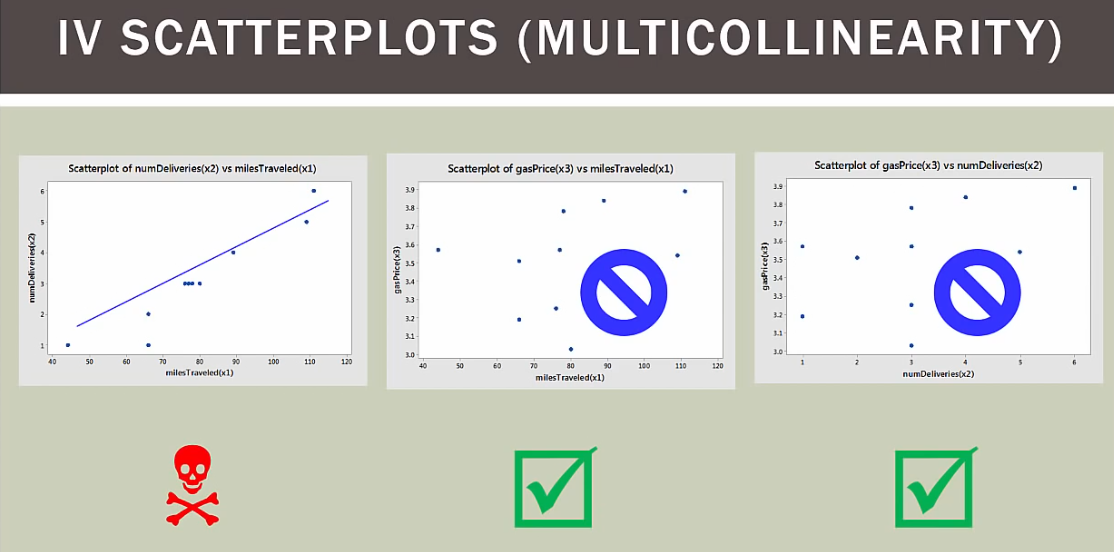
x1和x2成线性关系,这引起了多重共线性问题
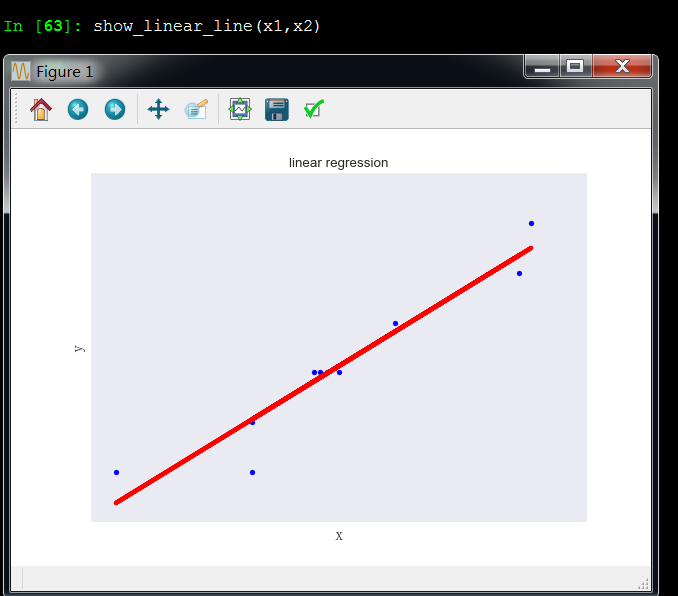
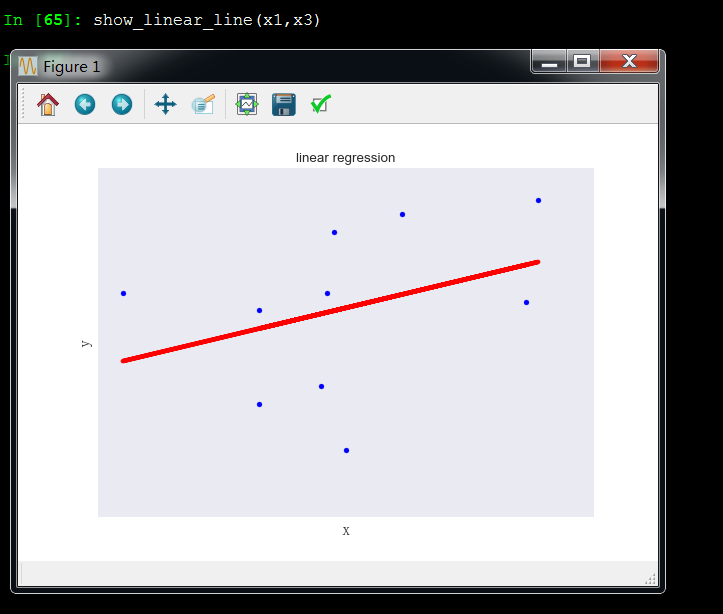
x1和x3成非线性关系
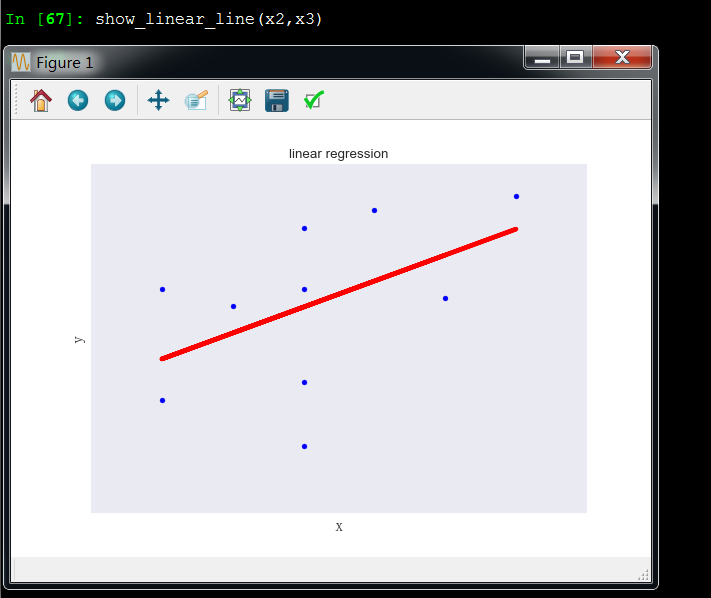
x2和x3成非线性关系
multiLinearIsBetterThanSimpleLinearRegression1.py
从excel调取数据,适用于数据量百万级分析
# -*- coding: utf-8 -*-

"""

Created on Fri Feb 23 16:54:54 2018

@author: Toby QQ:231469242

多元回归的多重共线性检测,数据可视化

"""

# Import standard packages

import matplotlib.pyplot as plt

import pandas as pd

from sklearn import linear_model

from matplotlib.font_manager import FontProperties

font_set = FontProperties(fname=r"c:\windows\fonts\simsun.ttc", size=15)

# ... and for the statistic

from statsmodels.formula.api import ols

#生成组合

from itertools import combinations

df=pd.read_excel("旅行公里-投递数量-行驶时间.xlsx")

array_values=df.values

x1=[i[0] for i in array_values]

x2=[i[1] for i in array_values]

x3=[i[2] for i in array_values]

y=[i[3] for i in array_values]

sample=len(x1)

#自变量列表

list_x=[x1,x2]

#检查独立变量之间共线性关系,如果两个变量有共线性返回TRUE,反之返回FALSE

def Two_dependentVariables_compare(x1,x2):

    # Convert the data into a Pandas DataFrame

    df = pd.DataFrame({'x':x1, 'y':x2})

    # Fit the model

    model = ols("y~x", df).fit()

    rSquared_adj=model.rsquared_adj

    print("rSquared_adj",rSquared_adj)

    if rSquared_adj>=0.8:

        print("high relation")

        return True

    elif 0.6<=rSquared_adj<0.8:

         print("middle relation")

         return False

    elif rSquared_adj<0.6:

         print("low relation")

         return False

#比较所有参数,观察是否存在多重共线

def All_dependentVariables_compare(list_x):

    list_status=[]

    #对变量列表的多个自变量进行组合,2个为一组

    list_combine=list(combinations(list_x, 2))

    for i in list_combine:

        x1=i[0]

        x2=i[1]

        status=Two_dependentVariables_compare(x1,x2)

        list_status.append(status)

    if True in list_status:

        print("there is multicorrelation exist in dependent variables")

        return True

    else:

        return False

#回归方程,支持哑铃变量,这个函数是有三个自变量,自变量个数可以自己改

def regressionModel(x1,x2,x3,y):

    '''Multilinear regression model, calculating fit, P-values, confidence intervals etc.'''

    # Convert the data into a Pandas DataFrame

    df = pd.DataFrame({'x1':x1, 'x2':x2,'x3':x3,'y':y})

    # --- >>> START stats <<< ---

    # Fit the model

    model = ols("y~x1+x2+x3", df).fit()

    # Print the summary

    print((model.summary()))

    # --- >>> STOP stats <<< ---

    return model._results.params  # should be array([-4.99754526,  3.00250049, -0.50514907])

# Function to show the resutls of linear fit model

def Draw_linear_line(X_parameters,Y_parameters,figname,x1Name,x2Name):

    #figname表示图表名字,用于生成独立图表fig1 = plt.figure('fig1'),fig2 = plt.figure('fig2')

    plt.figure(figname)

    #获取调整R方参数

    df = pd.DataFrame({'x':X_parameters, 'y':Y_parameters})

    # Fit the model

    model = ols("y~x", df).fit()

    rSquared_adj=model.rsquared_adj

    #处理X_parameter1数据

    X_parameter1 = []

    for i in X_parameters:

        X_parameter1.append([i])

    # Create linear regression object

    regr = linear_model.LinearRegression()

    regr.fit(X_parameter1, Y_parameters)

    plt.scatter(X_parameter1,Y_parameters,color='blue',label="real value")

    plt.plot(X_parameter1,regr.predict(X_parameter1),color='red',linewidth=4,label="prediction line")

    plt.title("linear regression %s and %s with adj_rSquare:%f"%(x1Name,x2Name,rSquared_adj))

    plt.xlabel('x', fontproperties=font_set)

    plt.ylabel('y', fontproperties=font_set)

    plt.xticks(())

    plt.yticks(())

    plt.legend()

    plt.show()

#比较所有参数,观察是否存在多重共线

All_dependentVariables_compare(list_x)

#两个变量散点图可视化

Draw_linear_line(x1,x2,"fig1","x1","x2")

Draw_linear_line(x1,x3,"fig2","x1","x3")

Draw_linear_line(x2,x3,"fig3","x2","x3")

Draw_linear_line(x1,y,"fig4","x1","y")

Draw_linear_line(x2,y,"fig5","x2","y")

Draw_linear_line(x3,y,"fig6","x3","y")

#回归分析

regressionModel(x1,x2,x3,y)
多元回归共线性详细解释
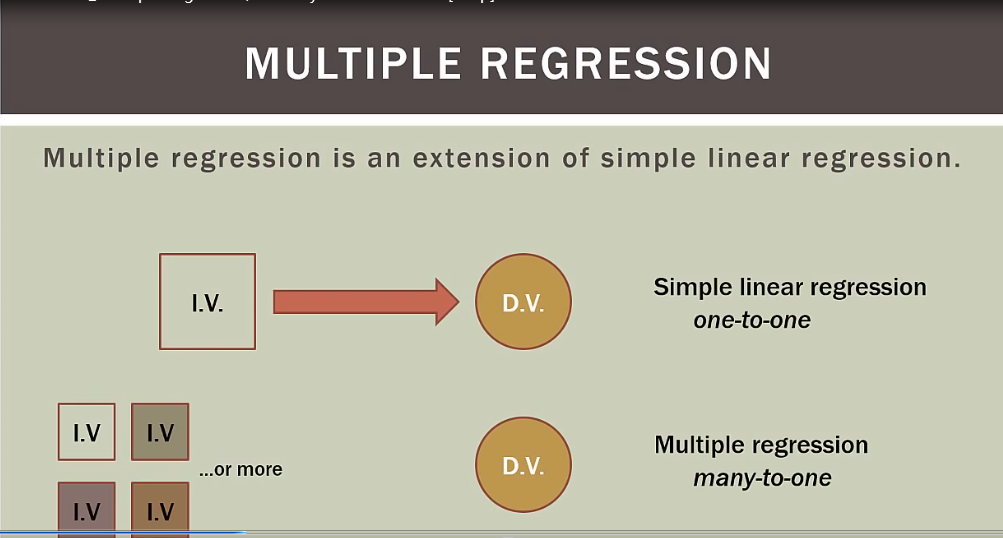
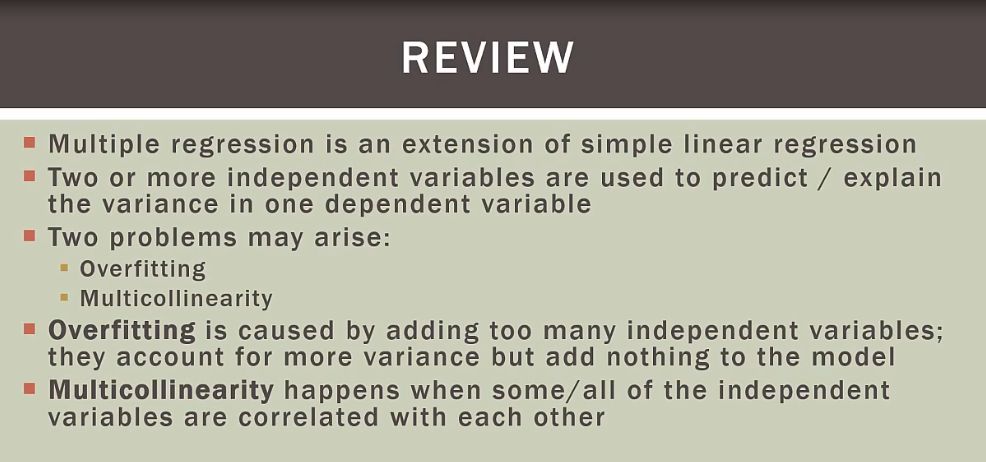
多元回归是一元回归升级版,含有多个变量
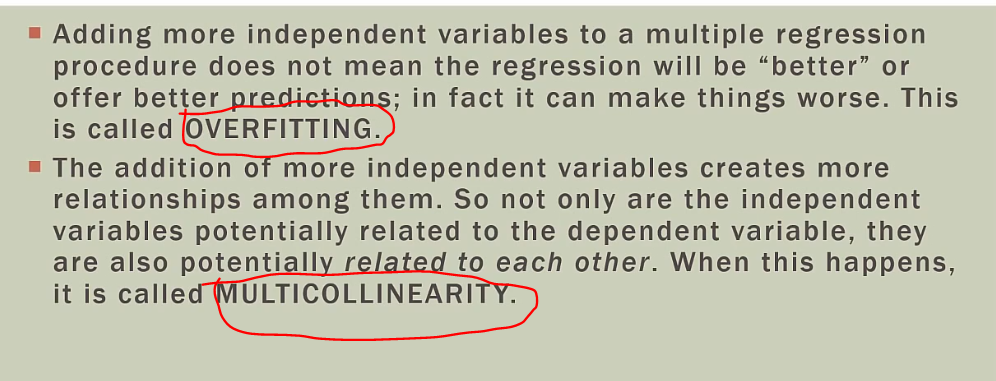
overffiting:过多独立变量不一定会让模型更好,事实上可能更糟
multicollinearity:变量之间互相关联,造成多重共线
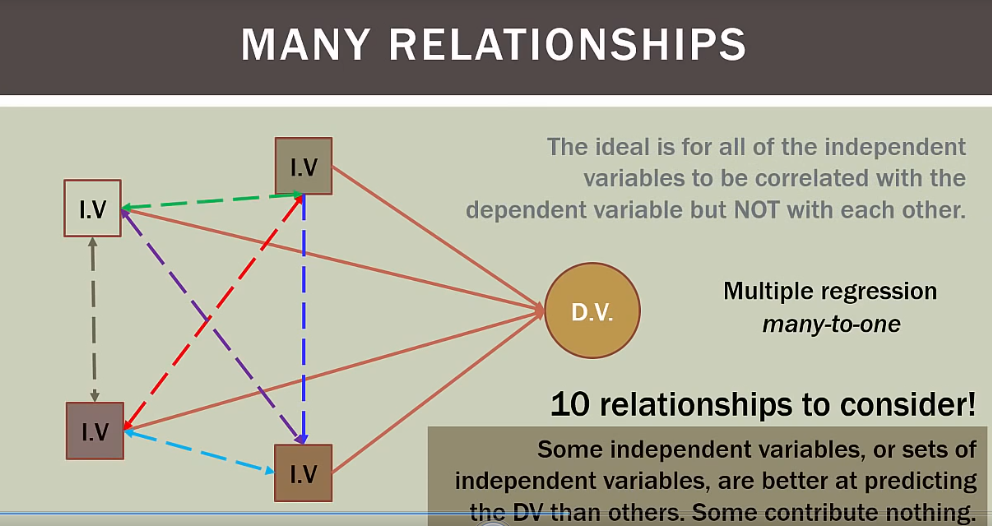
理想模型是所有独立变量和依赖变量都相关,但独立变量之间不能相互关联,独立变量必须独立

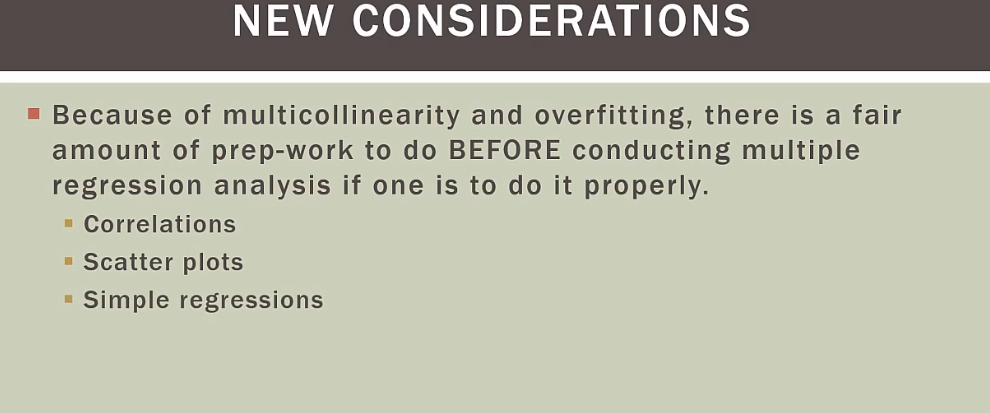
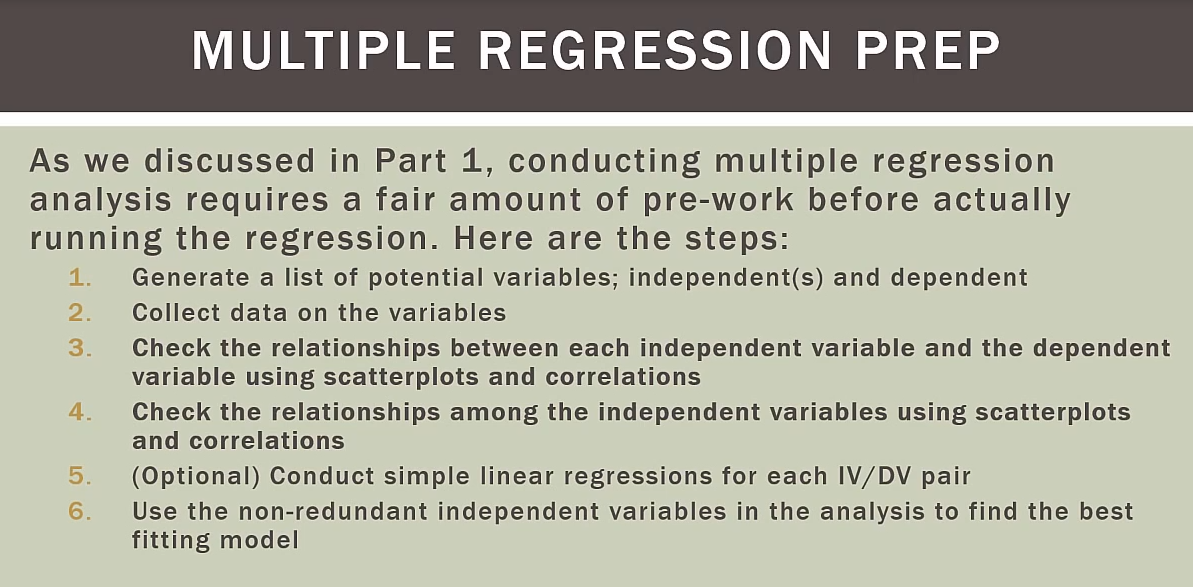
多元回归有很多事前工作做,包括发行overffitng和multilinear
独立变量之间有潜在的多重共线可能

如果有四个变量,就有十种关系考虑
总结
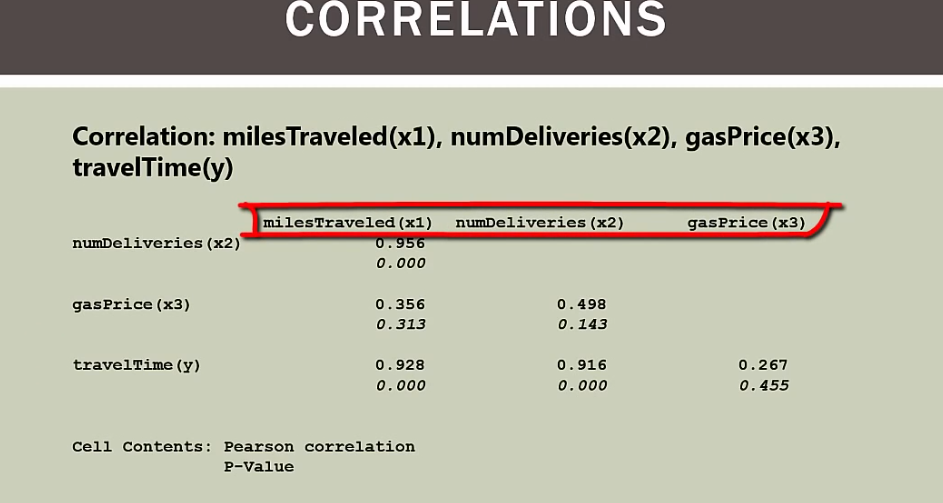
x1和x2有多重共线性
python信用评分卡建模(附代码,博主录制)
微信扫二维码,免费学习更多python资源

Python/spss-多元回归建模-共线性诊断2(推荐AA)的更多相关文章
- Python/spss-多元回归建模-共线性诊断1(推荐A)
欢迎关注博主主页,学习python视频资源,还有大量免费python经典文章 sklearn实战-乳腺癌细胞数据挖掘 https://study.163.com/course/introduction ...
- python抓取51CTO博客的推荐博客的全部博文,对标题分词存入mongodb中
原文地址: python抓取51CTO博客的推荐博客的全部博文,对标题分词存入mongodb中
- 支持向量机SVM原理_python sklearn建模乳腺癌细胞分类器(推荐AAA)
项目合作联系QQ:231469242 sklearn实战-乳腺癌细胞数据挖掘(博主亲自录制视频) https://study.163.com/course/introduction.htm?cours ...
- 优秀Python学习资源收集汇总(强烈推荐)
Python是一种面向对象.直译式计算机程序设计语言.它的语法简捷和清晰,尽量使用无异义的英语单词,与其它大多数程序设计语言使用大括号不一样,它使用縮进来定义语句块.与Scheme.Ruby.Perl ...
- Python 黑客相关电子资源和书籍推荐
原创 2017-06-03 玄魂工作室 玄魂工作室 继续上一次的Python编程入门的资源推荐,本次为大家推荐的是Python网络安全相关的资源和书籍. 在去年的双11送书的时候,其实送过几本Pyth ...
- 神经网络1_neuron network原理_python sklearn建模乳腺癌细胞分类器(推荐AAA)
sklearn实战-乳腺癌细胞数据挖掘(博客主亲自录制视频教程) https://study.163.com/course/introduction.htm?courseId=1005269003&a ...
- 5款Python程序员高频使用开发工具推荐
很多Python学习者想必都会有如下感悟:最开始学习Python的时候,因为没有去探索好用的工具,吃了很多苦头.后来工作中深刻体会到,合理使用开发的工具的便利和高效.今天,我就把Python程序员使用 ...
- 用Python爬取大众点评数据,推荐火锅店里最受欢迎的食品
前言 文的文字及图片来源于网络,仅供学习.交流使用,不具有任何商业用途,版权归原作者所有,如有问题请及时联系我们以作处理. 作者:有趣的Python PS:如有需要Python学习资料的小伙伴可以加点 ...
- Python实现性能自动化测试的方法【推荐好文】
1.什么是性能自动化测试? ◆ 性能 △ 系统负载能力 △ 超负荷运行下的稳定性 △ 系统瓶颈 ◆ 自动化测试 △ 使用程序代替手工 △ 提升测试效率 ◆ 性能自动化 △ 使用代码模拟大批量用户 △ ...
随机推荐
- 阿里IPO法律咨询费达1580万美元 为Facebook六倍
据路透社报道,阿里巴巴集团周五在 IPO (首次公开招股)更新文件中披露,将向美国盛信律师事务所(Simpson Thacher)以及其他为 IPO 提供咨询服务的律师事务所支付 1580 万美元的法 ...
- SQL行列轉換方法(詳細例子)
普通行列转换(version 1.0)仅针对sql server 2000提供静态和动态写法,version 2.0增加sql server 2005的有关写法. 问题:假设有张学生成绩表(tb)如下 ...
- 关于 WebView 知识点的详解
什么是 WebView WebView 是手机中内置了一款高性能 webkit 内核浏览器,在 SDK 中封装的一个组件.没有提供地址栏和导航栏, WebView 只是单纯的展示一个网页界面.在开发中 ...
- Linux发行版本应用场景
如果你是一个Linux爱好者,想选择一个桌面系统,并且既不想用盗版,又不想花太多钱购买商业系统软件,那么可以选择Ubuntu桌面系统.如果你需要服务器端的Linux系统,想用一个比较稳定的服务器系统, ...
- 评价Win8自带输入法
对于人机交互设计,有以下四个基本原则:从用户角度考虑.从头到尾记住用户选择.短期刺激和长期使用的好处坏处.不让用户犯简单错误.我用的最多的是我的系统自带的输入法,评价的也只能是它了. 1.从用户角度: ...
- java程序连接MySQL数据库
驱动程序:mysql-connector-java-5.1.7-bin.jar. 程序示例如下: package commonProject; import java.sql.Connection; ...
- openssl 加密算法 CA 介绍
首先对于tftp服务的简要使用说明 (1)yum安装:tftp.tftp-server (2)启动tftp CentOS 6 service xinetd restart chkconfig tf ...
- Java实现的词频统计——单元测试
前言:本次测试过程中发现了几个未知字符,这里将其转化为十六进制码对其加以区分. 1)保存统计结果的Result文件中显示如图: 2)将其复制到eclipse环境下的切分方法StringTokenize ...
- oracle 行转列和列转行
WITH L AS ( ), m AS ( SELECT A.LV AS LV_A, B.LV AS LV_B, TO_CHAR(B.LV) || 'x' || TO_CHAR(A.LV) || '= ...
- PHP面向对象之重写
覆盖(override): 基本概念 覆盖,又叫“重写”: 含义: 将一个类从父类中继承过来的属性和方法“重新定义”——此时相当于子类不想用父类的该属性或方法,而是想要定义. 覆盖的现实需要: 对于一 ...