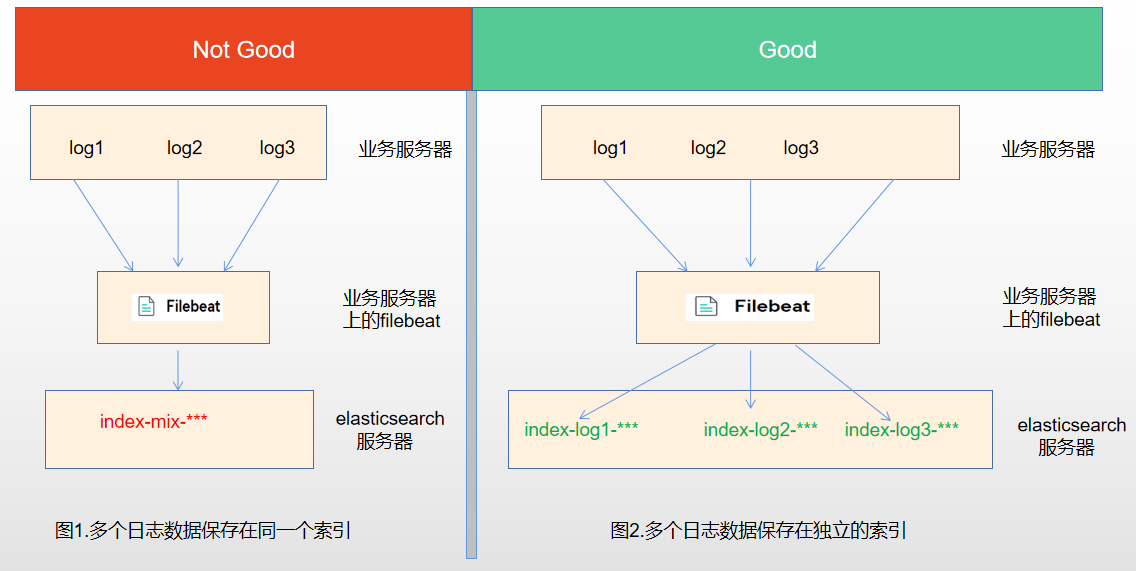
filebeat输出结果到elasticsearch的多个索引
- 将同一台服务器上的日志收集到elasticsearch的同一个索引中,这种方式存在一个较大的问题,如果服务器上有多个业务在运行,产生了多个日志,那么将会被收集到elasticsearch的同一个索引中,如图1。
- 将同一台服务器上的日志收集到elasticsearch的不同索引中,每个索引都存放相关业务的日志,如图2。
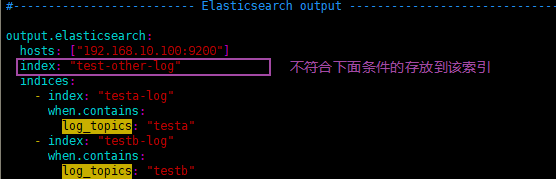
- testa.log日志的数据存放到testa-log索引中
- testb.log日志的数据存放到testb-log索引中
- 其它(非testa.log和testb.log)的日志数据存放到test-other-log索引中


###################### Filebeat Configuration Example ######################### # This file is an example configuration file highlighting only the most common
# options. The filebeat.reference.yml file from the same directory contains all the
# supported options with more comments. You can use it as a reference.
#
# You can find the full configuration reference here:
# https://www.elastic.co/guide/en/beats/filebeat/index.html # For more available modules and options, please see the filebeat.reference.yml sample
# configuration file. #=========================== Filebeat inputs ============================= filebeat.inputs: # Each - is an input. Most options can be set at the input level, so
# you can use different inputs for various configurations.
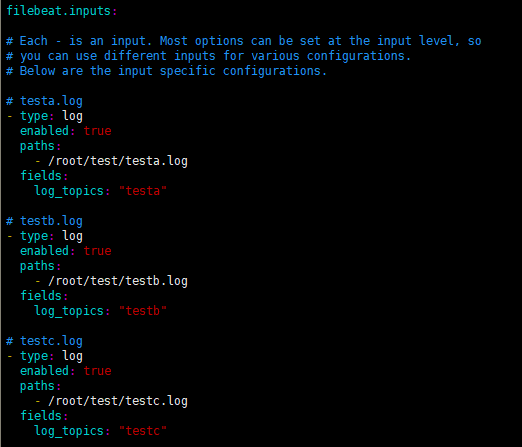
# Below are the input specific configurations. # testa.log
- type: log
enabled: true
paths:
- /root/test/testa.log
fields:
log_topics: "testa"
fields_under_root: true # testb.log
- type: log
enabled: true
paths:
- /root/test/testb.log
fields:
log_topics: "testb"
fields_under_root: true # testc.log
- type: log
enabled: true
paths:
- /root/test/testc.log
fields:
log_topics: "testc"
fields_under_root: true # Exclude lines. A list of regular expressions to match. It drops the lines that are
# matching any regular expression from the list.
#exclude_lines: ['^DBG'] # Include lines. A list of regular expressions to match. It exports the lines that are
# matching any regular expression from the list.
#include_lines: ['^ERR', '^WARN'] # Exclude files. A list of regular expressions to match. Filebeat drops the files that
# are matching any regular expression from the list. By default, no files are dropped.
#exclude_files: ['.gz$'] # Optional additional fields. These fields can be freely picked
# to add additional information to the crawled log files for filtering
#fields:
# level: debug
# review: 1 ### Multiline options # Multiline can be used for log messages spanning multiple lines. This is common
# for Java Stack Traces or C-Line Continuation # The regexp Pattern that has to be matched. The example pattern matches all lines starting with [
#multiline.pattern: ^\[ # Defines if the pattern set under pattern should be negated or not. Default is false.
#multiline.negate: false # Match can be set to "after" or "before". It is used to define if lines should be append to a pattern
# that was (not) matched before or after or as long as a pattern is not matched based on negate.
# Note: After is the equivalent to previous and before is the equivalent to to next in Logstash
#multiline.match: after #============================= Filebeat modules =============================== filebeat.config.modules:
# Glob pattern for configuration loading
path: ${path.config}/modules.d/*.yml # Set to true to enable config reloading
reload.enabled: true # Period on which files under path should be checked for changes
#reload.period: 10s #==================== Elasticsearch template setting ========================== setup.template.settings:
index.number_of_shards: 1
#index.codec: best_compression
#_source.enabled: false
setup.template.name: "prod-file*"
setup.template.pattern: "prod-file*"
setup.ilm.enabled: false
#================================ General ===================================== # The name of the shipper that publishes the network data. It can be used to group
# all the transactions sent by a single shipper in the web interface.
#name: # The tags of the shipper are included in their own field with each
# transaction published.
#tags: ["service-X", "web-tier"] # Optional fields that you can specify to add additional information to the
# output.
#fields:
# env: staging #============================== Dashboards =====================================
# These settings control loading the sample dashboards to the Kibana index. Loading
# the dashboards is disabled by default and can be enabled either by setting the
# options here or by using the `setup` command.
#setup.dashboards.enabled: false # The URL from where to download the dashboards archive. By default this URL
# has a value which is computed based on the Beat name and version. For released
# versions, this URL points to the dashboard archive on the artifacts.elastic.co
# website.
#setup.dashboards.url: #============================== Kibana ===================================== # Starting with Beats version 6.0.0, the dashboards are loaded via the Kibana API.
# This requires a Kibana endpoint configuration.
setup.kibana: # Kibana Host
# Scheme and port can be left out and will be set to the default (http and 5601)
# In case you specify and additional path, the scheme is required: http://localhost:5601/path
# IPv6 addresses should always be defined as: https://[2001:db8::1]:5601
#host: "localhost:5601" # Kibana Space ID
# ID of the Kibana Space into which the dashboards should be loaded. By default,
# the Default Space will be used.
#space.id: #============================= Elastic Cloud ================================== # These settings simplify using Filebeat with the Elastic Cloud (https://cloud.elastic.co/). # The cloud.id setting overwrites the `output.elasticsearch.hosts` and
# `setup.kibana.host` options.
# You can find the `cloud.id` in the Elastic Cloud web UI.
#cloud.id: # The cloud.auth setting overwrites the `output.elasticsearch.username` and
# `output.elasticsearch.password` settings. The format is `<user>:<pass>`.
#cloud.auth: #================================ Outputs ===================================== # Configure what output to use when sending the data collected by the beat. #-------------------------- Elasticsearch output ------------------------------
#output.elasticsearch:
# hosts: ["192.168.10.30:9200"]
# index: "testlog-666" #output.elasticsearch:
# hosts: ["192.168.10.30:9200"]
# indices:
# - index: "testa-log"
# when.contains:
# log_topics: "testa"
# - index: "testb-log"
# when.contains:
# log_topics: "testb" output.elasticsearch:
hosts: ["192.168.10.100:9200"]
index: "test-other-log"
indices:
- index: "testa-log"
when.contains:
log_topics: "testa"
- index: "testb-log"
when.contains:
log_topics: "testb"
#----------------------------- Logstash output --------------------------------
#output.logstash:
# The Logstash hosts
#hosts: ["localhost:5044"] # Optional SSL. By default is off.
# List of root certificates for HTTPS server verifications
#ssl.certificate_authorities: ["/etc/pki/root/ca.pem"] # Certificate for SSL client authentication
#ssl.certificate: "/etc/pki/client/cert.pem" # Client Certificate Key
#ssl.key: "/etc/pki/client/cert.key" #================================ Processors ===================================== # Configure processors to enhance or manipulate events generated by the beat. #================================ Logging ===================================== # Sets log level. The default log level is info.
# Available log levels are: error, warning, info, debug
#logging.level: debug # At debug level, you can selectively enable logging only for some components.
# To enable all selectors use ["*"]. Examples of other selectors are "beat",
# "publish", "service".
#logging.selectors: ["*"] #============================== Xpack Monitoring ===============================
# filebeat can export internal metrics to a central Elasticsearch monitoring
# cluster. This requires xpack monitoring to be enabled in Elasticsearch. The
# reporting is disabled by default. # Set to true to enable the monitoring reporter.
#monitoring.enabled: false # Uncomment to send the metrics to Elasticsearch. Most settings from the
# Elasticsearch output are accepted here as well.
# Note that the settings should point to your Elasticsearch *monitoring* cluster.
# Any setting that is not set is automatically inherited from the Elasticsearch
# output configuration, so if you have the Elasticsearch output configured such
# that it is pointing to your Elasticsearch monitoring cluster, you can simply
# uncomment the following line.
#monitoring.elasticsearch: #================================= Migration ================================== # This allows to enable 6.7 migration aliases
#migration.6_to_7.enabled: true
###################### Filebeat Configuration Example ######################### # This file is an example configuration file highlighting only the most common
# options. The filebeat.reference.yml file from the same directory contains all the
# supported options with more comments. You can use it as a reference.
#
# You can find the full configuration reference here:
# https://www.elastic.co/guide/en/beats/filebeat/index.html # For more available modules and options, please see the filebeat.reference.yml sample
# configuration file. #=========================== Filebeat inputs ============================= filebeat.inputs: # Each - is an input. Most options can be set at the input level, so
# you can use different inputs for various configurations.
# Below are the input specific configurations. # testa.log
- type: log
enabled: true
paths:
- /root/test/testa.log
fields:
log_topics: "testa" # testb.log
- type: log
enabled: true
paths:
- /root/test/testb.log
fields:
log_topics: "testb" # testc.log
- type: log
enabled: true
paths:
- /root/test/testc.log
fields:
log_topics: "testc" # Exclude lines. A list of regular expressions to match. It drops the lines that are
# matching any regular expression from the list.
#exclude_lines: ['^DBG'] # Include lines. A list of regular expressions to match. It exports the lines that are
# matching any regular expression from the list.
#include_lines: ['^ERR', '^WARN'] # Exclude files. A list of regular expressions to match. Filebeat drops the files that
# are matching any regular expression from the list. By default, no files are dropped.
#exclude_files: ['.gz$'] # Optional additional fields. These fields can be freely picked
# to add additional information to the crawled log files for filtering
#fields:
# level: debug
# review: 1 ### Multiline options # Multiline can be used for log messages spanning multiple lines. This is common
# for Java Stack Traces or C-Line Continuation # The regexp Pattern that has to be matched. The example pattern matches all lines starting with [
#multiline.pattern: ^\[ # Defines if the pattern set under pattern should be negated or not. Default is false.
#multiline.negate: false # Match can be set to "after" or "before". It is used to define if lines should be append to a pattern
# that was (not) matched before or after or as long as a pattern is not matched based on negate.
# Note: After is the equivalent to previous and before is the equivalent to to next in Logstash
#multiline.match: after #============================= Filebeat modules =============================== filebeat.config.modules:
# Glob pattern for configuration loading
path: ${path.config}/modules.d/*.yml # Set to true to enable config reloading
reload.enabled: true # Period on which files under path should be checked for changes
#reload.period: 10s #==================== Elasticsearch template setting ========================== setup.template.settings:
index.number_of_shards: 1
#index.codec: best_compression
#_source.enabled: false
setup.template.name: "prod-file*"
setup.template.pattern: "prod-file*"
setup.ilm.enabled: false
#================================ General ===================================== # The name of the shipper that publishes the network data. It can be used to group
# all the transactions sent by a single shipper in the web interface.
#name: # The tags of the shipper are included in their own field with each
# transaction published.
#tags: ["service-X", "web-tier"] # Optional fields that you can specify to add additional information to the
# output.
#fields:
# env: staging #============================== Dashboards =====================================
# These settings control loading the sample dashboards to the Kibana index. Loading
# the dashboards is disabled by default and can be enabled either by setting the
# options here or by using the `setup` command.
#setup.dashboards.enabled: false # The URL from where to download the dashboards archive. By default this URL
# has a value which is computed based on the Beat name and version. For released
# versions, this URL points to the dashboard archive on the artifacts.elastic.co
# website.
#setup.dashboards.url: #============================== Kibana ===================================== # Starting with Beats version 6.0.0, the dashboards are loaded via the Kibana API.
# This requires a Kibana endpoint configuration.
setup.kibana: # Kibana Host
# Scheme and port can be left out and will be set to the default (http and 5601)
# In case you specify and additional path, the scheme is required: http://localhost:5601/path
# IPv6 addresses should always be defined as: https://[2001:db8::1]:5601
#host: "localhost:5601" # Kibana Space ID
# ID of the Kibana Space into which the dashboards should be loaded. By default,
# the Default Space will be used.
#space.id: #============================= Elastic Cloud ================================== # These settings simplify using Filebeat with the Elastic Cloud (https://cloud.elastic.co/). # The cloud.id setting overwrites the `output.elasticsearch.hosts` and
# `setup.kibana.host` options.
# You can find the `cloud.id` in the Elastic Cloud web UI.
#cloud.id: # The cloud.auth setting overwrites the `output.elasticsearch.username` and
# `output.elasticsearch.password` settings. The format is `<user>:<pass>`.
#cloud.auth: #================================ Outputs ===================================== # Configure what output to use when sending the data collected by the beat. #-------------------------- Elasticsearch output ------------------------------
#output.elasticsearch:
# hosts: ["192.168.10.30:9200"]
# index: "testlog-666" #output.elasticsearch:
# hosts: ["192.168.10.30:9200"]
# indices:
# - index: "testa-log"
# when.contains:
# log_topics: "testa"
# - index: "testb-log"
# when.contains:
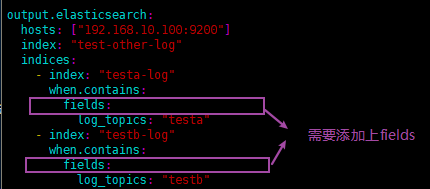
# log_topics: "testb" output.elasticsearch:
hosts: ["192.168.10.100:9200"]
index: "test-other-log"
indices:
- index: "testa-log"
when.contains:
fields:
log_topics: "testa"
- index: "testb-log"
when.contains:
fields:
log_topics: "testb"
#----------------------------- Logstash output --------------------------------
#output.logstash:
# The Logstash hosts
#hosts: ["localhost:5044"] # Optional SSL. By default is off.
# List of root certificates for HTTPS server verifications
#ssl.certificate_authorities: ["/etc/pki/root/ca.pem"] # Certificate for SSL client authentication
#ssl.certificate: "/etc/pki/client/cert.pem" # Client Certificate Key
#ssl.key: "/etc/pki/client/cert.key" #================================ Processors ===================================== # Configure processors to enhance or manipulate events generated by the beat. #================================ Logging ===================================== # Sets log level. The default log level is info.
# Available log levels are: error, warning, info, debug
#logging.level: debug # At debug level, you can selectively enable logging only for some components.
# To enable all selectors use ["*"]. Examples of other selectors are "beat",
# "publish", "service".
#logging.selectors: ["*"] #============================== Xpack Monitoring ===============================
# filebeat can export internal metrics to a central Elasticsearch monitoring
# cluster. This requires xpack monitoring to be enabled in Elasticsearch. The
# reporting is disabled by default. # Set to true to enable the monitoring reporter.
#monitoring.enabled: false # Uncomment to send the metrics to Elasticsearch. Most settings from the
# Elasticsearch output are accepted here as well.
# Note that the settings should point to your Elasticsearch *monitoring* cluster.
# Any setting that is not set is automatically inherited from the Elasticsearch
# output configuration, so if you have the Elasticsearch output configured such
# that it is pointing to your Elasticsearch monitoring cluster, you can simply
# uncomment the following line.
#monitoring.elasticsearch: #================================= Migration ================================== # This allows to enable 6.7 migration aliases
#migration.6_to_7.enabled: true
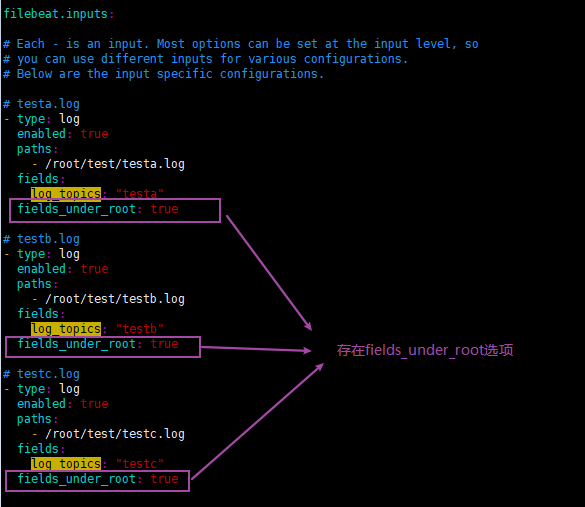
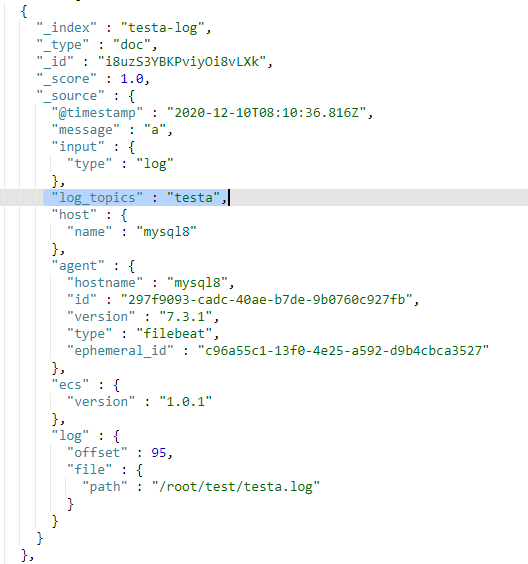
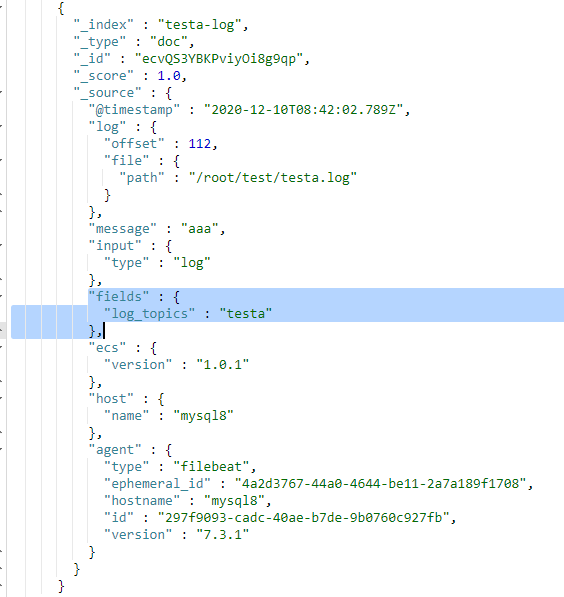
- 如果值为ture,那么fields存储在输出文档的顶级位置,如果与filebeat中字段冲突,自定义字段会覆盖其他字段
- 如果值为false或者未设置,那么fields存储在输出文档的子位置。
filebeat输出结果到elasticsearch的多个索引的更多相关文章
- 使用ElasticSearch赋能HBase二级索引 | 实践一年后总结
前言:还记得那是2018年的一个夏天,天气特别热,我一边擦汗一边听领导大刀阔斧的讲述自己未来的改革蓝图.会议开完了,核心思想就是:我们要搞一个数据大池子,要把公司能灌的数据都灌入这个大池子,然后让别人 ...
- 第三百六十二节,Python分布式爬虫打造搜索引擎Scrapy精讲—elasticsearch(搜索引擎)基本的索引和文档CRUD操作、增、删、改、查
第三百六十二节,Python分布式爬虫打造搜索引擎Scrapy精讲—elasticsearch(搜索引擎)基本的索引和文档CRUD操作.增.删.改.查 elasticsearch(搜索引擎)基本的索引 ...
- (转)ElasticSearch Java Api-检索索引库
上篇博客记录了如何用java调用api把数据写入索引,这次记录下如何搜索. 一.准备数据 String data1 = JsonUtil.model2Json(new Blog(1, "gi ...
- 四十一 Python分布式爬虫打造搜索引擎Scrapy精讲—elasticsearch(搜索引擎)基本的索引和文档CRUD操作、增、删、改、查
elasticsearch(搜索引擎)基本的索引和文档CRUD操作 也就是基本的索引和文档.增.删.改.查.操作 注意:以下操作都是在kibana里操作的 elasticsearch(搜索引擎)都是基 ...
- Elasticsearch之curl创建索引
前提,是 Elasticsearch之curl创建索引库 [hadoop@djt002 elasticsearch-2.4.3]$ curl -XPUT 'http://192.168.80.200: ...
- Elasticsearch之curl创建索引库
关于curl的介绍,请移步 Elasticsearch学习概念之curl 启动es,请移步 Elasticsearch的前后台运行与停止(tar包方式) Elasticsearch的前后台运行与停止( ...
- Elasticsearch之curl删除索引库
关于curl创建索引库的介绍,请移步 Elasticsearch之curl创建索引库 [hadoop@djt002 elasticsearch-2.4.3]$ curl -XPUT 'http://1 ...
- Elasticsearch之curl创建索引库和索引时注意事项
前提, Elasticsearch之curl创建索引库 Elasticsearch之curl创建索引 注意事项 1.索引库名称必须要全部小写,不能以下划线开头,也不能包含逗号 2.如果没有明确指定索引 ...
- Elasticsearch之cur查询索引
前提, Elasticsearch之curl创建索引库 Elasticsearch之curl创建索引 Elasticsearch之curl创建索引库和索引时注意事项 Elasticsearch之cur ...
随机推荐
- 1、线性DP 213. 打家劫舍 II
https://leetcode-cn.com/problems/house-robber-ii/ //rob 0, not rob n-1 || not rob 0,not rob n-1 ==&g ...
- redis乐观锁
乐观锁(又名乐观并发控制,Optimistic Concurrency Control,缩写"OCC"),是一种并发控制的方法.它假设多用户并发的事务在处理时不会彼此互相影响,各事 ...
- mdtest测试工具
软件介绍 mdstest是软件的元数据操作基准测试工具,用来模拟对文件或者目录的open.stat.close操作,然后报告性能 下载软件压缩包: yum install openmpi openmp ...
- Jmeter 处理接口乱码
第一步:添加 BeanShell Listener 第二步: 设置值 : prev.setDataEncoding("UTF-8") 第三步: 重新跑脚本,看接口返回值
- MySQL 四种隔离级别详解,看完吊打面试官
转发链接:https://zhuanlan.zhihu.com/p/76743929 什么是事务 事务是应用程序中一系列严密的操作,所有操作必须成功完成,否则在每个操作中所作的所有更改都会被撤消.也就 ...
- SNMP介绍及使用,超有用,建议收藏!
写在前面 如果你是对SNMP完全不了解,或者只想学习如何使用现成的SNMP工具,那你找对了文章,但如果你希望学习SNMP具体协议内容,推荐阅读官方的RFC文档. 1. 简介 SNMP(Simple N ...
- JVM简单入门
目录 初识JVM 双亲委派机制 沙箱安全机制 Native PC计数器 方法区 栈 堆 工具分析OOM GC算法 GC算法总结 JMM 初识JVM JVM的位置:jre中包含jvm. 双亲委派机制 双 ...
- exec() has been disabled for security reasons
1.修改php.ini里面:disable_functions 2.重启服务器 2.如果是虚拟机,就重启虚拟机
- 如何在Guitar Pro上添加吉他和弦
Guitar Pro是一款很适合广大吉他爱好者的优秀吉他谱学习与制谱软件,吉他爱好者可以使用它来更好的辅助自己学习吉他.在我们根据弹唱时,都会跟着谱子上标记的和弦来弹奏,不同的和弦有着不同的风格,或暗 ...
- css3系列之transform 详解scale
scale() scaleX() scaleY() scaleZ() scale3d() 改变的不是元素的宽高,而是 X 和 Y 轴的刻度 本章有个很冷门的知识点 → scale 和 rotate 一 ...